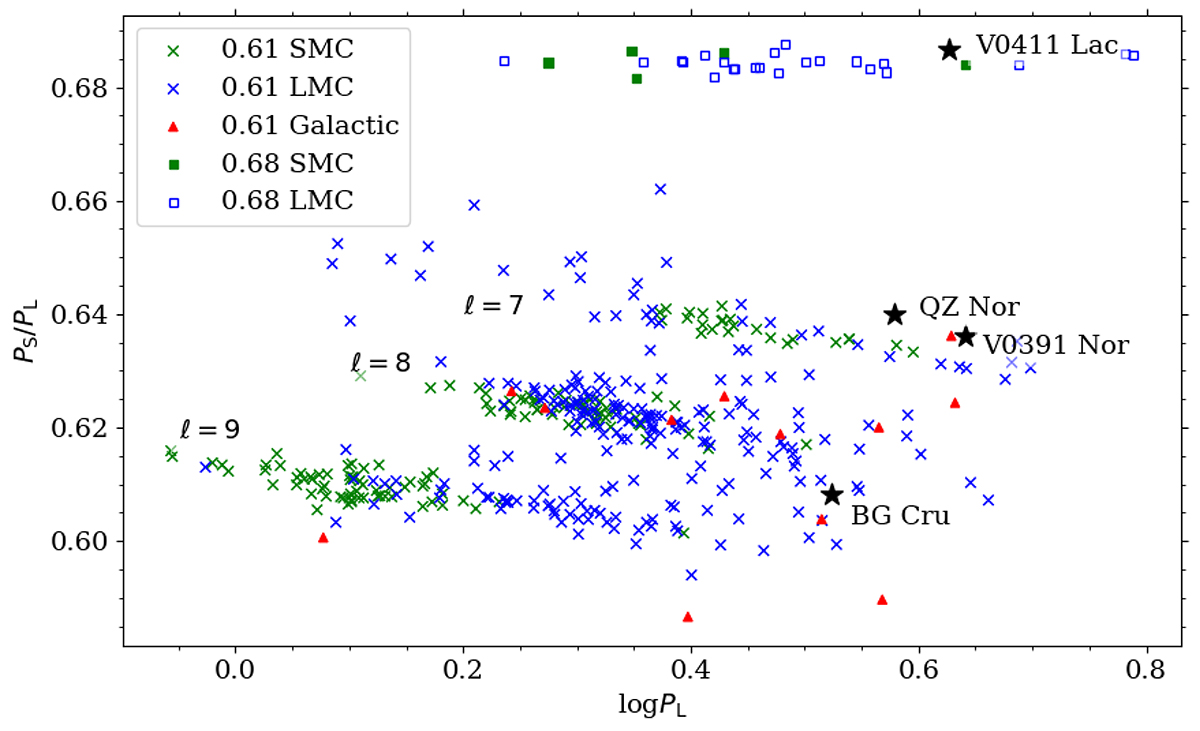
Fig. 5.
Download original image
Petersen diagram for 0.61 and 0.68 stars. The green points correspond to Cepheids from the SMC, the blue points correspond to Cepheids from the LMC, and the red points correspond to Cepheids from the Galactic disk (Rathour et al. 2021). Our stars are plotted with black asterisks using values based on the FWHM. The interpretation of individual sequences, i.e. the degree of the non-radial mode, according to the theory by Dziembowski (2016) is marked in the figure.
Current usage metrics show cumulative count of Article Views (full-text article views including HTML views, PDF and ePub downloads, according to the available data) and Abstracts Views on Vision4Press platform.
Data correspond to usage on the plateform after 2015. The current usage metrics is available 48-96 hours after online publication and is updated daily on week days.
Initial download of the metrics may take a while.