| Issue |
A&A
Volume 683, March 2024
|
|
|---|---|---|
| Article Number | A20 | |
| Number of page(s) | 14 | |
| Section | Extragalactic astronomy | |
| DOI | https://doi.org/10.1051/0004-6361/202348386 | |
| Published online | 29 February 2024 | |
Cold molecules in H I 21 cm absorbers across redshifts ∼0.1–4⋆
1
Observatoire de Paris, LERMA, Collège de France, CNRS, PSL University, Sorbonne University, 75014 Paris, France
e-mail: This email address is being protected from spambots. You need JavaScript enabled to view it.
2
Inter-University Centre for Astronomy and Astrophysics, Post Bag 4, Ganeshkhind, Pune 411 007, India
Received:
25
October
2023
Accepted:
6
December
2023
Abstract
Absorption lines at high-redshift in front of quasars are quite rare in the millimeter (mm) domain. Only five associated and five intervening systems have been reported in the literature. Nevertheless, these discoveries provide very useful information that is complementary to emission lines, allowing, for instance, to distinguish between inflows and outflows. These lines are also good candidates for studying the variations of the fundamental constants of physics. Here we report the findings of our search for CO and other molecules in emission and absorption in front of a sample of 30 targets, comprising 16 associated and 14 intervening H I 21 cm absorbers. The observations were made with the IRAM-30 m telescope simultaneously at 3 mm and 2 mm, exploring several lines of the CO ladder and HCO+, depending on the redshift. We detected eight targets in emission, of which five are new. The derived molecular gas masses range from 109 to 7 × 10¹¹ M⊙ and the highest redshift detection (z = 3.387) corresponds to a relatively average-metallicity damped Lyman-α absorber for this redshift. We also report four new detections in absorption. Two of the associated CO absorption line detections at high-redshift (z = 1.211 and 1.275) result from high-spatial-resolution follow-up observations with NOEMA. The disparity between the mm molecular and H I 21 cm absorption lines for these and another intervening system detected in HNC at z = 1.275 is attributable to radio and mm sight lines tracing different media. We compare the atomic and molecular column densities of 14 known high-redshift (z > 0.1) molecular absorption line systems. The associated H I absorption lines are broad and exhibit multiple components, and the molecular absorption generally corresponds to the broader and weaker 21 cm absorption component. This indicates two distinct phases: one near galaxy centers with a larger CO-to-H I abundance ratio, and another with lower molecular abundance in the outer regions of the galaxy. In comparison, intervening absorption profiles correspond primarily to H I-dominated gas structure in galaxy outskirts, except for gas at low impact parameters in gravitationally lensed systems. The comparison of interferometric and single-dish observations presented here shows that the detection of absorption requires sufficient spatial resolution to overcome the dilution by emission and will be an important criterion for mm follow-up of 21 cm absorbers from ongoing large-scale surveys.
Key words: galaxies: ISM / quasars: absorption lines / quasars: individual: PKS 0201+113 / quasars: individual: PKS 1200+045 / quasars: individual: PKS 1245-19 / quasars: individual: PKS 1406-076
Based on observations carried out with the IRAM-30 m telescope and NOEMA, the NOrthern Extended Millimeter Array – IRAM (Institute of RAdioastronomy in Millimeter).
© The Authors 2024
 Open Access article, published by EDP Sciences, under the terms of the Creative Commons Attribution License (https://creativecommons.org/licenses/by/4.0), which permits unrestricted use, distribution, and reproduction in any medium, provided the original work is properly cited.
This article is published in open access under the Subscribe to Open model. This email address is being protected from spambots. You need JavaScript enabled to view it. to support open access publication.
1. Introduction
The star formation history of the Universe is characterized by a peak about 10 billion years ago. The star formation rate (SFR) density in galaxies, as reviewed by Madau & Dickinson (2014), evolves across cosmic time: it first increases with time (z > 2), peaks at z ∼ 1–2, and then decreases by an order of magnitude from z ∼ 1 to the present day. Two main factors are suspected to produce this evolution: the gas content of galaxies, and their star formation efficiency (SFE). From studies of main sequence star-forming galaxies across the Hubble time, the gas fraction in the interstellar medium (ISM) of galaxies appears to be the dominant factor in comparison to the SFE (e.g., Tacconi et al. 2018). It is therefore crucial to constrain the molecular gas content of galaxies over cosmic time, and also its precursor, that is, the atomic gas reservoir. Obreschkow & Rawlings (2009a,b) used theoretical models and the knowledge of molecular gas content of high-redshift galaxies to make very useful predictions of the cosmic evolution of H I and H2 gas components. The H I evolution was found to be relatively constant over z = 1 − 5 from damped Lyman-α absorber (DLA) studies, while the H2/H I ratio was steeply declining with time, as (1+z)1.6. Since then, many molecular line surveys have refined our knowledge, and shown that the cosmic H2 evolution might be flatter (Decarli et al. 2020; Riechers et al. 2020; Lenkić et al. 2020). In this context, it is important to pursue blind surveys, such as serendipitous discoveries of CO lines in the field of view of the Atacama Large Millimeter/submillimeter Array (ALMA) calibration sources (e.g., Hamanowicz et al. 2023), to obtain an unbiased view of the gas evolution.
Our knowledge of molecular gas in galaxies at high-redshift has received major boosts since the first discovery by Solomon et al. (1992), first by gravitational lensing, as reviewed by Solomon & Vanden Bout (2005), and then through the negative K-correction thanks to which the CO molecule can be observed over the entirety of its rotation ladder, with the flux density increasing strongly with the J-level (e.g., Combes et al. 1999). Although more difficult to detect, molecular absorption lines can bring new and complementary information. While the strength of emission lines decreases as a steep function of redshift, absorption lines can be observed as easily at high-redshift as in the local Universe provided there exists a strong background radio source (e.g., Combes 2008). Further, while emission lines are sensitive to dense and warm molecular gas, absorption lines arise in the low-excitation and diffuse gas (e.g., Wiklind & Combes 1994, 1996b, 1997; Menten et al. 2008; Henkel et al. 2009; Muller et al. 2014; Wiklind et al. 2018). In conclusion, with a 3 mm continuum source flux density of at least ∼50 mJy, absorption lines can be potentially used to obtain information about molecular gas in galaxies undetectable through emission lines.
Absorption lines also confer the advantage of the ease of follow-up observations in many molecular lines other than CO. Indeed, once a high-column-density absorber has been discovered, the detection of other lines does not suffer from low filling factor – as is the case for emission –, nor critical density for excitation. This enables characterization of the physical and chemical conditions in the absorbing gas (e.g., Henkel et al. 2005; Bottinelli et al. 2009; Muller et al. 2014, 2016, 2021). The relative strengths of species like H3CN, where the excitation is dominated by the cosmic microwave background (CMB), can be used to determine the CMB temperature (e.g., Henkel et al. 2009; Muller et al. 2013). Comparisons between the redshifts of different transitions (e.g., NH3, CH3OH, OH, etc.) can be used to test for variations in the fundamental constants (e.g., Uzan 2011; Kanekar 2011; Kanekar et al. 2012; Bagdonaite et al. 2013; Murphy et al. 2022).
Absorption-line studies broadly fall in two categories. In cases where the absorbing gas (zabs) is located in the same radio source (zem), i.e., an active galactic nucleus (AGN), the absorber is called an associated absorber (zabs ∼ zem). According to the adopted definition, the relative difference between zem and zabs may only be lower than 3000 km s−1 (e.g., Wolfe et al. 1986; Ellison et al. 2002; Gupta et al. 2021). In this category, the absorbing gas may originate from the circumnuclear disk or may represent outflowing or infalling material. In the second category, the absorbing gas is unrelated to the background AGN and arises from an “intervening” galaxy (zabs < zem). Through high-spatial-resolution observations, the number of associated molecular absorption line detections in the local Universe is steadily increasing (e.g., Tremblay et al. 2016; Rose et al. 2019a,b, 2020). These provide extremely useful information about the gas distribution and kinematics, which can be used, for example, to distinguish inflows from outflows. Two absorbers are also detected at high-redshift: Abell 2390 (z = 0.230) and RXC J0439.0+0520 (z = 0.208; Rose et al. 2019a); both are associated with the brightest galaxies of the corresponding galaxy cluster.
Molecular absorptions at higher-redshifts are extremely rare. Up to now, only ten molecular absorption systems have been discovered in the mm domain at z ≳ 0.1. Among these, five are intervening molecular absorptions: three are associated with lensing galaxies amplifying the background quasars PKS1830−211, B0218+357 (e.g., Combes 2008), and PMN0134−0931 (Wiklind et al. 2018); the fourth is PKS1413+135 and the last is our recent CO/CN absorption detection in front of the quasar Q0248+430 (zem = 1.31; Combes et al. 2019). The quasar sight line in the latter case is probing the gas associated with the tidal tail emanating from a merging galaxy pair, G0248+430 (z = 0.05194), at an impact parameter of ∼15 kpc. The H I and OH absorptions at centimeter wavelengths have already been detected, revealing the presence of cold atomic and molecular gas toward the sight line (Gupta et al. 2018a), leading to the above-mentioned CO/CN detection with the NOrthern Extended Millimeter Array (NOEMA).
The five high-z associated absorptions, in addition to the two associated with the brightest cluster galaxies (BCGs) mentioned above, are B3 1504+377 (Combes 2008), 4C+12.50 (Dasyra & Combes 2012), and PKS B1740−517 (Allison et al. 2019). This recent CO detection with the ALMA was motivated by a H I 21 cm absorption detection (Allison et al. 2015). The CO(3–2) spectrum of 4C+12.50 displays both an emission component at the galaxy redshift z = 0.1218 and an absorption feature of ∼1000 km s−1 from it. The latter was interpreted by Dasyra & Combes (2012) as representing outflowing gas. Recently, a search for associated absorption lines was also attempted with the calibrators of ALMA, but with no success (ALMACAL; Klitsch et al. 2019). We also note that it is debatable whether the absorber toward PKS1413+135 is of associated or intervening category (Readhead et al. 2021; Combes et al. 2023). Based on recent advances, here we consider it to be an intervening absorber.
Interestingly, molecular absorptions of H2 and CO are relatively easy to detect at high-redshift using ultraviolet (UV) lines (e.g., Petitjean et al. 2000; Srianand et al. 2008; Noterdaeme et al. 2023). The H2 detection rates among sight lines selected on the basis of the presence of a DLA (N(H I) > 2 × 1020 cm−2) are low (≲10%). H2 is more frequently detected in DLAs with higher metallicity. More importantly, UV lines can detect molecular column densities one or two orders of magnitude lower (N(H2)∼1014 cm−2) than what is possible with mm lines. But at higher column densities, the background source is obscured by accompanying dust (Noterdaeme et al. 2015). As UV lines are biased against high-column-density molecular gas, the mm absorption lines are a welcome complementary tool (Combes 2008).
We report here a systematic search for CO emission and absorption in a sample of 30 targets selected on the basis of the presence of cold atomic gas already confirmed through the detection of H I 21 cm absorption. This paper is structured as follows. Our sample is described in Sect. 2. Section 3 presents the details of our mm observations using the Institut de Radioastronomie Millimetrique (IRAM)-30 m telescope and NOEMA. The results in terms of optical depth and column density are quantified in Sect. 4. In Sect. 5, we discuss the constraints brought by the negative results on the various absorption components in comparison with the atomic or ionized gas absorptions. Section 6 summarizes our conclusions. Throughout the present paper, the velocity scale is defined with respect to redshifts indicated in Table 1. To compute distances, we adopt a flat ΛCDM cosmology, with Ωm = 0.29, ΩΛ = 0.71, and the Hubble constant H0 = 70 km s−1 Mpc−1.
Properties of the sample – first 16 associated systems and then 14 intervening absorbers are presented.
2. The sample
We gathered a sample of 30 candidates for molecular absorption and emission line search. In all of them, the presence of cold atomic gas has already been confirmed through detection of H I 21 cm absorption (Table 1). Overall, the sample consists of 16 associated systems at the redshift zabs ∼ zem, and 14 intervening ones where zabs is significantly lower than zem. The selected AGNs typically have high (> 100 mJy) flux densities at cm wavelengths. The exceptions are J0229+0044 (3.4 mJy) and J0229+0053 (31.1 mJy) from Chowdhury et al. (2020) in which H I 21 cm absorption is still detected due to the presence of large amounts of cold gas. At low-z (z ∼ 0.1), such high 21 cm optical depths are found to be associated with radio sources embedded in merging galaxy pairs or Ultra Luminous Infrared Galaxies (ULIRGs; Dutta et al. 2019). The basic properties of the sample are presented in Table 1. The absorption redshifts, zabs, in Table 1 are based on the peak of H I 21 cm absorption lines, except for PKS 1200+045, where it is the middle of the absorption range; this line is highly blueshifted with respect to the emission redshift. The intervening absorption lines are generally narrow with widths of ∼50 km s−1 and these are therefore observed with spectral resolution of a few km s−1 (e.g., Gupta et al. 2012). The absorption redshifts of these absorbers in Table 1 have higher accuracy compared to the associated absorbers, which are relatively broader (∼100 km s−1) and observed with coarser spectral resolution. The interpretation of gas detected in associated absorption crucially depends on the measurement of systemic redshift, zem, based on optical emission lines. These redshifts are provided in Table 1, and are mostly accurate to four decimal places. We discuss these in detail in Sect. 4.
Based on radio morphology and spectral energy distribution (SED) at cm wavelengths, the associated targets can be classified as compact radio sources (< 15 kpc) expanding through the host galaxy ISM (O’Dea & Saikia 2021). The expected values of radio continuum at 3 mm are taken from the NASA Extragalactic Database (NED). As many AGNs have variable fluxes, these are certainly only approximate. The flux densities from our mm observations, which are presented in the following tables, are also uncertain because these are obtained with a single-dish and through a varying atmosphere. The atmospheric contribution is best subtracted though rapid wobbling; however, it remains problematic in average weather conditions.
We searched for molecular absorption at the lowest possible frequency to maximize the continuum brightness level, and hence the detectability of absorption. All sources have been observed in CO lines and according to their redshift HCO+ lines when possible. Our goal is to detect CO in emission or absorption and high-density tracers simultaneously, such as HCO+ or HCN, which become diffuse gas tracers in absorption. We note that some of the associated absorbers from the sample have been followed up to search for the OH line in absorption, namely with MeerKAT through the approved large program – the MeerKAT Absorption Line Survey (MALS1; Gupta et al. 2016, 2021).
3. Observations and data analysis
All the targets were first observed with the IRAM-30 m telescope at Pico Veleta, Granada, Spain, at the epochs indicated in Table 1. The lines observed were mainly either CO(1–0) or CO(2–1) at 3 mm and CO(3–2) at 2 mm, except in some cases HCO+(2–1) or (3–2). The full width at half maximum (FWHM) of the primary beams at the frequencies of 100 GHz and 150 GHz are 25″ and 17″, respectively. The SIS receivers (EMIR) were used for observations in the wobbler switching mode, with reference positions offset by ±60 arcsec in azimuth. The efficiency of the main beam of IRAM is  and 0.78 at 100 GHz and 150 GHz, respectively. The system temperatures ranged between 120 K and 220 K at 3 mm, and between 180 K and 300 K at 2 mm. The pointing accuracy was checked every 2 h on a nearby planet or a bright continuum source, and the focus was reviewed after each sunrise, as well as at the beginning of each night. The integration time is typically 2 h per source, and is weather-dependent. Two backends were used simultaneously, the wideband autocorrelator, WILMA, and the Fourier Transform Spectrometer (FTS). Their respective spectral resolutions are 2 MHz and 0.2 MHz, which correspond to 6 and 0.6 km s−1 at 3 mm. The rms noise levels at 100 GHz and 150 GHz for a velocity resolution of 40 km s−1 were σ ∼ 1.0 mK and 1.3 mK in
  , respectively. The data were reduced using the Continuum and Line Analysis Single-dish Software (CLASS) of the Grenoble Image and Line Data Analysis Software (GILDAS).
For two sources detected in line emission, PKS 1200+045 and PKS 1245−19, further observations in the 3 mm band were carried out with NOEMA using the PolyFIX correlator in February, March, and November, 2022. The CO(2–1) line at z = 1.226 (PKS 1200+045) and 1.275 (PKS 1245−19) is redshifted to 103.566 and 101.335 GHz, respectively. The observations were carried out in dual polarisation mode in four base bands, with 3.9 GHz total bandwidth per baseband, distributed in lower and upper sidebands distant by 15.5 GHz. The CO(2–1) line was observed in the upper side band. We observed 80% of the time in A-configuration, and 20% in C-configuration, with 12 antennas. The total telescope time per source was 13 h (8 h on source), with a total of 26 h. The calibrations were performed using strong radio sources, such as 3C273, 3C84, 1222+037, and 1244−255. The absolute flux calibration is accurate at the 10% level.
The data were calibrated using the Continuum and Line Interferometer Calibration (CLIC) package and mapped using the MAPPING package of the GILDAS software. We used self-calibration, which significantly increased the signal-to-noise ratio. Using CLARK cleaning with natural weighting, we obtained images with synthesized beams of 6 9 × 1
9 × 1 3 (PKS 1200+045) and 4
 1 × 1
1 × 1 2 (PKS 1245−19) with a position angle (PA) of 10°. As no other lines were detected in the rest of the base bands (upper and lower), we used these to estimate and subtract the continuum level. The velocity resolution was initially 2 MHz (∼6 km s−1). The data were then smoothed to obtain data cubes with three resolutions: 10, 50, and 150 km s−1. These final cubes are 256 × 256 pixels with 0.13″ per pixel in the plane of the sky, and have 80 frequency channels. The continuum flux density was also computed using the images from the wider 7.7 GHz lower side band, with a beam of 7
 1 × 1
1 × 1 4 or 4
 9 × 1
9 × 1 4, with a PA of 10°. The rms noise is 230 μJy beam−1 in 50 km s−1 channels for the line and 10 μJy beam−1 for the continuum.
4. Results
In Sect. 4.1, we first discuss the emission and then absorption line detections from IRAM-30 m observations. The results from NOEMA interferometer follow-up observations of associated systems PKS 1200+045 and PKS 1245−19 are presented in Sect. 4.2.
4.1. IRAM-30 m
4.1.1. Emission
Figure 1 displays profiles of CO emission lines detected toward eight of the targets with the IRAM-30 m telescope. We note that the detection toward 1946+708 is only tentative. Of these eight, two correspond to intervening H I 21 cm absorbers and the remaining to the associated absorbers (see also Table 2). The detections toward Q0248+430 (J0251+4315; Downes et al. 1993), 4C+12.50 (J1347+1217; Dasyra & Combes 2012), and Mrk 668 (J1407+2827; Ocaña Flaquer et al. 2010) were previously known, and the remaining are reported here for the first time.
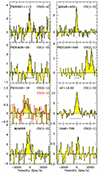 |
Fig. 1. Detection of CO emission lines toward two intervening (top panels) and six associated absorbers obtained with the IRAM-30 m. The vertical scale is Tmb in mK. The various CO transitions are indicated at the upper right of each panel. The zero of the velocity scale corresponds to zabs in Table 1. The velocity range over which H I 21 cm absorption is detected is indicated by an horizontal bar at the bottom of each panel. The detection toward 1946+708 is only tentative. |
Detection of CO emission in two intervening systems, PKS0201+113 and Q0248+430, and six associated systems.
The two intervening systems detected in CO emission are toward PKS0201+113 (J0203+1134) and Q0248+430 (J0251+4315). Although both can be classified as QSO-galaxy pairs (QGP; i.e., a foreground galaxy producing absorption in the sight line of a distant quasar as shown in Fig. 2), the absorber toward PKS0201+113 was first identified as a DLA at zabs = 3.38639 (White et al. 1993) and was then subsequently associated to a foreground concentration of galaxies, with one of them producing the absorption (Ellison et al. 2001). The absorber galaxy responsible for the DLA may be G2 in Fig. 2. It is relatively massive (0.7L*) and at an impact parameter of ∼20 kpc. The DLA with N(H I) = 1021.26 ± 0.08 cm−2 exhibits multiple components spread over ∼270 km s−1. The H I 21 cm absorption exhibits two components spread over ∼115 km s−1 at zabs = 3.387 144(17) and 3.386 141(45) (Kanekar et al. 2007). The zabs adopted in Table 1 corresponds to the peak of stronger 21 cm absorption component. The 21 cm absorption peaks do not coincide with the metal and H2 absorption lines detected in the optical/UV spectra (Ellison et al. 2001; Kanekar et al. 2007; Srianand et al. 2012). The CO emission spectrum is in good correspondence with the velocity range over which [Fe II], [C II], and H2 absorption lines are detected (Srianand et al. 2012).
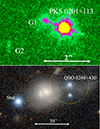 |
Fig. 2. QSO-galaxy pairs detected in CO emission and absorption. Top: HST-F606W image of PKS0201+113, with the galaxies G1 and G2; the latter is considered the most likely DLA candidate by Ellison et al. (2001). Bottom: PanSTARRS1 three-color (z − zg − g) image of Q0248+430 and associated galaxies. The dashed yellow circle indicates the region observed with the 23″ beam. |
Being closer (z ∼ 0.05), the merging galaxy pair in front of the quasar Q0248+430 (J0251+4315) at z = 1.313 has been detected in several CO emission lines (Kuehr 1977; Kollatschny et al. 1991). The CO(1–0) integrated flux density (SCOdV) using the Berkeley-Illinois-Maryland Association (BIMA) interferometer was 24 Jy km s−1 (Hwang & Chiou 2004). With the IRAM-30 m, Downes et al. (1993) reported SCOdV = 25 Jy km s−1, while from our observations we estimate SCOdV = 8.5 Jy km s−1. However, in our observations, the telescope was pointed toward the QSO, which is about 15″ from the foreground galaxy. Combes et al. (2019), using NOEMA observations, showed that the CO emission is confined to the few central arcseconds of the galaxy. Therefore, the telescope beam only partially covers the CO emission region associated with the galaxy, as shown in Fig. 2, which explains the discrepancy with earlier observations. We note that the tidal tail emanating from the foreground galaxy extends across the background QSO and is responsible for the CO absorption line detection (Combes et al. 2019). Unlike the case of PKS0201+113, the molecular absorption in this case is coincident with the narrower and stronger H I 21 cm absorption components (see also Gupta et al. 2018a).
Among six associated molecular-emission-line detections, the four lower-redshift detections are associated either with radio or Seyfert (Sy) galaxies (see Table 2). 4C+12.50 (J1347+1217) is associated with a merging galaxy pair at z = 0.12174 ± 0.00002 (Holt et al. 2003), with infrared luminosity of 3.2 × 10¹² L⊙ (Scoville et al. 2000). This has been detected in CO in emission as well as absorption (Dasyra & Combes 2012; Dasyra et al. 2014). An image of the associated galaxy pair can be seen in Fig. 5 of Dasyra et al. (2014). The host of Mrk 668 (J1407+2827; OQ208) is an actively star forming galaxy, with an interacting companion (see Fig. 3), at z = 0.07681 ± 0.00007 (Eracleous & Halpern 2004). It was detected previously by Ocaña Flaquer et al. (2010) in CO(1–0) and also shows stimulated radio-recombination lines (Bell & Seaquist 1980). Due to its far-infrared luminosity of 2 × 10¹¹ L⊙, it is classified as a LIRG. 1946+708 (J1945+7055) is a radio galaxy at z = 0.10083 ± 0.00009 (Snellen et al. 2003). PKS0428+20 (J0431+2037), also a radio galaxy, has a redshift measurement of z = 0.219 with modest accuracy (Labiano et al. 2007).
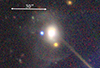 |
Fig. 3. Mrk668 (OQ208, J1407+282) legacy DR9 image, showing an interacting galaxy with stellar shells. |
The two higher-redshift associated detections are PKS1200+045 (J1203+0414) and PKS1245−19 (J1248−1959) at z = 1.22429 ± 0.00043 (Shen et al. 2011; Aditya & Kanekar 2018) and 1.275 (Labiano et al. 2007), respectively. For PKS1200+045, the double-peaked CO emission profile agrees with the optical redshift within 1σ. The H I 21 cm absorption is blueshifted with respect to this by ∼2000 km s−1 and has no overlap with the molecular gas. In contrast, for PKS1245−19, the H I 21 cm absorption and CO emission line peaks are consistent within the random and systematic errors of measurements with the systemic redshift based on optical emission lines. In general, except for PKS1200+045, for all the associated systems, the H I 21 cm absorption is detected within the same velocity range as the CO emission (see horizontal bars in Fig. 1).
We compute  , the CO luminosity in units of K km s−1 pc2, with the integrated emission in the beam. This CO luminosity is given by
 (1)
(1)
where SCOdV is the integrated flux in Jy km s−1, νrest is the rest frequency in GHz, and DL is the luminosity distance in megaparsecs. Under the assumption of a standard CO-to-H2 conversion factor (Bolatto et al. 2013), we compute the H2 mass using MH2 = α  , with α = 4.36 M⊙ (K km s−1 pc2)−1. We use a constant conversion factor for the sake of comparison, although the factor could depend on the starbursting character and on the metallicity of galaxies, but we have no information about them. The observation of the fundamental CO(1–0) line is the best measure of the total H2 mass. To convert the CO luminosities measured at a J-level of higher than one, we adopted the R1J = T1/TJ ratios from several works in the literature (e.g., Weiß et al. 2007; Dannerbauer et al. 2009; Tacconi et al. 2018), i.e., R12 = 1.16, R13 = 1.8, R15 = 2.9. The molecular gas mass estimates for eight detections are presented in Table 2.
4.1.2. Absorption
Figure 4 shows the spectra of the two molecular-absorption-line detections. They are both intervening systems. The values of continuum flux density, optical depth, and column density are provided in Table 3. PKS0201+113 exhibits a weak absorption (∼3σ) in the CO(4–3) line, and the detection is only tentative. The absorbing galaxy is also detected in emission in CO(5–4) (see Fig. 1). The continuum flux density of the quasar is a factor of two higher at the lower frequency of the CO(4–3) line with respect to the higher frequency of CO(5–4). At the latter frequency, the absorption signal is weak and does not compensate for the emission. The contrary is true at the CO(4–3) frequency: the absorption signal is stronger and cancels out the emission. The CO(4–3) absorption coincides well with the velocity range (−100, 10) km s−1 over which the H I 21 cm absorption is detected. However, we note that the peaks of 21 cm and H2 absorption lines, despite both being tracers of cold gas, are disparate by ∼25 km s−1 (Srianand et al. 2012). The differences in absorption line velocities are most likely due to the nonalignment of radio and optical sight lines. The radio core, especially at cm wavelengths, is also more extended than the astronomical unit(au)-sized optical quasar and probes a larger volume of the absorbing gas.
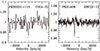 |
Fig. 4. Absorption features observed with the IRAM-30 m toward two of the intervening targets PKS0201+113 in CO(4–3) on the left, and PKS1406−076 in HNC(2–1) on the right. The detection toward PKS0201+113 is only tentative. The spectra have been normalized to their continuum flux densities of 0.22 and 1.13 Jy, respectively. The zero on the velocity scale corresponds to the peak of H I 21 cm absorption (zabs in Table 1). The velocity range over which H I absorption is detected is indicated by a horizontal bar at the bottom of each panel. For PKS0201+113, the H2 absorption peak (−25 km s−1) and the velocity range over which the 21 cm (−100, 10) km s−1 and the [CII]* (−80, 0) km s−1 are detected are reasonably consistent with the CO absorption (see text for details). |
Details of molecular-absorption-line detections in two intervening and then two associated systems with IRAM-30 m and NOEMA, respectively.
PKS1406−076 was observed in June 2010 at 101.322 GHz and 151.978 GHz corresponding to the CO(2–1) and CO(3–2) lines redshifted at z = 1.2753, respectively. The H I 21 cm absorption peak is at −87 km s−1 with respect to z = 1.2753, corresponding to the Mg II absorption. The observation led only to upper limits – with a spectral rms of 8 mJy per channel of 20 km s−1 – along with rippled baselines, which are likely due to the high continuum flux density (1.1 Jy). In March 2019, the target was observed again but only in the 3 mm band with a wide configuration, which included CO(2–1) at 101.322 GHz in the upper-outer sideband, but also HNC(2–1) and HCO+(2–1) at 79.693 GHz and 78.396 GHz in the lower-outer sideband, respectively. An absorption line was detected near the HNC(2–1) frequency but blueshifted by ∼600 km s−1 with respect to the peak of the 21 cm absorption. The HCO+(2–1) frequency was at the edge of the band and suffered from a rippled baseline.
The continuum flux densities and upper limits for nondetections are presented in Table 4. The spectral rms (σ) is estimated for 20 km s−1 channels. When the continuum is insufficiently strong, that is, regarding the CO line in particular, the emission line upper limit may be estimated using the rms derived over 80 km s−1 channels obtained by dividing σ in Table 4 by a factor 2. We do not report all the simultaneously observed lines, but only those offering the greatest constraints are considered here.
Continuum flux densities and line upper limits based on IRAM-30 m for the associated (top) and then intervening systems (bottom).
Assuming a homogeneous and optically thin gas at excitation temperature Tx and with a covering factor fc, we can derive the average column density over the beam corresponding to the mm continuum emission of the quasar through
 (2)
(2)
where gJ is the statistical weight of level J, AJ, J + 1 is the Einstein coefficient for transition J → J + 1, and the function f(Tx) is
 (3)
(3)
We adopt the partition function of local thermal equilibrium (LTE), that is, Q(Tx) = ΣgJe−EJ/kTx, where EJ is the energy of level J and Tx is the excitation temperature of the CO molecule.
Typically, with our integration time of 2 h per source, at 3 mm we get an rms of 5 mJy in 20 km s−1 channels. According to the background radio source flux, between 100 and 300 mJy of continuum, this leads to a 1σ upper limit of ∼1.7 × 10⁻² to 5 × 10⁻² in the optical depth τ, and τΔV = 0.34 to 1 km s−1 at 1σ for a line width of ΔV = 20 km s−1. When the observed line is CO(2–1) or HCO+(2–1), this corresponds to N(CO) = 1.6–5 × 1015 cm−2, and N(H2) = 1.6–5 × 1019 cm−2, or N(HCO+) = 2.6–8 × 1012 cm−2 respectively, assuming an average excitation temperature of Tx = 15 K, and a filling factor of fc = 1. We adopt a typical CO/H2 abundance ratio of 10−4 (e.g., Rachford et al. 2009).
The column-density estimates for the two intervening detections with IRAM-30 m are provided in Table 3. We note that, although the column density does not depend on redshift, the excitation temperature must nevertheless be higher than the CMB temperature, which is already 12 K for PKS0201+113. When the assumed Tx is 20K, instead of 15 K, the column density decreases only slightly (13%) for CO(4–3), and increases by 53% for HNC(2–1). For a typical CO/H2 abundance ratio of 10−4, the H2 column density is N(H2) = 6.6 × 1020 cm−2 for PKS 0201+113. This is quite comparable to the H I column density of 1.8 × 1021 cm−2 derived by Ellison et al. (2001) and Kanekar et al. (2007), from the Lyman-α and H I 21 cm, respectively. For PKS1406−076, we can estimate the abundance of HCN and HNC in the diffuse medium of the Milky Way in absorption in front of background radio sources (Liszt & Lucas 2001) as HCN/H2 = 1.4 × 10⁻⁹ and HNC/HCN = 0.2. The H2 column density is then N(H2) = 1023 cm−2.
4.2. NOEMA
The two sources PKS 1200+045 and PKS 1245−19 are clearly detected in 3 mm continuum emission (see Fig. 5). The CO emission lines are also detected, as shown in Figs. 6 and 7, but with much lower amplitude than in the IRAM-30 m spectra. Also for PKS 1200+045 the line shape is different and is blueshifted by ∼1000 km s−1; it is therefore doubtful. The difference might also be due to extended CO emission being resolved out by the limited uv-coverage of the interferometer. However, as the smallest extent of the synthesized beam is ∼1″ or ∼8 kpc, this seems unrealistic. Another possibility is that the dynamic range is limited to detect weak line emission in the presence of a strong continuum source. Indeed, the intensity of the latter was found to vary significantly within the baseband, affecting the accuracy of the subtraction of the continuum. Computed over the lower and upper sidebands (∼20 GHz), the spectral index of the source is close to −1, −0.6 for PKS 1200+045, and −1.5 for PKS 1245−19.
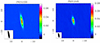 |
Fig. 5. Left: continuum image of PKS1200+045 at 3 mm obtained with NOEMA. Only a 1.5 GHz band has been used around the line frequency to better subtract the continuum. The synthesized beam is 6 |


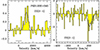 |
Fig. 6. Left: CO(2–1) emission spectrum of PKS1200+045 obtained with NOEMA and smoothed to 150km s−1. The velocity scale is centered at the average of H I absorption. Right: CO(2–1) absorption spectrum toward PKS1200+045. The spectral resolution is 10 km s−1. In both panels, vertical scales are in mJy beam−1 and the horizontal line at the bottom indicates the velocity range over which the H I 21 cm absorption is detected (Aditya & Kanekar 2018). |
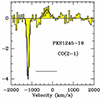 |
Fig. 7. CO(2–1) emission and absorption spectrum of PKS1245−19 obtained with NOEMA and smoothed to 150 km s−1. The vertical scale is mJy beam−1. The horizontal line at the bottom indicates the velocity range over which the H I 21 cm absorption is detected (Aditya & Kanekar 2018). |
We also detect the CO(2–1) absorption lines in both sources. At V = −1803 km s−1 with respect to the optical redshift, the molecular absorption is consistent with the velocity range over which the H I 21 cm absorption is detected by Aditya & Kanekar (2018). The absorption peaks are shifted by ∼200 km s−1 and the molecular line overlaps with the weaker, shallower H I absorption component. For PKS 1245−19, the molecular absorption line peak is at V = −1180 km s−1 with respect to the optical redshift, that is, the edge of the blueshifted wing of the H I 21 cm absorption (Aditya & Kanekar 2018). Although the CO(2–1) absorption associated with PKS 1245−19 appears very deep in the NOEMA spectrum, it is not incompatible with the nondetection in the IRAM-30 m spectrum: the peak of the absorption is −4 mJy, and the spectral rms in the IRAM-30 m spectrum is 2.5 mJy per 50 km s−1 channel.
5. Discussion
The rarity of molecular absorptions among systems with H I 21 cm absorption (5 out of 30) – even when the mm continuum is sufficiently strong and the CO emission line is detected – might appear surprising. But this is likely the consequence of the low surface filling factor (fs) of the molecular gas. There may be molecular gas along the line of sight, with a rather wide beam of 10 kpc scales, as seen in the cases with CO emission, but the surface may be filled at fs ∼ 1% or lower (Wiklind & Combes 1997). In contrast, the filling factor of the atomic gas is higher for the same column density. In addition, radio continuum emission is more extended at cm wavelengths than at mm wavelengths. Both these factors lead to more favorable conditions for the detection of cold atomic gas in absorption at longer wavelengths than molecular gas at mm wavelengths.
When the CO lines are detected in emission, higher-spatial-resolution observations are required to isolate the compact nuclear continuum emission and avoid a situation where the emission line outshines the absorption signal. NOEMA was used for two of the associated systems detected in emission. Although the continuum is strongly detected, the absorption signal is rather weak. The detection of weak absorption signals is made even more difficult by the influence of strong continuum emission on the noise level and the baseline stability.
Alternatively, it is possible to detect absorption in the high-density tracers, such as HCO+, HCN, and HNC, which are not detectable in emission. This is indeed the case for the intervening system toward PKS1406−076.
The eight CO emission line detections in our sample correspond to M(H2) = 109 − 7 × 10¹¹ M⊙. Six of these are associated systems and the majority (i.e., four) are at low redshift (z < 0.25). Among intervening systems, one detection is at z = 3.3871 and the other at 0.05151. It is interesting to stack all the nondetection spectra listed in Table 4 by aligning these to the same velocity scale centered at the peak of the H I 21 cm absorption. We stacked these spectra with no particular weight related to continuum level or redshift; simply taking into account their rms. The latter was comparable for all sources, and therefore no individual one dominates. The stacked spectrum in Fig. 8 reveals a weak emission. The FWHM of the feature is rather large (870 km s−1), and is most likely due to nonalignment of the H I absorption with the systemic velocity of the galaxies. The integrated flux is 1.75 ± 0.3 Jy km s−1. We also stacked the associated and intervening nondetections separately, but the resulting spectra do not show any detectable feature.
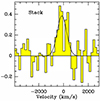 |
Fig. 8. Spectrum stacked from of all upper limits described in Table 4. The spectra were all aligned at the observed H I absorption velocity. The vertical scale is Tmb in mK. All continuum levels have been ignored. |
5.1. Comparison of H I and H2 column densities
We compared the atomic and molecular column densities of 14 known high-redshift (z > 0.1) molecular-absorption-line systems. Table 5 provides a compilation of their basic properties from the literature. Seven of these are associated targets. One of these is not detected in H I 21 cm absorption, although the upper limit is quite shallow. In order to estimate molecular column densities, the excitation temperature was adopted from the original reference when physically justified, or was taken as the default, Tx = 15 K, for CO. Estimating the spin temperature for H I is more problematic. For intervening absorbers, based on the Milky Way ISM, a value of 100 K is generally taken. The spin temperature may be at least as high as 1000 K in the associated absorbers (e.g., Maloney et al. 1996). In Table 5, we adopt Ts = 1000 and 100 K for associated and intervening absorbers, respectively. Figure 9 shows H I and H2 column densities for both types of systems. Clearly, there is no correlation when the bias of higher absorption depth at greater distances (i.e., at higher z) is taken into account; emission is more difficult to detect and only absorption may be detected. The N(H2)/N(H I) ratio is in the range of 0.03–2.7 for the associated systems; for the intervening systems, it is 0.2–1000, with the top three (22–1000) corresponding to the lensed systems.
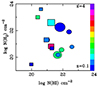 |
Fig. 9. Comparison between H2 and H I (21 cm) column densities for the known molecular-absorption-line systems at high-redshift. Ts = 1000 K (100 K) is adopted for associated (intervening) systems shown as circles (squares). The color of the symbols represents the redshift, as indicated by the color bar on the right, and the size of the symbol traces the velocity extent of the absorption averaged over the H I and H2 components. |
Comparison of 14 known H I 21 cm and molecular-absorption-line systems; the first 7 are associated and the remaining ones are intervening.
The scatter decreases if we adopt Ts = 100 K for both the associated and intervening systems. However, a uniform spin temperature for both types of systems cannot be justified simply on the basis of H2/H I ratios. The associated systems exhibit broader lines, with a median FWHM of ∼150 km s−1 in H I and – as discussed in Sect. 5.3 – comprise gas from two distinct components: the circumnuclear disk and the galaxy-wide ISM. On the other hand, for the intervening H I absorption lines are narrower (FWHM ∼ 40 km s−1) and represent multiple clouds with overlapping velocities from the quiescent galaxy disk (see Sect. 5.2).
However, several additional redshift-dependent biases ought to be considered for the detectability of absorption: first, contrary to the dust emission, which benefits from a negative K-correction, the AGN synchrotron emission intrinsically decreases with frequency, and becomes fainter at higher-redshift. Second, for a given observing frequency, the lines to be observed at higher-redshift correspond to higher J-level; these are increasingly difficult to excite in diffuse media, and may be more easily detected through absorption. Also, at higher-redshifts, higher-spatial-resolution is required to resolve the line emission and detect the underlying absorption signal.
5.2. Nature of the gas detected in intervening systems
Because of the low surface filling factor of the molecular gas and the compact size of the AGN continuum emission, the probability of detecting gas in distant galaxies through emission lines may be much higher than through line absorption. Indeed, CO and [C II] emission from strong metal absorbers or high-z DLAs at z ∼ 0.1–4 were recently detected with ALMA and NOEMA (Neeleman et al. 2016, 2019; Kaur et al. 2021, 2022). Typically, the H I column densities along the background quasar are of the order of 1021 cm−2, and the galaxies have higher far-infrared luminosities than the Milky Way. Although the projected separation between a galaxy and a quasar can be relatively high, that is, 10–45 kpc for [C II] and as much as 100 kpc for CO, the velocities of emission and absorption signals are reasonably consistent. The inferred molecular gas masses are in the range of 109–1010.5 M⊙. The intervening emission line detection in our sample have masses of M(H2) = 7 × 10¹¹ M⊙ (z = 3.38715) and 1.5 × 10¹⁰ M⊙ (z = 0.05151; see Table 2). The CO emission detection rate is 2/14, which is  %. Among 19 DLAs at z ∼ 2 with CO emission searches reported in the literature, the CO detection rate can be as high as
  % but only for high-metallicity ([M/H] > −0.3) absorbers; otherwise it is merely
  % (Kaur et al. 2022). Notably, the z = 3.38715 detection presented here has the lowest absorption metallicity [M/H] = −1.2 (Kanekar et al. 2007) and the highest molecular mass among the DLAs investigated for CO emission to date. However, in relation to other DLAs at comparable redshifts, its metallicity is close to average (e.g., Rafelski et al. 2012).
5.2.1. Individual sources
Now, we turn our attention to the molecular-absorption-line detections. Among the seven intervening systems in Table 5, three are associated with lensing galaxies. Toward PMN0134−0931, molecular absorption separated by ∼200 km s−1 is seen toward two sight lines separated by 5 kpc (Wiklind et al. 2018). The spatially unresolved 21 cm absorption spectrum shows smoother absorption coinciding with most of the molecular absorption (Kanekar & Briggs 2003). The H I and molecular absorption line column densities in Table 5 correspond to the deeper 21 cm absorption component with N(CO)/N(H I) = 2.2 × 10⁻⁴ (N(H2)/N(H I) = 2.2). The other absorption component exhibits different properties, with an abundance ratio that is lower by a factor of ∼5. As previously noted, for PKS0201+113, the 21 cm, and H2 absorption do not coincide, the peaks are separated by about ∼25 km s−1 (Srianand et al. 2012). Interestingly, the 21 cm absorption and CO absorption components coincide rather well; that is, within 5 km s−1 (Fig. 3). These may be good candidates for constraining the variation of fundamental constants of physics using CO and 21 cm absorption, albeit with better quality spectra. The total integrated H I column density in Table 5 provides N(CO)/N(H I) = 3.7 × 10⁻⁵ (N(H2)/N(H I) = 0.4). This is a factor of two higher if only the H I in the main absorption component is considered. In general, the CO absorption does not extend over all 21 cm components because of the difference in radio continuum extent. The H2 column density based on Lyman and Werner band absorption lines is N(H2) = 1014.6 − 16.0 cm−2 (Srianand et al. 2012), which is about five orders of magnitude less than the value inferred from the CO absorption. This and the disparity between the H2 and 21 cm/CO absorption-line shifts suggest parsec-scale structure in the cloud.
The H I 21 cm absorption toward another lensed system, B0218+37, is much broader than the molecular line but the absorption peaks match well within 10 km s−1 (Wiklind & Combes 1995). The N(CO)/N(H I) = 0.1 (N(H2)/N(H I) = 103). The CO and 13CO lines are optically thick, and the column density is obtained through the C18O(2−1) line (Combes & Wiklind 1995). We must caution here that, given the different continuum sizes, the H I and H2 column densities are not averaged over the same apertures. As previously noted, the atomic and molecular absorption also match well for G0248+430, with N(CO)/N(H I) = 2.9 × 10⁻⁴ (N(H2)/N(H I) = 2.9), and 90% of the 21 cm optical depth is within the extent of molecular absorption. Toward PKS1413+135, the H I absorption is broad but the molecular absorption is extremely narrow, and N(H2)/N(H I) = 0.2. PKS1830−211 is also a lensed system. In particular, it is known to be rich in gas and dust, exhibiting more than sixty molecular transitions (Muller et al. 2014). Both the H I and CO absorptions are broad (∼400 km s−1), and the overall N(H2)/N(H I) = 22, which is among the highest levels known for this kind of object.
The case of PKS1406−076 is intriguing, with no overlap between the molecular and 21 cm line absorptions. The background radio source is a blazar that exhibits proper motion (0.3 mas yr−1) and complex morphology at mas scales over 180 pc. The H I 21 cm absorption profile in the GMRT spectra shows three well-detached components and tentative variability over seven months (Gupta et al. 2012). The disparity between the 21 cm and mm molecular absorptions is attributable to the parsec-scale structure in the cloud; that is, the radio and mm sight lines trace different media. Unfortunately, the presence of H I 21 cm absorption corresponding to the HNC absorption is unknown. The GMRT observation to detect H I 21 cm absorption used a narrow (1 MHz) bandwidth to target the Mg II absorption and did not cover the 21 cm line frequency corresponding to the HNC absorption.
5.2.2. Summary
In summary, in the case of intervening absorbers, the H I absorption is broader and the narrower molecular absorption line is generally close to the H I absorption peak, albeit shifted by 10–20 km s−1. The exceptions are PKS1406−076 and the three lensed systems where the situation is complicated by multiple sightlines toward the lensed source. Nevertheless, the observed velocity structure of H I and the molecular absorption profiles imply sight lines piercing through layered molecular clouds; that is, molecular gas embedded in outer layers of predominantly H I gas.
5.3. Nature of the gas detected in associated systems
Both associated targets, PKS 1200+045 and PKS 1245−19, detected in molecular absorption are GPS sources. In general, such sources are extremely compact (< 1 kpc) and are believed to represent the early stages of evolution of powerful radio galaxies (O’Dea & Saikia 2021). They are known to exhibit the highest H I 21 cm absorption detection rates (∼45%; Gupta et al. 2006). Indeed, five out of six CO emission-line detections from our sample are also GPS sources (Table 2). In all five cases, the CO emission line peak coincides with the systemic optical redshift within ∼200 km s−1 (Fig. 1). The CO emission line widths (FWHM) are 200–800 km s−1, implying that these may have contributions from the gas clouds from (i) the host galaxy ISM through which the young radio source is expanding, and (ii) the circumnuclear disk, especially the regions close to the central AGN. The emission and absorption detected toward Abell 2390 is complex: the CO emission is extended and exhibits large-scale outflows and the H I 21 cm absorption has a narrow feature with broader components on either side or covering the entire velocity (Hernández et al. 2008; Rose et al. 2019a). Nevertheless, the H I absorption line peak in all but one source (i.e., PKS 1200+045) is also within the velocity range over which CO emission is detected. Therefore, to first-order, H I 21 cm absorption and CO mm emission lines are originating from the same regions.
In general, at cm wavelengths, the absorption is more likely to be detected in front of radio jets and lobes, whereas at mm wavelengths the gas in front of the flat spectrum “core” dominates the detected signal. In addition, molecular gas is embedded in ISM clouds with outer layers of higher atomic gas fraction. Both these factors, that is, geometrical effects – due to orientation and the frequency-dependent structure of the radio source – and varying molecular gas fraction within the cloud may lead to differences in the observed properties of the gas detected in atomic and molecular absorption lines.
In addition to the two associated CO absorbers reported here, associated molecular absorption lines have been detected in five other systems (see Table 5). In general, associated H I 21 cm absorption lines are known to exhibit a deep narrow component and a broad shallow component. The former, when coincident with the systemic redshift, is believed to originate from the circumnuclear disk or torus. The latter, depending on whether it is blueshifted or redshifted with respect to the systemic redshift, is interpreted as outflowing gas due to jet–ISM interaction or infalling gas that may eventually fuel the AGN, respectively. In Fig. 10, we present the extent of the overall H I 21 cm absorption (in blue) and the associated secondary (i.e., broader/shallower) component (in cyan) for six AGNs2. In five of the six cases, the H I absorption peak, shown as a vertical blue line, matches the systemic redshift within ±200 km s−1. Interestingly, there is a tendency among the associated systems to present CO absorption (in red) coincident with the weaker 21 cm absorption component.
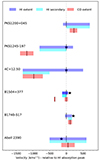 |
Fig. 10. Velocity offsets of H I 21 cm and CO absorption lines. The zero of the velocity scale corresponds to z21. For H I, both the extent of the full and secondary absorption are shown. The vertical ticks mark the location of H I and CO absorption peaks, and the systemic velocity – except for PKS 1200+045 – based on optical emission lines is shown with a star ⋆. |
5.3.1. Individual sources
For PKS 1200+045, the observed offset (∼2000 km s−1) between the H I 21 cm and CO absorption lines with respect to molecular and optical/UV emission lines is particularly intriguing. The large velocity offset with respect to the CO emission lines and systemic redshift, and the widths of H I 21 cm (∼800 km s−1) and CO (∼200 km s−1) absorption lines suggest that the absorbing gas represents a distinct and scarce population of cold gas clouds in the host galaxy. The associated radio emission at 1.4 GHz with a projected linear size of 60 mas (500 pc at zabs) exhibits three components, one of which lies at one end and contains more than 90% of the total flux density (Liu et al. 2007). The nature of this one-sided morphology as a core–jet structure is confirmed by the higher-frequency milliarcsecond-scale images at 2.3, 4.3, and 8.7 GHz available from the Very Long Baseline Array (VLBA) calibrator catalog3. The one-sided core–jet morphology and orientation of the jet axis likely ensures that the sight lines to the radio source do not pass through the circumnuclear disk detected in CO emission. The absorbing gas may then correspond to quiescent clouds in the host galaxy ISM or gas interacting with the jet. The large velocity widths of H I 21 cm (∼800 km s−1) and CO (∼200 km s−1) absorption lines suggest that the latter is true, with the gas being detectable in absorption primarily due to the orientation of the radio source.
For PKS 1200+045 one possibility is that only the radio “core” is responsible for the absorption detected at cm and mm wavelengths. The H I absorption consists of two components separated by ∼200 km s−1 and CO absorption is coincident only with the secondary weaker component (Fig. 10). Assuming complete coverage of the radio core for the total integrated columns of the atomic and molecular gas, and Ts = 1000 K, we estimate the CO-to-H I column-density ratio, N(CO)/N(H I) = 3 × 10⁻⁶, which means N(H2)/N(H I) = 3 × 10⁻². Alternatively, it is also possible that only the CO and secondary H I absorption components are originating from the gas in front of the radio core. The molecular to H I column density ratio would then be a factor of two higher. The deeper H I absorption component would then correspond to the gas in front of the weaker radio components associated with the jet and the lobe. The projected distance of this gas component would be at least a few hundred parsecs from the core, which would explain the absence of CO absorption at the corresponding velocities.
The second possibility for PKS 1200+045 is similar to the scenario observed for 4C+12.50: a CSS source hosted in a gas-rich Seyfert galaxy. At 1.4 GHz, 4C+12.50 exhibits a distorted radio morphology with an overall extent of 150 mas (∼325 pc). The mas-scale spectroscopy reveals the deep, narrow H I 21 cm absorption component that is detected toward the fainter northern lobe rather than the core or the brighter southern hotspot (Morganti et al. 2004). The weaker H I absorption component coincides with the CO absorption. The CO-to-H I column density ratio is 6 × 10⁻⁴ (N(H2)/N(H I) = 6) for N(H I) = 3 × 1021 cm−2 based on the Na I or H I 21 cm absorption (Ts = 1000 K) associated with the absorption component coincident with the molecular absorption. This is about 200 times higher than the ratio observed for PKS 1200+045 and is likely due to the fact that 4C+12.50 (i) is hosted in a gas-rich Seyfert galaxy, and (ii), being a radio galaxy, PKS 1200+045 is oriented such that the sight line to the radio core passes through the circumnuclear disk.
In contrast to PKS 1200+045, the CO absorption associated with PKS 1245−19 is offset with respect to the 21 cm absorption by −1180 km s−1 but is within the range over which CO emission is detected (Fig. 7). The 21 cm absorption coincides well with the CO emission (Fig. 7). At 2.3 and 8.6 GHz, the radio source exhibits two prominent, steep spectrum (α < −0.5) components of similar strength, separated by ∼25 mas (Sokolovsky et al. 2011). The radio core is not detected in these low-frequency images but may be responsible for the CO absorption. The sight lines at cm wavelengths, especially those toward the counter jet and lobe, pass through the circumnuclear disk as well as the host galaxy ISM. The nondetection of H I 21 cm absorption – adopting Ts = 1000 K and a line FWHM = 200 km s−1 based on the detected CO absorption – corresponds to a CO-to-H I column density ratio of > 7 × 10⁻⁵ (N(H2)/N(H I) > 0.7). This is significantly higher and lower than the ratios observed for PKS 1200+045 and 4C+12.50, respectively. Overall, both the 21 cm and CO absorption lines seem to be tracing the galaxy-wide cold gas from the ISM and the circumnuclear disk detected in CO emission. The disparity between H I and CO absorption lines is most likely due to the differences in the sight lines at cm and mm wavelengths.
Molecular absorption lines have also been detected toward B1504+377, which is hosted by a disk galaxy. The associated radio emission at cm wavelengths consists of a dominant ‘core’ component, with some diffuse emission at a distance of 55 mas (390 pc at z = 0.674). There is coincidence between the broader H I and CO absorption (FWHM ∼ 75 km s−1) components at z = 0.67343, both of which are coincident with the systemic velocity (Wiklind & Combes 1996a; Carilli et al. 1997). However, no H I absorption is detected in the narrow (FWHM ∼ 15 km s−1) molecular absorption component at z = 0.67150 (see Fig. 10). For the broader component, the CO-to-H I column-density ratio is 2 × 10⁻⁶ (N(H2)/N(H I) > 0.02). The orientation and the morphology of the radio source suggest that it is tracing the gas through the circumnuclear disk as intercepted by the core. The nondetection of H I 21 cm absorption in the narrow CO absorption component corresponds to a column density ratio of > 3 × 10⁻⁵ (N(H2)/N(H I) > 0.3), which is comparable to other similar systems discussed here but is at least a factor of ten higher than the broader component. Based on the large shift (−450 km s−1) but narrow width (15 km s−1), it likely represents a cloud in the inner circumnuclear disk. The H I 21 cm absorption nondetection is due to the relatively high CO-to-H I abundance ratio.
Another molecular absorber is B1740−517, which is a GPS source associated with a radio galaxy (Sy). At 2.3 GHz, radio emission is resolved into two components separated by ∼50 mas (∼300 pc at z = 0.442) and the CO(2–1) absorption coincides with a weaker H I absorption component (Allison et al. 2019). No CO absorption is detected at the narrow, deep 21 cm absorption peak, which is blueshifted with respect to the CO absorption and the systemic redshift by ∼130 km s−1. It is unclear whether the two radio components are core–jet or two lobes. The CO-to-H I column density ratio for the absorption component with H I and CO absorption, 2 × 10⁻⁵ (N(H2)/N(H I) = 0.2), is comparable to those of other associated systems. It may represent gas closer to the central AGN, whereas the narrow component represents distant gas toward the jet and the lobe.
5.3.2. Summary
Overall, CO absorption is generally detected in broader and weaker 21 cm absorption components with typical CO-to-H I abundance ratios of 10−6–10−5 (N(H2)/N(H I) = 0.01–0.1). Except for B1504+377, the CO absorption never coincides with the deep, strong 21 cm absorption component. This suggests that absorbing gas has two different phases: one phase near galaxy centers with a larger CO-to-H I abundance ratio, and another with lower CO abundance that shows only H I and might correspond to the gas in outer regions of galaxies. These two phases are well known through emission-line observations of nearby galaxies (e.g., Bigiel & Blitz 2012). The detection rate of molecular absorption from our survey is 2/16, which equates to  %. As mentioned above, the detection of molecular absorption is not expected in all associated systems with 21 cm absorption because of the smaller filling factor of the molecular component, and the much smaller continuum sizes at mm frequency.
6. Conclusions
We searched for molecular emission and absorption in 30 H I 21 cm absorbers at 0.1 < z < 4. Of these, 16 are associated with the AGN and the remaining 14 are from intervening galaxies. We report the detection of CO emission in 8 systems, of which 5 are new. The derived molecular masses, assuming standard conversion ratios, range from 109 to 7 × 10¹¹ M⊙. The majority of these correspond to associated systems belonging to young radio AGN, that is, intrinsically compact radio sources with a peaked radio spectrum. Four of them are at low redshift (z < 0.25). Intervening galaxies that show CO emission are rarer ( %). The two detections reported here from our sample have masses of M(H2) = 7 × 10¹¹ M⊙ (PKS 0201+113; z = 3.38715) and 1.5 × 10¹⁰ M⊙ (Q0248+430; z = 0.05151). Notably, the z = 3.38715 detection presented here has the lowest absorption metallicity ([M/H] = −1.2) and the highest molecular mass among the DLAs investigated for CO emission to date (Kaur et al. 2022). We note that the average metallicity of DLAs at such high-redshifts is [M/H] ∼ −1.5 (Rafelski et al. 2012). We also stacked together the spectra from 21 undetected sources (10 associated and 11 intervening) and find a hint of emission, that is, at a flux level of about an order of magnitude lower than the individual detections. It is not possible to draw conclusions on the corresponding masses because of the varied distances.
Millimeter molecular absorptions are still very rare at moderate and high-redshift: only ten systems have been found (Combes 2008; Dasyra & Combes 2012; Wiklind et al. 2018; Allison et al. 2019; Combes et al. 2019; Rose et al. 2019a): five are associated absorbing systems, and the remaining five are intervening systems, of which three are gravitational lenses. Here, we report four systems showing absorption line detections, two associated and two intervening. The two associated systems, PKS 1200+045 (z = 1.2111) and PKS 1245−19 (z = 1.2750), were detected in high-spatial-resolution NOEMA follow-up observations of our IRAM 30 m detection of CO emission, and demonstrate the complexity faced in detecting absorption in the presence of emission. Alternatively, it is possible to detect absorption in the high-density tracers, such as HCO+, HCN, or HNC, which are not detectable in emission. This is indeed the case for the intervening system toward PKS1406−076 (z = 1.27464) reported here.
The other two intervening detections are toward PKS0201+113 (z = 3.38714) and Q0248+430 (0.05151) (Combes et al. 2019). For PKS0201+113, the 21 cm, and H2 (ultraviolet) absorption components do not coincide; the peaks are separated by about ∼25 km s−1 (Srianand et al. 2012). Interestingly, the 21 cm absorption and CO absorption components coincide rather well (i.e., within 5 km s−1; Fig. 3), and the latter could be good candidates with which to constrain the variations of fundamental constants of physics. The disparity between H2 and 21 cm/CO absorption line shifts suggests parsec-scale structure in the cloud. The case of PKS1406−076 is even more intriguing, with no overlap between the molecular and 21 cm line absorptions. The disparity between the 21 cm and mm molecular absorptions is attributable to complex radio morphology; that is, radio and mm sight lines tracing different media.
We compare the atomic and molecular column densities of 14 known high-redshift (z > 0.1) molecular absorption line systems. Among associated systems, CO absorption is generally detected in the broader and weaker 21 cm absorption component, with a typical CO-to-H I abundance ratio of 10−6–10−5 (N(H2)/N(H I) = 0.01–0.1). The CO absorption very rarely coincides with the deep and narrow 21 cm absorption component. This suggests that absorbing gas has two different phases: one phase near to galaxy centers with a larger CO-to-H I abundance ratio, and another with lower CO abundance that shows only H I and might correspond to the gas in outer regions of galaxies. These two phases are well known through emission line observations of nearby galaxies (e.g., Bigiel & Blitz 2012).
In the case of intervening absorbers, the H I absorption is broader and the narrower molecular absorption line is generally close to the H I absorption peak, although shifted by 10–20 km s−1. The exceptions are PKS1406−076 and the three lensed systems where the situation is complicated by multiple sightlines toward the lensed source. Nevertheless, the observed velocity structure of H I and molecular absorption profiles imply sight lines piercing through layered molecular clouds; that is, molecular gas embedded in outer layers of predominantly H I gas.
With the advent of large surveys at cm wavelengths, the number of H I 21 cm absorbers is expected to steeply increase. However, currently, H I 21 cm line spectroscopy at z > 0.5 can be performed only at spatial resolutions of > 5″, which may be insufficient to reveal the origin of the absorbing gas. The work presented here demonstrates that this limitation can be overcome through the combination of mm emission and absorption spectroscopy, and helps to elucidate the role played by cold gas in the evolution of normal and active galaxies.
BCG J0439+0520 with no H I 21 cm absorption is excluded.
Acknowledgments
We sincerely thank the referee for very useful and constructive comments, and a thorough reading of the manuscript. This work is based on observations carried out with the IRAM-30 m telescope, and the NOEMA Interferometer. IRAM is supported by INSU/CNRS (France), MPG (Germany), and IGN (Spain). We acknowledge the help of the IRAM teams for the observations and thank Vinodiran Arumugam for his support with the data reduction. The data were processed using the Gildas package. This project has benefited from support from the Programme National Cosmologie et Galaxies. We made use of the NASA/IPAC Extragalactic Database (NED), and of the HyperLeda database (http://leda.univ-lyon1.fr).
References
- Aditya, J. N. H. S. 2019, MNRAS, 482, 5597 [Google Scholar]
- Aditya, J. N. H. S., & Kanekar, N. 2018, MNRAS, 473, 59 [NASA ADS] [CrossRef] [Google Scholar]
- Allison, J. R., Sadler, E. M., Moss, V. A., et al. 2015, MNRAS, 453, 1249 [NASA ADS] [CrossRef] [Google Scholar]
- Allison, J. R., Mahony, E. K., Moss, V. A., et al. 2019, MNRAS, 482, 2934 [NASA ADS] [Google Scholar]
- Audibert, A., Dasyra, K. M., Papachristou, M., et al. 2022, A&A, 668, A67 [NASA ADS] [CrossRef] [EDP Sciences] [Google Scholar]
- Bagdonaite, J., Jansen, P., Henkel, C., et al. 2013, Science, 339, 46 [NASA ADS] [CrossRef] [Google Scholar]
- Bell, M. B., & Seaquist, E. R. 1980, ApJ, 238, 818 [NASA ADS] [CrossRef] [Google Scholar]
- Berg, T. A. M., Ellison, S. L., Prochaska, J. X., Venn, K. A., & Dessauges-Zavadsky, M. 2015, MNRAS, 452, 4326 [NASA ADS] [CrossRef] [Google Scholar]
- Bigiel, F., & Blitz, L. 2012, ApJ, 756, 183 [Google Scholar]
- Bolatto, A. D., Wolfire, M., & Leroy, A. K. 2013, ARA&A, 51, 207 [CrossRef] [Google Scholar]
- Bottinelli, S., Hughes, A. M., van Dishoeck, E. F., et al. 2009, ApJ, 690, L130 [CrossRef] [Google Scholar]
- Carilli, C. L., Rupen, M. P., & Yanny, B. 1993, ApJ, 412, L59 [NASA ADS] [CrossRef] [Google Scholar]
- Carilli, C. L., Menten, K. M., Reid, M. J., & Rupen, M. P. 1997, ApJ, 474, L89 [NASA ADS] [CrossRef] [Google Scholar]
- Carswell, R. F., Jorgenson, R. A., Wolfe, A. M., & Murphy, M. T. 2011, MNRAS, 411, 2319 [NASA ADS] [CrossRef] [Google Scholar]
- Chowdhury, A., Kanekar, N., & Chengalur, J. N. 2020, ApJ, 900, L30 [NASA ADS] [CrossRef] [Google Scholar]
- Combes, F. 2008, Ap&SS, 313, 321 [NASA ADS] [CrossRef] [Google Scholar]
- Combes, F., & Wiklind, T. 1995, A&A, 303, L61 [NASA ADS] [Google Scholar]
- Combes, F., Maoli, R., & Omont, A. 1999, A&A, 345, 369 [NASA ADS] [Google Scholar]
- Combes, F., Gupta, N., Jozsa, G. I. G., & Momjian, E. 2019, A&A, 623, A133 [NASA ADS] [CrossRef] [EDP Sciences] [Google Scholar]
- Combes, F., Gupta, N., Muller, S., et al. 2023, A&A, 671, A43 [NASA ADS] [CrossRef] [EDP Sciences] [Google Scholar]
- Curran, S. J., Tzanavaris, P., Murphy, M. T., Webb, J. K., & Pihlström, Y. M. 2007, MNRAS, 381, L6 [NASA ADS] [Google Scholar]
- Dannerbauer, H., Daddi, E., Riechers, D. A., et al. 2009, ApJ, 698, L178 [NASA ADS] [CrossRef] [Google Scholar]
- Dasyra, K. M., & Combes, F. 2012, A&A, 541, L7 [NASA ADS] [CrossRef] [EDP Sciences] [Google Scholar]
- Dasyra, K. M., Combes, F., Novak, G. S., et al. 2014, A&A, 565, A46 [NASA ADS] [CrossRef] [EDP Sciences] [Google Scholar]
- Decarli, R., Aravena, M., Boogaard, L., et al. 2020, ApJ, 902, 110 [Google Scholar]
- Downes, D., Solomon, P. M., & Radford, S. J. E. 1993, ApJ, 414, L13 [NASA ADS] [CrossRef] [Google Scholar]
- Dutta, R., Srianand, R., Gupta, N., et al. 2017, MNRAS, 465, 4249 [NASA ADS] [CrossRef] [Google Scholar]
- Dutta, R., Srianand, R., & Gupta, N. 2019, MNRAS, 489, 1099 [NASA ADS] [CrossRef] [Google Scholar]
- Ellison, S. L., Pettini, M., Steidel, C. C., & Shapley, A. E. 2001, ApJ, 549, 770 [NASA ADS] [CrossRef] [Google Scholar]
- Ellison, S. L., Yan, L., Hook, I. M., et al. 2002, A&A, 383, 91 [NASA ADS] [CrossRef] [EDP Sciences] [Google Scholar]
- Eracleous, M., & Halpern, J. P. 2004, ApJS, 150, 181 [NASA ADS] [CrossRef] [Google Scholar]
- Gupta, N., Salter, C. J., Saikia, D. J., Ghosh, T., & Jeyakumar, S. 2006, MNRAS, 373, 972 [NASA ADS] [CrossRef] [Google Scholar]
- Gupta, N., Srianand, R., Petitjean, P., et al. 2007, ApJ, 654, L111 [NASA ADS] [CrossRef] [Google Scholar]
- Gupta, N., Srianand, R., Baan, W., et al. 2016, MeerKAT Science: On the Pathway to the SKA, 14 [Google Scholar]
- Gupta, N., Momjian, E., Srianand, R., et al. 2018a, ApJ, 860, L22 [Google Scholar]
- Gupta, N., Srianand, R., Farnes, J. S., et al. 2018b, MNRAS, 476, 2432 [Google Scholar]
- Gupta, N., Srianand, R., Petitjean, P., Noterdaeme, P., & Saikia, D. J. 2009, MNRAS, 398, 201 [NASA ADS] [CrossRef] [Google Scholar]
- Gupta, N., Srianand, R., Petitjean, P., et al. 2012, A&A, 544, A21 [NASA ADS] [CrossRef] [EDP Sciences] [Google Scholar]
- Gupta, N., Srianand, R., Shukla, G., et al. 2021, ApJS, 255, 28 [NASA ADS] [CrossRef] [Google Scholar]
- Hamanowicz, A., Zwaan, M. A., Péroux, C., et al. 2023, MNRAS, 519, 34 [Google Scholar]
- Henkel, C., Jethava, N., Kraus, A., et al. 2005, A&A, 440, 893 [NASA ADS] [CrossRef] [EDP Sciences] [Google Scholar]
- Henkel, C., Menten, K. M., Murphy, M. T., et al. 2009, A&A, 500, 725 [NASA ADS] [CrossRef] [EDP Sciences] [Google Scholar]
- Hernández, H., Ghosh, T., Salter, C. J., & Momjian, E. 2008, in The evolution of galaxies through the neutral hydrogen window, eds. R. Minchin, & E. Momjian, AIP Conf. Ser., 1035, 214 [CrossRef] [Google Scholar]
- Hogan, M. T. 2014, PhD Thesis, Durham University, UK [Google Scholar]
- Holt, J., Tadhunter, C. N., & Morganti, R. 2003, MNRAS, 342, 227 [CrossRef] [Google Scholar]
- Hwang, C.-Y., & Chiou, S.-H. 2004, ApJ, 600, 52 [NASA ADS] [CrossRef] [Google Scholar]
- Kanekar, N. 2011, ApJ, 728, L12 [Google Scholar]
- Kanekar, N., & Briggs, F. H. 2003, A&A, 412, L29 [NASA ADS] [CrossRef] [EDP Sciences] [Google Scholar]
- Kanekar, N., & Chengalur, J. N. 2001, A&A, 369, 42 [NASA ADS] [CrossRef] [EDP Sciences] [Google Scholar]
- Kanekar, N., Ghosh, T., & Chengalur, J. N. 2001, A&A, 373, 394 [NASA ADS] [CrossRef] [EDP Sciences] [Google Scholar]
- Kanekar, N., Chengalur, J. N., & Lane, W. M. 2007, MNRAS, 375, 1528 [NASA ADS] [CrossRef] [Google Scholar]
- Kanekar, N., Langston, G. I., Stocke, J. T., Carilli, C. L., & Menten, K. M. 2012, ApJ, 746, L16 [Google Scholar]
- Kaur, B., Kanekar, N., Rafelski, M., et al. 2021, ApJ, 921, 68 [NASA ADS] [CrossRef] [Google Scholar]
- Kaur, B., Kanekar, N., Rafelski, M., et al. 2022, ApJ, 933, L42 [NASA ADS] [CrossRef] [Google Scholar]
- Klitsch, A., Péroux, C., Zwaan, M. A., et al. 2019, MNRAS, 490, 1220 [NASA ADS] [CrossRef] [Google Scholar]
- Kollatschny, W., Dietrich, M., Borgeest, U., & Schramm, K. J. 1991, A&A, 249, 57 [NASA ADS] [Google Scholar]
- Koopmans, L. V. E., & de Bruyn, A. G. 2005, MNRAS, 360, L6 [Google Scholar]
- Kuehr, H. 1977, A&AS, 29, 139 [NASA ADS] [Google Scholar]
- Labiano, A., Barthel, P. D., O’Dea, C. P., et al. 2007, A&A, 463, 97 [NASA ADS] [CrossRef] [EDP Sciences] [Google Scholar]
- Lenkić, L., Bolatto, A. D., Förster Schreiber, N. M., et al. 2020, AJ, 159, 190 [CrossRef] [Google Scholar]
- Liszt, H., & Lucas, R. 2001, A&A, 370, 576 [NASA ADS] [CrossRef] [EDP Sciences] [Google Scholar]
- Liu, X., Cui, L., Luo, W. F., Shi, W. Z., & Song, H. G. 2007, A&A, 470, 97 [NASA ADS] [CrossRef] [EDP Sciences] [Google Scholar]
- Madau, P., & Dickinson, M. 2014, ARA&A, 52, 415 [Google Scholar]
- Maloney, P. R., Hollenbach, D. J., & Tielens, A. G. G. M. 1996, ApJ, 466, 561 [Google Scholar]
- Menten, K. M., Güsten, R., Leurini, S., et al. 2008, A&A, 492, 725 [NASA ADS] [CrossRef] [EDP Sciences] [Google Scholar]
- Morganti, R., Oosterloo, T. A., Tadhunter, C. N., et al. 2004, A&A, 424, 119 [NASA ADS] [CrossRef] [EDP Sciences] [Google Scholar]
- Muller, S., Beelen, A., Black, J. H., et al. 2013, A&A, 551, A109 [NASA ADS] [CrossRef] [EDP Sciences] [Google Scholar]
- Muller, S., Combes, F., Guélin, M., et al. 2014, A&A, 566, A112 [NASA ADS] [CrossRef] [EDP Sciences] [Google Scholar]
- Muller, S., Müller, H. S. P., Black, J. H., et al. 2016, A&A, 595, A128 [NASA ADS] [CrossRef] [EDP Sciences] [Google Scholar]
- Muller, S., Ubachs, W., Menten, K. M., Henkel, C., & Kanekar, N. 2021, A&A, 652, A5 [NASA ADS] [CrossRef] [EDP Sciences] [Google Scholar]
- Murphy, M. T., Molaro, P., Leite, A. C. O., et al. 2022, A&A, 658, A123 [NASA ADS] [CrossRef] [EDP Sciences] [Google Scholar]
- Neeleman, M., Prochaska, J. X., Zwaan, M. A., et al. 2016, ApJ, 820, L39 [NASA ADS] [CrossRef] [Google Scholar]
- Neeleman, M., Kanekar, N., Prochaska, J. X., Rafelski, M. A., & Carilli, C. L. 2019, ApJ, 870, L19 [NASA ADS] [CrossRef] [Google Scholar]
- Noterdaeme, P., Petitjean, P., & Srianand, R. 2015, A&A, 578, L5 [NASA ADS] [CrossRef] [EDP Sciences] [Google Scholar]
- Noterdaeme, P., Balashev, S., Cuellar, R., et al. 2023, A&A, 673, A89 [NASA ADS] [CrossRef] [EDP Sciences] [Google Scholar]
- Obreschkow, D., & Rawlings, S. 2009a, ApJ, 696, L129 [NASA ADS] [CrossRef] [Google Scholar]
- Obreschkow, D., & Rawlings, S. 2009b, MNRAS, 394, 1857 [NASA ADS] [CrossRef] [Google Scholar]
- Ocaña Flaquer, B., Leon, S., Combes, F., & Lim, J. 2010, A&A, 518, A9 [Google Scholar]
- O’Dea, C. P., & Saikia, D. J. 2021, A&ARv, 29, 3 [Google Scholar]
- Peck, A. B., Taylor, G. B., & Conway, J. E. 1999, ApJ, 521, 103 [Google Scholar]
- Petitjean, P., Srianand, R., & Ledoux, C. 2000, A&A, 364, L26 [NASA ADS] [Google Scholar]
- Quider, A. M., Nestor, D. B., Turnshek, D. A., et al. 2011, AJ, 141, 137 [NASA ADS] [CrossRef] [Google Scholar]
- Rachford, B. L., Snow, T. P., Destree, J. D., et al. 2009, ApJS, 180, 125 [NASA ADS] [CrossRef] [Google Scholar]
- Rafelski, M., Wolfe, A. M., Prochaska, J. X., Neeleman, M., & Mendez, A. J. 2012, ApJ, 755, 89 [NASA ADS] [CrossRef] [Google Scholar]
- Readhead, A. C. S., Ravi, V., Liodakis, I., et al. 2021, ApJ, 907, 61 [NASA ADS] [CrossRef] [Google Scholar]
- Riechers, D. A., Boogaard, L. A., Decarli, R., et al. 2020, ApJ, 896, L21 [NASA ADS] [CrossRef] [Google Scholar]
- Rose, T., Edge, A. C., Combes, F., et al. 2019a, MNRAS, 489, 349 [NASA ADS] [CrossRef] [Google Scholar]
- Rose, T., Edge, A. C., Combes, F., et al. 2019b, MNRAS, 485, 229 [Google Scholar]
- Rose, T., Edge, A. C., Combes, F., et al. 2020, MNRAS, 496, 364 [Google Scholar]
- Scoville, N. Z., Evans, A. S., Thompson, R., et al. 2000, AJ, 119, 991 [NASA ADS] [CrossRef] [Google Scholar]
- Shen, Y., Richards, G. T., Strauss, M. A., et al. 2011, ApJS, 194, 45 [Google Scholar]
- Snellen, I. A. G., Lehnert, M. D., Bremer, M. N., & Schilizzi, R. T. 2003, MNRAS, 342, 889 [NASA ADS] [CrossRef] [Google Scholar]
- Sokolovsky, K. V., Kovalev, Y. Y., Pushkarev, A. B., Mimica, P., & Perucho, M. 2011, A&A, 535, A24 [NASA ADS] [CrossRef] [EDP Sciences] [Google Scholar]
- Solomon, P. M., & Vanden Bout, P. A. 2005, ARA&A, 43, 677 [NASA ADS] [CrossRef] [Google Scholar]
- Solomon, P. M., Radford, S. J. E., & Downes, D. 1992, Nature, 356, 318 [NASA ADS] [CrossRef] [Google Scholar]
- Srianand, R., Noterdaeme, P., Ledoux, C., & Petitjean, P. 2008, A&A, 482, L39 [NASA ADS] [CrossRef] [EDP Sciences] [Google Scholar]
- Srianand, R., Gupta, N., Petitjean, P., et al. 2012, MNRAS, 421, 651 [NASA ADS] [Google Scholar]
- Srianand, R., Gupta, N., Rahmani, H., et al. 2013, MNRAS, 428, 2198 [Google Scholar]
- Stickel, M., & Kuhr, H. 1993, A&AS, 101, 521 [NASA ADS] [Google Scholar]
- Tacconi, L. J., Genzel, R., Saintonge, A., et al. 2018, ApJ, 853, 179 [Google Scholar]
- Tremblay, G. R., Oonk, J. B. R., Combes, F., et al. 2016, Nature, 534, 218 [NASA ADS] [CrossRef] [Google Scholar]
- Uzan, J.-P. 2011, Liv. Rev. Relat., 14, 2 [Google Scholar]
- Vermeulen, R. C., Pihlström, Y. M., Tschager, W., et al. 2003, A&A, 404, 861 [NASA ADS] [CrossRef] [EDP Sciences] [Google Scholar]
- Weiß, A., Downes, D., Neri, R., et al. 2007, A&A, 467, 955 [NASA ADS] [CrossRef] [EDP Sciences] [Google Scholar]
- White, R. L., Kinney, A. L., & Becker, R. H. 1993, ApJ, 407, 456 [NASA ADS] [CrossRef] [Google Scholar]
- Wiklind, T., & Combes, F. 1994, A&A, 286, L9 [NASA ADS] [Google Scholar]
- Wiklind, T., & Combes, F. 1995, A&A, 299, 382 [NASA ADS] [Google Scholar]
- Wiklind, T., & Combes, F. 1996a, A&A, 315, 86 [NASA ADS] [Google Scholar]
- Wiklind, T., & Combes, F. 1996b, Nature, 379, 139 [Google Scholar]
- Wiklind, T., & Combes, F. 1997, A&A, 328, 48 [NASA ADS] [Google Scholar]
- Wiklind, T., & Combes, F. 1998, ApJ, 500, 129 [Google Scholar]
- Wiklind, T., Combes, F., & Kanekar, N. 2018, ApJ, 864, 73 [NASA ADS] [CrossRef] [Google Scholar]
- Wolfe, A. M., Turnshek, D. A., Smith, H. E., & Cohen, R. D. 1986, ApJS, 61, 249 [NASA ADS] [CrossRef] [Google Scholar]
All Tables
Properties of the sample – first 16 associated systems and then 14 intervening absorbers are presented.
Detection of CO emission in two intervening systems, PKS0201+113 and Q0248+430, and six associated systems.
Details of molecular-absorption-line detections in two intervening and then two associated systems with IRAM-30 m and NOEMA, respectively.
Continuum flux densities and line upper limits based on IRAM-30 m for the associated (top) and then intervening systems (bottom).
Comparison of 14 known H I 21 cm and molecular-absorption-line systems; the first 7 are associated and the remaining ones are intervening.
All Figures
|
Fig. 1. Detection of CO emission lines toward two intervening (top panels) and six associated absorbers obtained with the IRAM-30 m. The vertical scale is Tmb in mK. The various CO transitions are indicated at the upper right of each panel. The zero of the velocity scale corresponds to zabs in Table 1. The velocity range over which H I 21 cm absorption is detected is indicated by an horizontal bar at the bottom of each panel. The detection toward 1946+708 is only tentative. |
| In the text | |
|
Fig. 2. QSO-galaxy pairs detected in CO emission and absorption. Top: HST-F606W image of PKS0201+113, with the galaxies G1 and G2; the latter is considered the most likely DLA candidate by Ellison et al. (2001). Bottom: PanSTARRS1 three-color (z − zg − g) image of Q0248+430 and associated galaxies. The dashed yellow circle indicates the region observed with the 23″ beam. |
| In the text | |
|
Fig. 3. Mrk668 (OQ208, J1407+282) legacy DR9 image, showing an interacting galaxy with stellar shells. |
| In the text | |
|
Fig. 4. Absorption features observed with the IRAM-30 m toward two of the intervening targets PKS0201+113 in CO(4–3) on the left, and PKS1406−076 in HNC(2–1) on the right. The detection toward PKS0201+113 is only tentative. The spectra have been normalized to their continuum flux densities of 0.22 and 1.13 Jy, respectively. The zero on the velocity scale corresponds to the peak of H I 21 cm absorption (zabs in Table 1). The velocity range over which H I absorption is detected is indicated by a horizontal bar at the bottom of each panel. For PKS0201+113, the H2 absorption peak (−25 km s−1) and the velocity range over which the 21 cm (−100, 10) km s−1 and the [CII]* (−80, 0) km s−1 are detected are reasonably consistent with the CO absorption (see text for details). |
| In the text | |
|
Fig. 5. Left: continuum image of PKS1200+045 at 3 mm obtained with NOEMA. Only a 1.5 GHz band has been used around the line frequency to better subtract the continuum. The synthesized beam is 6 |
| In the text | |
|
Fig. 6. Left: CO(2–1) emission spectrum of PKS1200+045 obtained with NOEMA and smoothed to 150km s−1. The velocity scale is centered at the average of H I absorption. Right: CO(2–1) absorption spectrum toward PKS1200+045. The spectral resolution is 10 km s−1. In both panels, vertical scales are in mJy beam−1 and the horizontal line at the bottom indicates the velocity range over which the H I 21 cm absorption is detected (Aditya & Kanekar 2018). |
| In the text | |
|
Fig. 7. CO(2–1) emission and absorption spectrum of PKS1245−19 obtained with NOEMA and smoothed to 150 km s−1. The vertical scale is mJy beam−1. The horizontal line at the bottom indicates the velocity range over which the H I 21 cm absorption is detected (Aditya & Kanekar 2018). |
| In the text | |
|
Fig. 8. Spectrum stacked from of all upper limits described in Table 4. The spectra were all aligned at the observed H I absorption velocity. The vertical scale is Tmb in mK. All continuum levels have been ignored. |
| In the text | |
|
Fig. 9. Comparison between H2 and H I (21 cm) column densities for the known molecular-absorption-line systems at high-redshift. Ts = 1000 K (100 K) is adopted for associated (intervening) systems shown as circles (squares). The color of the symbols represents the redshift, as indicated by the color bar on the right, and the size of the symbol traces the velocity extent of the absorption averaged over the H I and H2 components. |
| In the text | |
|
Fig. 10. Velocity offsets of H I 21 cm and CO absorption lines. The zero of the velocity scale corresponds to z21. For H I, both the extent of the full and secondary absorption are shown. The vertical ticks mark the location of H I and CO absorption peaks, and the systemic velocity – except for PKS 1200+045 – based on optical emission lines is shown with a star ⋆. |
| In the text | |
Current usage metrics show cumulative count of Article Views (full-text article views including HTML views, PDF and ePub downloads, according to the available data) and Abstracts Views on Vision4Press platform.
Data correspond to usage on the plateform after 2015. The current usage metrics is available 48-96 hours after online publication and is updated daily on week days.
Initial download of the metrics may take a while.