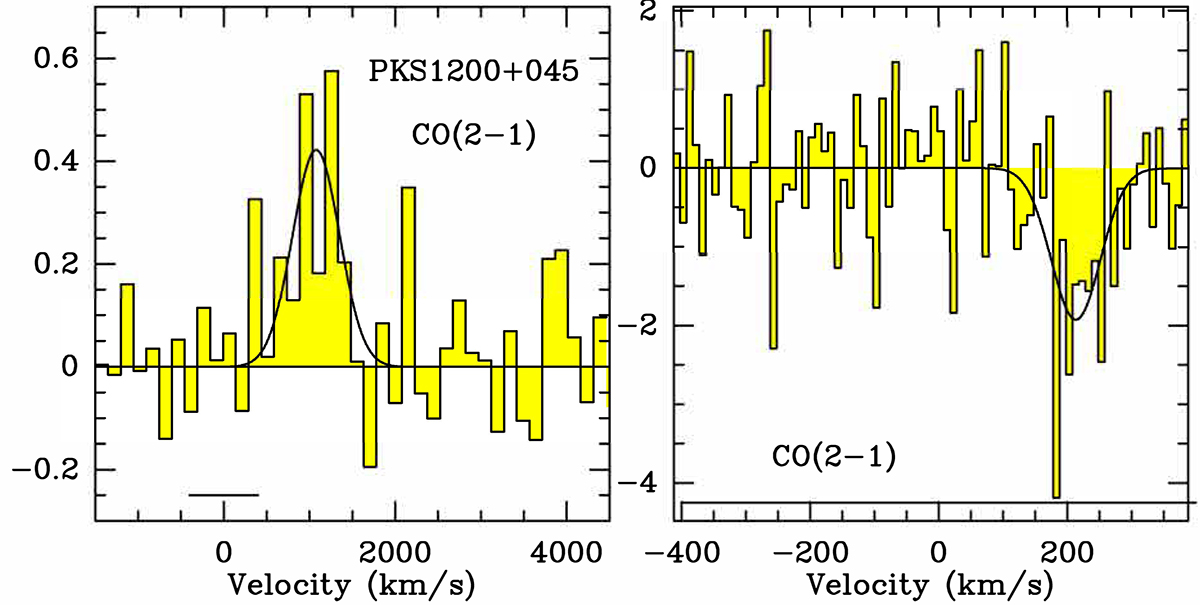
Fig. 6.
Download original image
Left: CO(2–1) emission spectrum of PKS1200+045 obtained with NOEMA and smoothed to 150km s−1. The velocity scale is centered at the average of H I absorption. Right: CO(2–1) absorption spectrum toward PKS1200+045. The spectral resolution is 10 km s−1. In both panels, vertical scales are in mJy beam−1 and the horizontal line at the bottom indicates the velocity range over which the H I 21 cm absorption is detected (Aditya & Kanekar 2018).
Current usage metrics show cumulative count of Article Views (full-text article views including HTML views, PDF and ePub downloads, according to the available data) and Abstracts Views on Vision4Press platform.
Data correspond to usage on the plateform after 2015. The current usage metrics is available 48-96 hours after online publication and is updated daily on week days.
Initial download of the metrics may take a while.