| Issue |
A&A
Volume 671, March 2023
|
|
|---|---|---|
| Article Number | A43 | |
| Number of page(s) | 7 | |
| Section | Extragalactic astronomy | |
| DOI | https://doi.org/10.1051/0004-6361/202245482 | |
| Published online | 03 March 2023 | |
PKS 1413+135: OH and H I at z = 0.247 with MeerKAT⋆
1
Observatoire de Paris, LERMA, Collège de France, CNRS, PSL University, Sorbonne University, 75014 Paris, France
e-mail: This email address is being protected from spambots. You need JavaScript enabled to view it.
2
Inter-University Centre for Astronomy and Astrophysics, Post Bag 4, Ganeshkhind, Pune 411 007, India
3
Department of Space, Earth and Environment, Chalmers University of Technology, Onsala Space Observatory, 43992 Onsala, Sweden
4
Ioffe Institute, Polyteknicheskaya 26, 194021 Saint-Petersburg, and HSE University, Saint-Petersburg, Russia
5
National Radio Astronomy Observatory, 520 Edgemont Road, Charlottesville, VA 22903, USA
6
Max-Planck-Institut für Radioastronomie, Auf dem Hügel 69, 53121 Bonn, Germany
7
Astrophysics Research Centre, University of KwaZulu-Natal, Durban 4041, South Africa
8
School of Mathematics, Statistics & Computer Science, University of KwaZulu-Natal, Durban 4041, South Africa
9
National Radio Astronomy Observatory, Socorro, NM 87801, USA
10
Institut d’Astrophysique de Paris, CNRS-SU, UMR 7095, 98bis bd Arago, 75014 Paris, France
11
French-Chilean Laboratory for Astronomy, IRL 3386, CNRS and U. de Chile, Casilla 36-D, Santiago, Chile
12
Green Bank Observatory, PO Box 2 Green Bank, WV 24944, USA
Received:
16
November
2022
Accepted:
8
December
2022
Abstract
The BL Lac object PKS 1413+135 was observed by the Large Survey Project MeerKAT Absorption Line Survey (MALS) in the L-band, at 1139 MHz and 1293–1379 MHz, targeting the H I and OH lines in absorption at z = 0.24671. The radio continuum might come from the nucleus of the absorbing galaxy or from a background object at redshift lower than 0.5, as suggested by the absence of gravitational images. The H I absorption line is detected at a high signal-to-noise ratio, with a narrow central component, and with a red wing, confirming previous results. The OH 1720 MHz line is clearly detected in (maser) emission, peaking at a velocity shifted by −10 to −15 km s−1 with respect to the H I peak. The 1612 MHz line is lost due to radio frequency interference. The OH 1667 MHz main line is tentatively detected in absorption, but not the 1665 MHz line. Over 30 years a high variability is observed in optical depths, due to the rapid changes of the line of sight caused by the superluminal motions of the radio knots. The H I line has varied by 20% in depth, while the OH-1720 MHz depth has varied by a factor of ∼3. The position of the central velocity and the widths also varied. The absorbing galaxy is an early-type spiral (maybe S0) seen edge-on, with a prominent dust lane, covering the whole disk. Given the measured mass concentration and the radio continuum size at centimeter wavelengths (100 mas corresponding to 400 pc at z = 0.25), the width of the absorption lines from the nuclear regions are expected up to 250 km s−1. The narrowness of the observed lines (< 15 km s−1) suggests that the absorption comes from an outer gas ring, as frequently observed in S0 galaxies. The millimetric lines are even narrower (< 1 km s−1), which corresponds to the continuum size restricted to the core. The radio core is covered by individual 1 pc molecular clouds, whose column density is a few 1022 cm−2, which is compatible with the gas screen detected in X-rays.
Key words: BL Lacertae objects: individual: PKS1413+135 / galaxies: general / galaxies: kinematics and dynamics / quasars: absorption lines / galaxies: ISM
The data for the spectra (as either FITS files or ASCII tables) are only available at the CDS via anonymous ftp to cdsarc.cds.unistra.fr (130.79.128.5) or via https://cdsarc.cds.unistra.fr/viz-bin/cat/J/A+A/671/A43
© The Authors 2023
 Open Access article, published by EDP Sciences, under the terms of the Creative Commons Attribution License (https://creativecommons.org/licenses/by/4.0), which permits unrestricted use, distribution, and reproduction in any medium, provided the original work is properly cited.
This article is published in open access under the Subscribe to Open model. This email address is being protected from spambots. You need JavaScript enabled to view it. to support open access publication.
1. Introduction
Since its discovery PKS 1413+135 has been a mystery, raising questions regarding the classification schemes of active galactic nuclei (AGN). It is classified as a BL Lac for its highly compact variable polarized continuum emission, corresponding to a relativistic jet oriented close to the line of sight (Beichman et al. 1981). Bregman et al. (1981) found only weak emission lines in the optical spectrum of the galaxy associated with the radio source, supporting the BL Lac character. They determined a redshift of z = 0.26 for the galaxy from calcium absorption lines. However, the galaxy might not be the host of the BL Lac object. The vast majority of BL Lac objects and radio-loud quasars are hosted by elliptical galaxies, while PKS 1413+135 appears to be hosted by an Sb-c spiral galaxy (McHardy et al. 1991). The galaxy appears almost edge-on, and therefore the jet axis should be almost in the galaxy plane. The jet should then trigger significant activity, such as a narrow-line region, but none is detected in the galaxy. Very long baseline interferometry (VLBI) measurements have shown that PKS 1413+135 might be a compact symmetric object (CSO), a young radio source with a two-sided parsec-scale jet; more precisely, the jet structure is slightly bent, like a wide-angle tail (WAT) source (Perlman et al. 1996, 2002). This means that the jet is not along the line of sight and does not benefit from beaming. However, the jet orientation might have changed with scale since the core appears beamed. The source was also classified as a red quasar since the extinction is rather high, with a column density higher than 2×1022 cm−2 and visual extinction Av > 30 (Stocke et al. 1992); this high extinction explains the deficit of soft X-rays from PKS 1413+135. Although the radio source coincides with the galaxy center, it was thought that the radio source might be a background source, given the absence of emission lines and strong thermal infrared flux.
Carilli et al. (1992) detected H I 21 cm in absorption in the galaxy at z = 0.24671, with a high column density (> 1022 cm−2), supporting the high extinction found by Stocke et al. (1992), and confirming the classification of the galaxy as a late-type spiral. Molecular clouds were also observed in absorption by Wiklind & Combes (1994), supporting a high gas column-density. Monitoring over two years revealed high variation in the molecular absorption opacity spectrum, attributed to the superluminal character of the BL Lac. This high gas column density exacerbates the problem of the absence of thermal emission expected from the gas heated by an internal active nucleus. An alternative interpretation of the variability of BL Lac objects is that the background AGN suffers microlensing by the stars of a foreground galaxy (Ostriker & Vietri 1990). For better efficiency of stellar microlensing, while avoiding macrolensing, the AGN should be close to the foreground galaxy. The Very Long Baseline Array (VLBA) data from Perlman et al. (2002) provide a high resolution map of the HI absorption, which is mainly in front of the eastern mini-jet 25 mas from the radio core. The molecular gas absorbs in front of the core, and maybe also the OH line. The core happens to be offset by 13 mas (=50 pc) from the gravity center of the spiral galaxy. This offset might favor a background location for the AGN, although Perlman et al. (2002) favor a patchy absorption from the spiral galaxy. If the AGN is behind the spiral, it must be at z < 0.3 to avoid arcs and lensing images, which are not observed, and thus close to the spiral (z = 0.25) we should see its galaxy host in HST images.
Recently, Vedantham et al. (2017b,a) discovered symmetric achromatic variability (SAV) in PKS 1413+135 in the forms of a 1yr long U-shaped perturbation of the light curve, with a symmetric feature 5 yr later. This nicely corresponds to the signature of gravitational milli-lensing when knots in the relativistic jet cross caustics created by lenses of mass between 103 and 106 M⊙ within the intervening galaxy. Combining all VLBI monitoring at several wavelengths, Readhead et al. (2021) conclude that PKS 1413+135 is a background BL Lac quasar, with radio jets aligned along the line of sight and located at 0.25 < z < 0.5. The intervening galaxy is a nearly edge-on Seyfert 2 spiral, providing the milli-lensing episodes responsible in part for the variability, the other part being intrinsic to the BL Lac. They show that the jet appears quasi-perpendicular to the galaxy major axis, and has an extension of 110 mas. Since the optical spectrum from Vedantham et al. (2017b) should reveal signatures from the background galaxy, which are not detected, the localization of the radio continuum source is not yet settled. It is possible that the BL Lac is not hosted by a massive elliptical, but by a galaxy half as luminous as the foreground Seyfert; thanks to the high dust obscuration observed (by a factor of ∼10 in the near-infrared) and the luminosity dimming at z = 0.5, the expected flux ratio between the two galaxies could be as high as 100.
The size of the radio source at centimeter wavelengths is 0.11″ ∼ 400 pc (Perlman et al. 1996). This broadens the absorption spectrum because the gas actually involved in the absorption traces the velocity gradient over that length in the disk for H I 21 cm and OH 18 cm. The millimeter lines are much narrower since the continuum is only significant in the core (Wiklind & Combes 1994).
Kanekar & Chengalur (2002) detect the main OH line at 1667 MHz, while Darling (2004) detects the conjugate satellite lines (1612 MHz in absorption and 1720 MHz in emission), but none of the main OH lines. The 1720 and 1612 MHz line rest frequencies have different dependences on the fine structure constant α and the proton-electron mass ratio μ, and they have been used to constrain the variation of these fundamental constants (Kanekar & Chengalur 2002; Kanekar et al. 2004, 2018; Darling 2004). Because the lines are conjugate, and their optical depths are perfectly symmetric, they are a privileged tool, eliminating the possible biases that the lines are not coming from the same gas along the line of sight. In the present work we report new H I and OH observations of PKS 1413+135 carried out as part of the MeerKAT Absorption Line Survey (MALS; Gupta et al. 2017). We quantify the time variability of the various components, and through comparison with previous millimeter-wave observations we draw some conclusions on the nature and location of the absorptions.
This paper is structured as follows. Section 2 presents the details of the observations and data analysis with ARTIP. The results in terms of optical depth and column density are quantified in Sect. 3, as well as the time variability. We discuss in Sect. 4 the origin of the various absorption components in comparison with the dense molecular gas absorptions. Section 5 summarizes our conclusions. Throughout the paper the velocity scale is defined with respect to z = 0.24671 (barycentric reference frame), which corresponds to the main atomic (Carilli et al. 1992) and molecular (e.g., CO, HCO+, HCN, and OH) absorption components detected at millimeter wavelengths (Wiklind & Combes 1994) or centimeter wavelengths (Kanekar & Chengalur 2002; Darling 2004). To compute distances we adopt a flat ΛCDM cosmology, with Ωm = 0.29, ΩΛ = 0.71, and the Hubble constant H0 = 70 km s−1 Mpc−1. At the distance of the PKS 1413+135 absorber, 1 arcsec corresponds to 3.9 kpc in physical units.
2. Observations and data analysis
The field centered at PKS 1413+135 was observed as part of MALS on October 16, 2020, using 59 antennas of the MeerKAT-64 array and the 32K mode of the SKA Reconfigurable Application Board (SKARAB) correlator. The total bandwidth of 856 MHz centered at 1283.9869 MHz was split into 32,768 frequency channels. The resultant frequency resolution is 26.123 kHz, or 6.1 km s−1, at the center of the band. The correlator dump time was 8 seconds. The objects 3C286 and PKS1939–638 were observed for flux density scale, delay, and bandpass calibrations. The compact radio source J1347+1217 was observed for complex gain calibration. The total on-source time on PKS 1413+135 was 56 mins. The data were processed using the latest version of the Automated Radio Telescope Imaging Pipeline ARTIP based on CASA 6.3.0 (CASA Team 2022). The details of ARTIP and the calibration steps are provided in Gupta et al. (2021).
The spectral line processing of the MALS datasets through ARTIP partitions the wideband into 16 spectral windows (SPWs) labeled SPW-0 to SPW-15 (for details, see Gupta et al. 2021). In short, the measurement sets for each SPW are processed for continuum imaging with self-calibration. We performed three rounds of phase-only with a solution interval of 1 min, and one round of amplitude-and-phase self-calibration with a solution interval of 5 min. These self-calibration gain solutions were applied to the visibilities prior to continuum subtraction and cube imaging. The H I 21 cm and the four OH lines for z = 0.24671 would fall in SPWs 4, 8, and 9. Here, we mainly focus on the stokes I radio continuum and spectral line properties of the target obtained using the robust = 0 weighting of the visibilities for these SPWs, as implemented in CASA. The frequency ranges covered by these SPWs and the corresponding spectral rms are summarized in Table 1. In the table we also provide the synthesized beams and continuum flux densities for the continuum images generated using the visibilities from these SPWs.
Properties of PKS1413+135 observations for relevant SPWs.
3. Results
3.1. H I absorption
Figure 1 displays MeerKAT H I 21 cm absorption in front of PKS 1413+135 at z = 0.24671. Given the asymmetry of the line, the best fit providing a satisfactory model of the total spectrum required five Gaussian components. The characteristics of all the components are listed in Table 2. These components may not be physical, but are just practical to completely reproduce the global profile. There is a wide component in the red wing, which was also seen by Darling (2004), although it was thought at that time that it might come from the radio frequency interference (RFI). The global integrated H I 21 cm optical depth is ∫τdv = 10.86 ± 0.32 km s−1. Assuming a homogeneous and optically thin gas, at spin temperature Ts = 100 K, with a covering factor  , and using the equation
 (1)
(1)
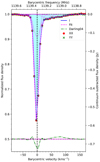 |
Fig. 1. MeerKAT stokes I H I 21 cm spectrum of PKS 1413+135. The individual Gaussian components fitted to the absorption profile (dotted lines), the total fit (dashed line), and the residuals (dot-dashed lines) are also shown. For comparison, we also show the residuals with respect to the GBT spectrum reproduced using the Gaussian components provided in Darling (2004; dot-dashed green line). The individual XX and YY MeerKAT spectra are shown as points and crosses, respectively. |
Multiple Gaussian fits to the H I 21 cm absorption.
we obtain the H I column density N(H I) = (1.98 ± 0.06)×1021 cm−2.
3.2. OH main and satellite lines
Figure 2 shows that the 1720 MHz satellite line is well detected with MeerKAT, while Fig. 3 displays the spectrum of the OH main lines. There is only a hint of a detection of the 1667 MHz line, which was already detected by Kanekar & Chengalur (2002). The 1665 MHz line is not detected. In local thermodynamic equilibrium (LTE), the relative strengths of the 18cm lines are expected to follow the ratio 1612:1665:1667:1720 MHz = 1:5:9:1. Since we tentatively detect the 1667 MHz line, there is no surprise that there is only an upper limit for the 1665 MHz line.
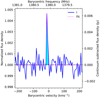 |
Fig. 2. MeerKAT Stokes-I spectrum (blue) of OH 1720 MHz line at z = 0.24671 toward PKS 1413+135. The single-Gaussian component (peak = 0.0076±0.0031 Jy; shift = −10.37±0.99 km s−1; sigma = 2.8±1 km s−1) fitted to the emission line is shown as a dashed line. The emission corresponds to a weakly masing line, while the 1612 MHz emission is seen in absorption (Darling 2004). The RFI at this frequency prevented MeerKAT from observing the emission. |
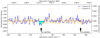 |
Fig. 3. MeerKAT Stokes-I spectrum (blue for robust = 0 and orange for robust = 1) of the OH main lines absorption at z = 0.24671 toward PKS 1413+135. The spectral rms noise is 0.9 mJy beam−1 channel−1. Vertical arrows indicate the expected positions of the 1665 and 1667 MHz lines. There is a tentative dip in the flux at the location of 1667 MHz line corresponding to ∫τdv = 0.03±0.01 km s−1. |
We detect the 1720 MHz line in emission (see Fig. 2), while the expected absorption at 1612 MHz is undetected due to RFI. The two satellite lines have been clearly detected by Darling (2004) and Kanekar et al. (2018) to be exactly symmetric, with their sum of negative and positive integrated optical depths cancelling out. The OH satellite lines were also observed to exhibit conjugate behavior in PKS1830-211 (Combes et al. 2021).
3.3. Time variability
The radio continuum emission from the background blazar is found to vary in time, sometimes with large factors, likely due to milli-lensing (Peirson et al. 2022). However, the optical depth of the H I and OH absorption lines vary even more (see Table 3 and Fig. 4).
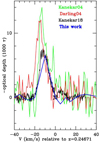 |
Fig. 4. MeerKAT OH 1720 MHz spectrum taken in 2020 (blue), compared to the spectrum observed in 2003 by Kanekar et al. (2004) with WSRT (green), the spectrum observed in 2003 by Darling (2004) with GBT (red), and the spectrum observed in 2010–2012 by Kanekar et al. (2018) with Arecibo (black). All spectra have been normalized to their observed continuum. |
Multiple epochs of HI and OH absorptions at z = 0.24671.
Figure 1 shows that the difference in the H I optical depth between Darling (2004) and the present work is detected at 6σ, while the peak optical depth in 2003 was twice that of 1992 (see Table 3). The bulk of the H I absorption does not come from the core of the radio source, but from one knot in the radio jet, the eastern mini-lobe at 25 mas (=100 pc) from the core, as shown with the VLBA by Perlman et al. (2002). Since the jet has superluminal motions, it is expected that the line of sight explored is varying relatively quickly, especially in a clumpy medium (Wiklind & Combes 1997). The continuum source is not extended more than a few tens of milliarcseconds, and the absorbing medium has the size of an interstellar cloud.
We compared all available OH 1720 MHz spectra from 2003 with the present MeerKAT spectra. Figure 4 shows that the peak optical depth is varying, as are the central velocity and the width of the spectral features. The absorption peaks between 5% and 14% of the continuum, with a central velocity from −10 to −15 km s−1 with respect to the CO and H I velocities. The FWHM varies between 7 and 11 km s−1. Although observations at a smaller number of epochs are available for the H I absorption, it appears that it is slightly less variable, as expected for a less clumpy component. As already noted in Combes et al. (2021) for PKS1830-211, the atomic component is more diffuse, more extended both in radius and in height in the galaxy plane.
Additional sources of variation might be due to the milli-lensing events, observed through the symmetric achromatic variability events monitored by Vedantham et al. (2017b,a). These events usually last more than one year, and they occurred clearly in 1993–1995, 2009–2010, 2014–2015 (Peirson et al. 2022). They also affected some absorption measurements in 2010 (Kanekar et al. 2018), and also in the molecular component (Wiklind & Combes 1994, 1997).
4. Kinematic interpretation of the spectra
PKS 1413+135 has been considered for a long time as a puzzling source. It shows two sets of characteristics that appear contradictory. On one side it exhibits a BL Lac character with a radio jet relativistically boosted toward the observer, with apparent transverse velocity up to v ∼ 1.5c measured through proper motions with VLBA (e.g., Lister et al. 2016). This would mean that the jet orientation is close to the line of sight; however, it also has a counterjet, which suggests a re-orientation somewhere along the jet. Paradoxically, it has also been classified as a CSO, which are typically small and young objects that have jet axes not aligned close to the line of sight. CSOs are often thought to have re-starting jet activity, and PKS 1413+135 in 2019 revealed violent variations (more than an order of magnitude) in γ-rays (Principe et al. 2021). It is the first CSO detected at very high energies, larger than 100 GeV (Blanch et al. 2022). Gan et al. (2022) show that the source becomes harder in frequency when brighter, and that the recent flare of PKS1413+135 might be linked to its re-started jet activity.
Powerful radio jets are not generally associated with spiral galaxies, and in the case of PKS 1413+135 the radio source core corresponds to the nucleus of an edge-on early-type spiral galaxy (McHardy et al. 1994). Many authors (e.g., McHardy et al. 1991; Perlman et al. 2002) have questioned its association with this galaxy since no infrared activity is observed, contrary to what is expected for the host of a powerful AGN that has a radio jet aligned along its plane. The true galaxy host could be a background galaxy, hard to detect since hidden by the foreground edge-on galaxy. The latter could have some lensing effect on the BL Lac, but since no lensed images are seen, its redshift may be limited to the range 0.2467 < z < 0.5 (Readhead et al. 2021). Only milli-lensing events are possible, and would correspond to the SAV events observed by Vedantham et al. (2017b).
The various absorption lines coming from the foreground edge-on galaxy and observed in front of the background radio source provide precious information. This data could bring new clues to the nature of this puzzling source.
4.1. Galaxy model
The H I spectrum is remarkable for its main narrow central component at zero velocity, and its redshifted wing, extending up to 100 km s−1. It is also striking that it is not seen toward the radio core, but mainly from a counterjet knot, 25 ms (=100 pc) northeast from the core (Perlman et al. 2002), on the minor axis of the galaxy. All the other absorption lines come from the core region, where the X-ray absorption indicates a large column density N(H) ∼ 6×1022 cm−2 (Stocke et al. 1992).
The systemic velocity was set such that the main narrow H I absorption is centered at zero velocity. All lines peak at this velocity, except the OH 18 cm satellite lines. This might also be the systemic velocity of the foreground galaxy since most of the absorption is coming from the minor axis of the rotating spiral. On the contrary, the two OH satellite lines appear at V = −10 or −15 km s−1, according to the observing epoch (see Fig. 4). The fact that the H I absorption does not come from the core (almost coincident with the foreground galaxy nucleus) is not surprising since there is a well-known H I depletion in spiral galaxy centers (e.g., Walter et al. 2008).
The edge-on spiral galaxy appears to be of very early type, perhaps a lenticular. This is supported by the large and massive bulge, as photometrically fitted by McHardy et al. (1994). With the bulge alone the effective radius is best fit as 11 kpc, but when the bulge and disk are fitted together the effective bulge radius is found to be 9.7 kpc. The disk is quite thick, with characteristic height-to-size ratio h/R = 0.24. The mass concentration is high, and a Sersic index of n = 4 is used. With this mass concentration, for a galaxy of total mass ∼3×10¹⁰ M⊙ the velocity width at the nucleus is expected to be on the order of 300 km s−1.
Since all absorption lines are quite narrow, with a FWHM lower than 15 km s−1, except for the weak red wing of the H I spectrum, it is likely that the absorbing gas is not located in the nuclear region, but is orbiting in an outer gaseous ring. These gaseous rings are frequently observed in lenticular galaxies (e.g., van Driel & van Woerden 1991). The ring likely corresponds to the dust lane observed crossing the disk in the HST image of McHardy et al. (1994). Because the dust lane covers the whole disk extent, it must be an outer ring.
4.2. Nature of the absorbing gas
The H I 21 cm and OH 18 cm lines are narrow, but the millimetric lines are even narrower. As reported by Wiklind & Combes (1997), the CO(1–0) line is composed of two main components, of FWHM = 0.6–1.9 km s−1, the deepest absorption being at velocity V = −0.5 km s−1 and the other at +0.6 km s−1. According to the epoch observed, a third weaker line might appear wider (FWHM 0.6–7 km s−1) in the red wing located at V = 1–2 km s−1. The position, intensity, and widths of these components varying with time, by factors of ∼2 over two years, due to the change in line of sight toward the continuum core, with the knots moving at superluminal speeds.
Figure 5 highlights the difference in widths between the centimeter and millimeter absorption lines. This is easily interpreted due to the difference in extent of the background continuum at these two frequencies. As shown in Perlman et al. (1996, 2002), the radio source contains a jet and counterjet, of size 100 mas ∼400 pc, but only at centimeter wavelengths. Already at 43 GHz the source is reduced to a point-like core, with the beam size (< 1 mas). The millimeter pencil beam of the continuum may encounter only one cloud, of size 1 pc, corresponding to the observed width, according to the size–linewidth relation (Solomon et al. 1987). The medium is certainly clumpy, and several components may occur on the edge-on gaseous ring, for a kiloparsec width of the ring. For H I and OH absorption lines the continuum covers a broader region of the ring, explaining the observed wider absorptions. A schematic view of the various components is sketched in Fig. 6.
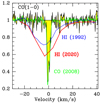 |
Fig. 5. Comparison between the CO(1–0) and H I lines. All spectra are normalized to their respective continuum. The blue curve is the H I absorption, observed in 1992 with the VLA by Carilli et al. (1992) with channels 2.57 km s−1, and the red curve is from this work (H I spectrum obtained in 2020 with 6 km s−1 channels). Superposed on the CO(1–0) spectrum observed in 1996 (black) from Wiklind & Combes (1997) is a CO(1–0) spectrum (green) obtained with the Institut de Radioastronomie Millimétrique (IRAM) interferometer in 2008, showing no variation. |
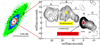 |
Fig. 6. Schematic view of the atomic and molecular absorptions. The HST legacy archive image of the absorbing galaxy in H-band (F160W) is plotted on the left, and the 5 GHz VLBI image from Perlman et al. (1996) showing the jet (west) and counterjet (east) is on the right. The contours are spaced by a factor of |

Figure 5 also shows that the CO(1–0) spectrum has not varied between 1996 and 2008. This might indicate that the core component, toward which the millimeter absorptions are detected, is not actually moving, and that the superluminal motions only affect the jet. At centimeter wavelengths, the absorptions occur toward the more extended continuum emission, including the jets, for both OH and H I, and this explains their variations. Although the H I and OH absorptions are not centered at the same point, their extensions overlap, and that is why their variations are somewhat correlated: their optical depths both decreased between 2003 and 2020.
5. Conclusions
We report results from the MALS project on the MeerKAT array toward the BL Lac source PKS 1413+135. A strong H I absorption is detected, decomposed into five Gaussian components, with high signal-to-noise ratio (S/N ∼ 30 in channels of 6 km s−1). The main OH component at 1667 MHz is tentatively detected, but not the 1665 MHz component. The 1720 MHz satellite line is clearly detected, while radio frequency interference (RFI) prevented us from detecting the expected absorption line at 1612 MHz.
The 1720 MHz satellite line is observed in stimulated (maser) emission, due to radiative pumping through far-infrared radiation. Previous observations (Darling 2004; Kanekar et al. 2018) have shown that the two satellite lines are perfectly conjugate, with the 1612 MHz line in absorption.
The absorption lines have been observed since 1992. The H I component reveals a 30% variation in its depth in 2020 with respect to 2003 (see Table 3), but only slightly in velocity position or width. The 1720 MHz OH satellite line shows more variation: a factor of 3 in optical depth, in velocity position, and in width (see Fig. 4). These variations can easily be explained by the change in the line of sight, related to the superluminal motion of the background radio continuum knots.
Due to discovered SAV in PKS 1413+135, attributed to milli-lensing events, it is possible that the continuum source belongs to a background AGN, at redshift lower than 0.5 (Peirson et al. 2022). The size of the jet and counterjet covers 400 pc at the distance of the foreground absorbing galaxy in the rest frame 18 and 21 cm wavelengths. The very narrow (FWHM < 15 km s−1) OH and H I absorption lines suggest that the absorbing interstellar medium in the foreground edge-on galaxy is located in an outer gas ring. The foreground galaxy is an early-type spiral, likely a lenticular given its very massive bulge. The width sampled by the gas in the 400 pc nuclear region is expected to be much larger (250 km s−1). In the millimeter domain, the continuum size is much smaller (< 4 pc), restricted to its core. Along this pencil beam the line of sight may encounter individual parsec-scale clouds, accounting for the extremely narrow (FWHM ∼ 1 km s−1) absorption in CO, HCO+, or HCN (Wiklind & Combes 1997). The typical surface density of molecular clouds (a few 1022 cm−2) corresponds to the optical depth found in X-ray data (Stocke et al. 1992).
Acknowledgments
The MeerKAT telescope is operated by the South African Radio Astronomy Observatory, which is a facility of the National Research Foundation, an agency of the Department of Science and Innovation. KM acknowledges support from the National Research Foundation of South Africa. The MeerKAT data were processed using the MALS computing facility at IUCAA (https://mals.iucaa.in/releases). The Common Astronomy Software Applications (CASA) package is developed by an international consortium of scientists based at the National Radio Astronomical Observatory (NRAO), the European Southern Observatory (ESO), the National Astronomical Observatory of Japan (NAOJ), the Academia Sinica Institute of Astronomy and Astrophysics (ASIAA), the CSIRO division for Astronomy and Space Science (CASS), and the Netherlands Institute for Radio Astronomy (ASTRON) under the guidance of NRAO. The National Radio Astronomy Observatory is a facility of the National Science Foundation operated under cooperative agreement by Associated Universities, Inc. We made use of the NASA/IPAC Extragalactic Database (NED).
References
- Beichman, C. A., Neugebauer, G., Soifer, B. T., et al. 1981, Nature, 293, 711 [NASA ADS] [CrossRef] [Google Scholar]
- Blanch, O., Sitarek, J., & Striskovic, J. 2022, ATel, 15161, 1 [NASA ADS] [Google Scholar]
- Bregman, J. N., Lebofsky, M. J., Aller, M. F., et al. 1981, Nature, 293, 714 [NASA ADS] [CrossRef] [Google Scholar]
- Carilli, C. L., Perlman, E. S., & Stocke, J. T. 1992, ApJ, 400, L13 [NASA ADS] [CrossRef] [Google Scholar]
- CASA Team (Bean, B., et al.) 2022, PASP, 134, 11450 [Google Scholar]
- Combes, F., Gupta, N., Muller, S., et al. 2021, A&A, 648, A116 [NASA ADS] [CrossRef] [EDP Sciences] [Google Scholar]
- Darling, J. 2004, ApJ, 612, 58 [Google Scholar]
- Gan, Y.-Y., Zhang, J., Yao, S., et al. 2022, ApJ, 939, 78 [NASA ADS] [CrossRef] [Google Scholar]
- Gupta, N., Srianand, R., Baan, W., et al. 2017, ArXiv e-prints [arXiv:1708.07371] [Google Scholar]
- Gupta, N., Jagannathan, P., Srianand, R., et al. 2021, ApJ, 907, 11 [Google Scholar]
- Kanekar, N., & Chengalur, J. N. 2002, A&A, 381, L73 [NASA ADS] [CrossRef] [EDP Sciences] [Google Scholar]
- Kanekar, N., Chengalur, J. N., & Ghosh, T. 2004, Phys. Rev. Lett., 93, 051302 [Google Scholar]
- Kanekar, N., Ghosh, T., & Chengalur, J. N. 2018, Phys. Rev. Lett., 120, 061302 [Google Scholar]
- Lister, M. L., Aller, M. F., Aller, H. D., et al. 2016, AJ, 152, 12 [NASA ADS] [CrossRef] [Google Scholar]
- McHardy, I. M., Abraham, R. G., Crawford, C. S., et al. 1991, MNRAS, 249, 742 [NASA ADS] [CrossRef] [Google Scholar]
- McHardy, I. M., Merrifield, M. R., Abraham, R. G., & Crawford, C. S. 1994, MNRAS, 268, 681 [NASA ADS] [Google Scholar]
- Ostriker, J. P., & Vietri, M. 1990, Nature, 344, 45 [NASA ADS] [CrossRef] [Google Scholar]
- Peirson, A. L., Liodakis, I., Readhead, A. C. S., et al. 2022, ApJ, 927, 24 [NASA ADS] [CrossRef] [Google Scholar]
- Perlman, E. S., Carilli, C. L., Stocke, J. T., & Conway, J. 1996, AJ, 111, 1839 [NASA ADS] [CrossRef] [Google Scholar]
- Perlman, E. S., Stocke, J. T., Carilli, C. L., et al. 2002, AJ, 124, 2401 [NASA ADS] [CrossRef] [Google Scholar]
- Principe, G., Di Venere, L., Orienti, M., et al. 2021, MNRAS, 507, 4564 [NASA ADS] [CrossRef] [Google Scholar]
- Readhead, A. C. S., Ravi, V., Liodakis, I., et al. 2021, ApJ, 907, 61 [NASA ADS] [CrossRef] [Google Scholar]
- Solomon, P. M., Rivolo, A. R., Barrett, J., & Yahil, A. 1987, ApJ, 319, 730 [Google Scholar]
- Stocke, J. T., Wurtz, R., Wang, Q., Elston, R., & Jannuzi, B. T. 1992, ApJ, 400, L17 [NASA ADS] [CrossRef] [Google Scholar]
- van Driel, W., & van Woerden, H. 1991, A&A, 243, 71 [NASA ADS] [Google Scholar]
- Vedantham, H. K., Readhead, A. C. S., Hovatta, T., et al. 2017a, ApJ, 845, 90 [NASA ADS] [CrossRef] [Google Scholar]
- Vedantham, H. K., Readhead, A. C. S., Hovatta, T., et al. 2017b, ApJ, 845, 89 [NASA ADS] [CrossRef] [Google Scholar]
- Walter, F., Brinks, E., de Blok, W. J. G., et al. 2008, AJ, 136, 2563 [Google Scholar]
- Wiklind, T., & Combes, F. 1994, A&A, 286, L9 [NASA ADS] [Google Scholar]
- Wiklind, T., & Combes, F. 1997, A&A, 328, 48 [NASA ADS] [Google Scholar]
- Bean, B. CASA Team 2022, PASP, 134, 11450 Bhatnagar, S., et al. [Google Scholar]
All Tables
All Figures
|
Fig. 1. MeerKAT stokes I H I 21 cm spectrum of PKS 1413+135. The individual Gaussian components fitted to the absorption profile (dotted lines), the total fit (dashed line), and the residuals (dot-dashed lines) are also shown. For comparison, we also show the residuals with respect to the GBT spectrum reproduced using the Gaussian components provided in Darling (2004; dot-dashed green line). The individual XX and YY MeerKAT spectra are shown as points and crosses, respectively. |
| In the text | |
|
Fig. 2. MeerKAT Stokes-I spectrum (blue) of OH 1720 MHz line at z = 0.24671 toward PKS 1413+135. The single-Gaussian component (peak = 0.0076±0.0031 Jy; shift = −10.37±0.99 km s−1; sigma = 2.8±1 km s−1) fitted to the emission line is shown as a dashed line. The emission corresponds to a weakly masing line, while the 1612 MHz emission is seen in absorption (Darling 2004). The RFI at this frequency prevented MeerKAT from observing the emission. |
| In the text | |
|
Fig. 3. MeerKAT Stokes-I spectrum (blue for robust = 0 and orange for robust = 1) of the OH main lines absorption at z = 0.24671 toward PKS 1413+135. The spectral rms noise is 0.9 mJy beam−1 channel−1. Vertical arrows indicate the expected positions of the 1665 and 1667 MHz lines. There is a tentative dip in the flux at the location of 1667 MHz line corresponding to ∫τdv = 0.03±0.01 km s−1. |
| In the text | |
|
Fig. 4. MeerKAT OH 1720 MHz spectrum taken in 2020 (blue), compared to the spectrum observed in 2003 by Kanekar et al. (2004) with WSRT (green), the spectrum observed in 2003 by Darling (2004) with GBT (red), and the spectrum observed in 2010–2012 by Kanekar et al. (2018) with Arecibo (black). All spectra have been normalized to their observed continuum. |
| In the text | |
|
Fig. 5. Comparison between the CO(1–0) and H I lines. All spectra are normalized to their respective continuum. The blue curve is the H I absorption, observed in 1992 with the VLA by Carilli et al. (1992) with channels 2.57 km s−1, and the red curve is from this work (H I spectrum obtained in 2020 with 6 km s−1 channels). Superposed on the CO(1–0) spectrum observed in 1996 (black) from Wiklind & Combes (1997) is a CO(1–0) spectrum (green) obtained with the Institut de Radioastronomie Millimétrique (IRAM) interferometer in 2008, showing no variation. |
| In the text | |
|
Fig. 6. Schematic view of the atomic and molecular absorptions. The HST legacy archive image of the absorbing galaxy in H-band (F160W) is plotted on the left, and the 5 GHz VLBI image from Perlman et al. (1996) showing the jet (west) and counterjet (east) is on the right. The contours are spaced by a factor of |
| In the text | |
Current usage metrics show cumulative count of Article Views (full-text article views including HTML views, PDF and ePub downloads, according to the available data) and Abstracts Views on Vision4Press platform.
Data correspond to usage on the plateform after 2015. The current usage metrics is available 48-96 hours after online publication and is updated daily on week days.
Initial download of the metrics may take a while.