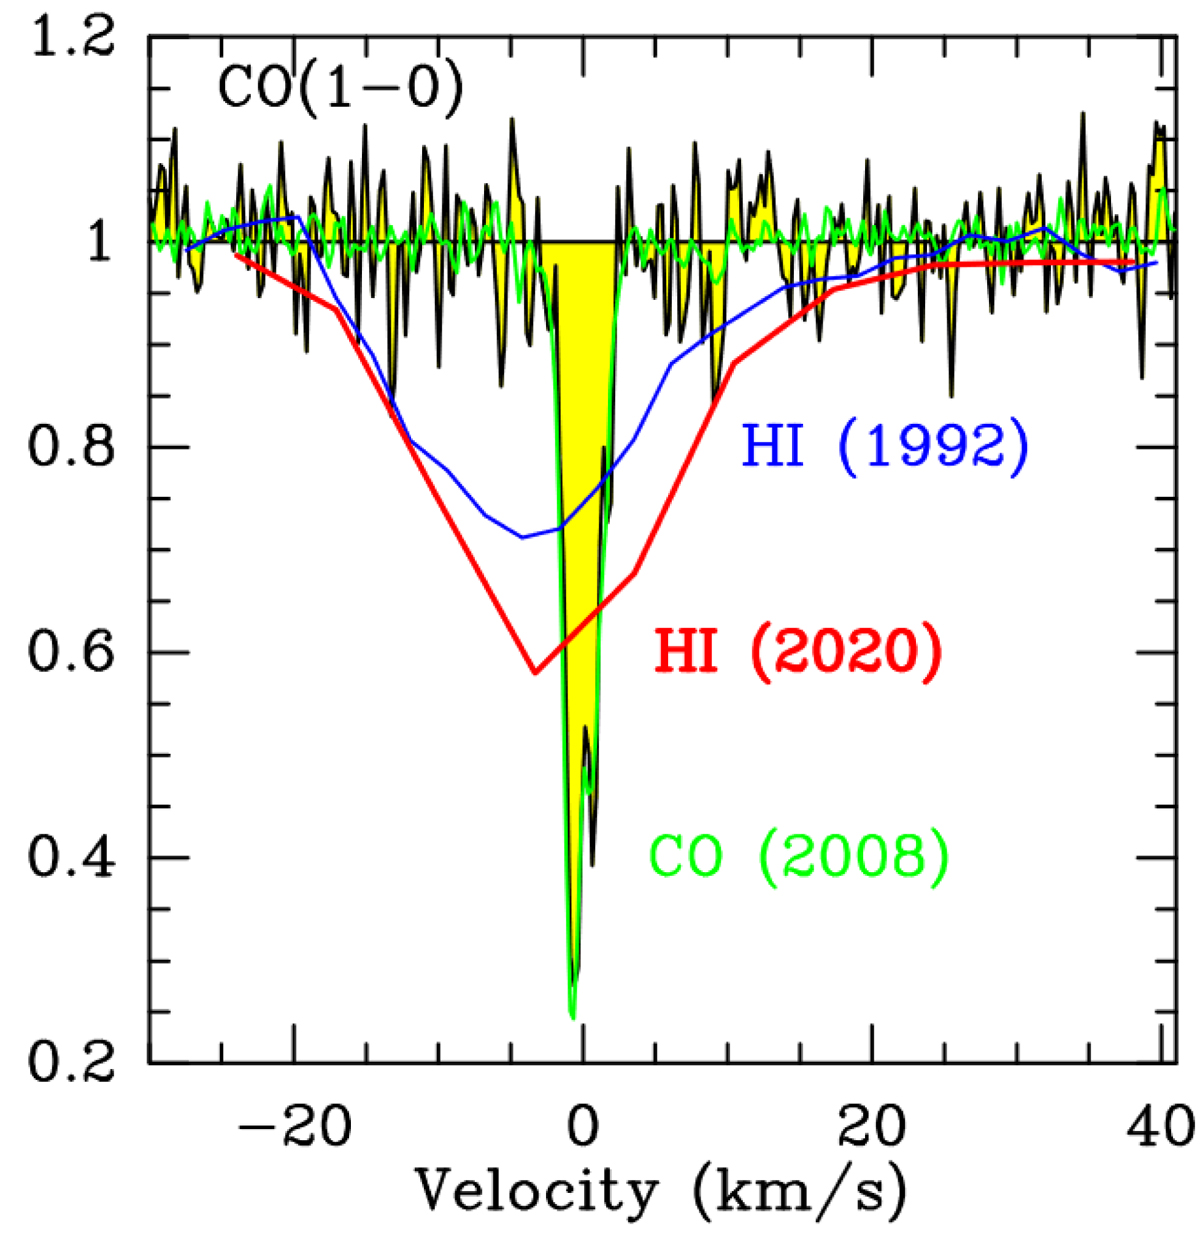
Fig. 5.
Download original image
Comparison between the CO(1–0) and H I lines. All spectra are normalized to their respective continuum. The blue curve is the H I absorption, observed in 1992 with the VLA by Carilli et al. (1992) with channels 2.57 km s−1, and the red curve is from this work (H I spectrum obtained in 2020 with 6 km s−1 channels). Superposed on the CO(1–0) spectrum observed in 1996 (black) from Wiklind & Combes (1997) is a CO(1–0) spectrum (green) obtained with the Institut de Radioastronomie Millimétrique (IRAM) interferometer in 2008, showing no variation.
Current usage metrics show cumulative count of Article Views (full-text article views including HTML views, PDF and ePub downloads, according to the available data) and Abstracts Views on Vision4Press platform.
Data correspond to usage on the plateform after 2015. The current usage metrics is available 48-96 hours after online publication and is updated daily on week days.
Initial download of the metrics may take a while.