Fig. 6.
Download original image
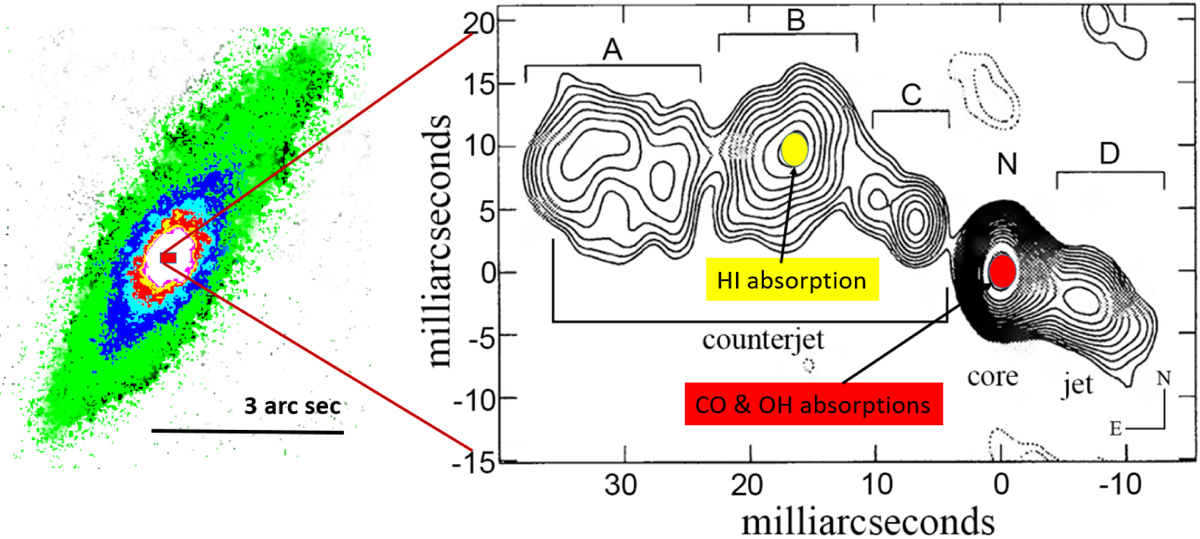
Schematic view of the atomic and molecular absorptions. The HST legacy archive image of the absorbing galaxy in H-band (F160W) is plotted on the left, and the 5 GHz VLBI image from Perlman et al. (1996) showing the jet (west) and counterjet (east) is on the right. The contours are spaced by a factor of ![]() in brightness. The component N is the nucleus or radio core. The counterjet components are indicated by A, B, and C. The HI absorption is centered in B, and the molecular components in N. The jet structure is aligned on the minor axis of the galaxy.
in brightness. The component N is the nucleus or radio core. The counterjet components are indicated by A, B, and C. The HI absorption is centered in B, and the molecular components in N. The jet structure is aligned on the minor axis of the galaxy.
Current usage metrics show cumulative count of Article Views (full-text article views including HTML views, PDF and ePub downloads, according to the available data) and Abstracts Views on Vision4Press platform.
Data correspond to usage on the plateform after 2015. The current usage metrics is available 48-96 hours after online publication and is updated daily on week days.
Initial download of the metrics may take a while.