Fig. 4.
Download original image
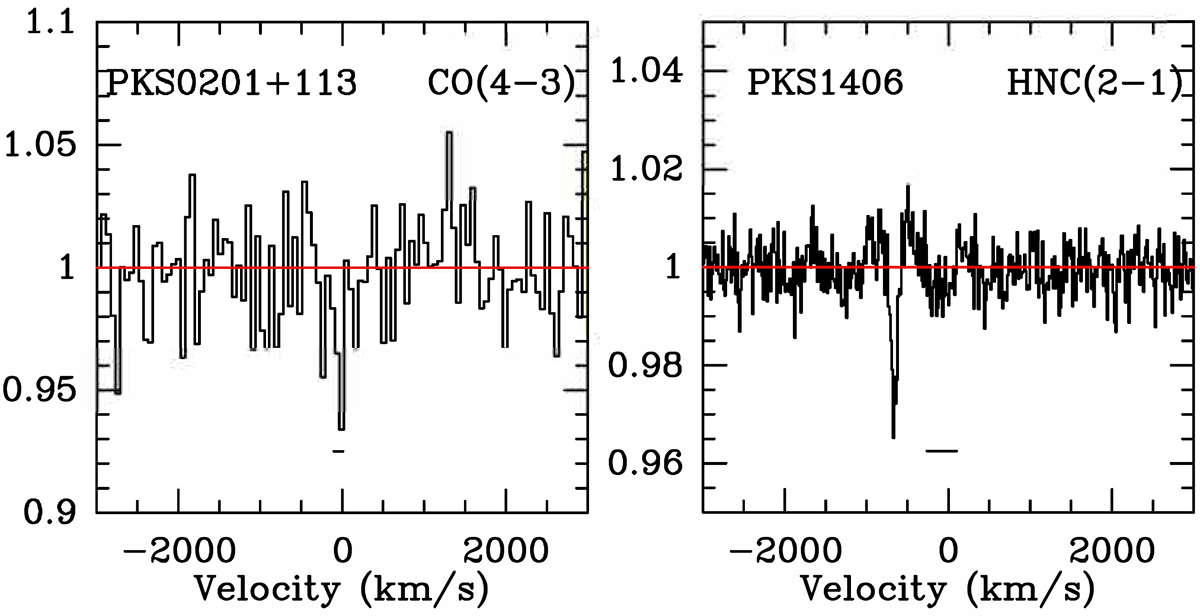
Absorption features observed with the IRAM-30 m toward two of the intervening targets PKS0201+113 in CO(4–3) on the left, and PKS1406−076 in HNC(2–1) on the right. The detection toward PKS0201+113 is only tentative. The spectra have been normalized to their continuum flux densities of 0.22 and 1.13 Jy, respectively. The zero on the velocity scale corresponds to the peak of H I 21 cm absorption (zabs in Table 1). The velocity range over which H I absorption is detected is indicated by a horizontal bar at the bottom of each panel. For PKS0201+113, the H2 absorption peak (−25 km s−1) and the velocity range over which the 21 cm (−100, 10) km s−1 and the [CII]* (−80, 0) km s−1 are detected are reasonably consistent with the CO absorption (see text for details).
Current usage metrics show cumulative count of Article Views (full-text article views including HTML views, PDF and ePub downloads, according to the available data) and Abstracts Views on Vision4Press platform.
Data correspond to usage on the plateform after 2015. The current usage metrics is available 48-96 hours after online publication and is updated daily on week days.
Initial download of the metrics may take a while.