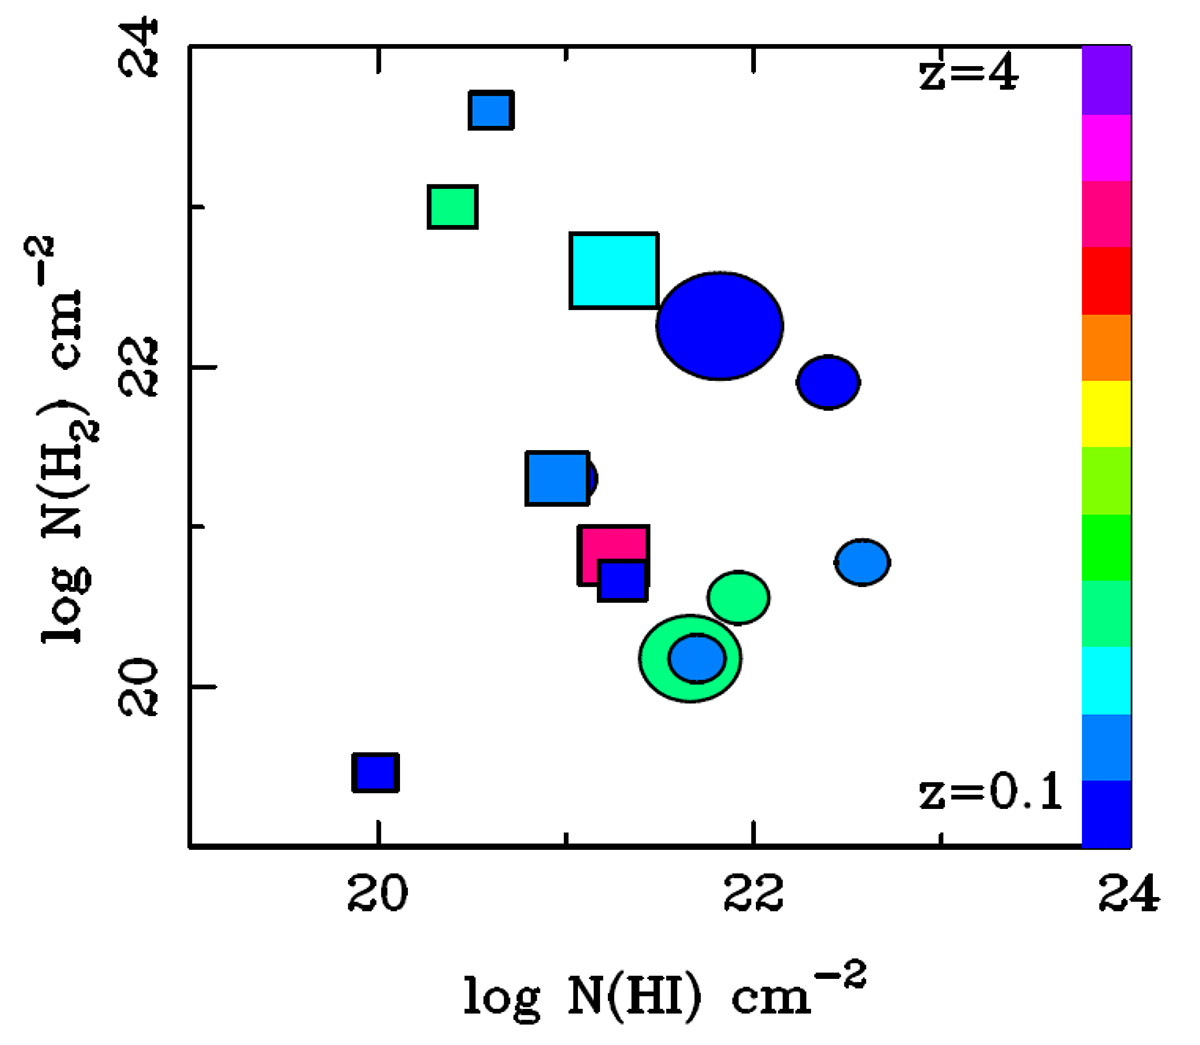
Fig. 9.
Download original image
Comparison between H2 and H I (21 cm) column densities for the known molecular-absorption-line systems at high-redshift. Ts = 1000 K (100 K) is adopted for associated (intervening) systems shown as circles (squares). The color of the symbols represents the redshift, as indicated by the color bar on the right, and the size of the symbol traces the velocity extent of the absorption averaged over the H I and H2 components.
Current usage metrics show cumulative count of Article Views (full-text article views including HTML views, PDF and ePub downloads, according to the available data) and Abstracts Views on Vision4Press platform.
Data correspond to usage on the plateform after 2015. The current usage metrics is available 48-96 hours after online publication and is updated daily on week days.
Initial download of the metrics may take a while.