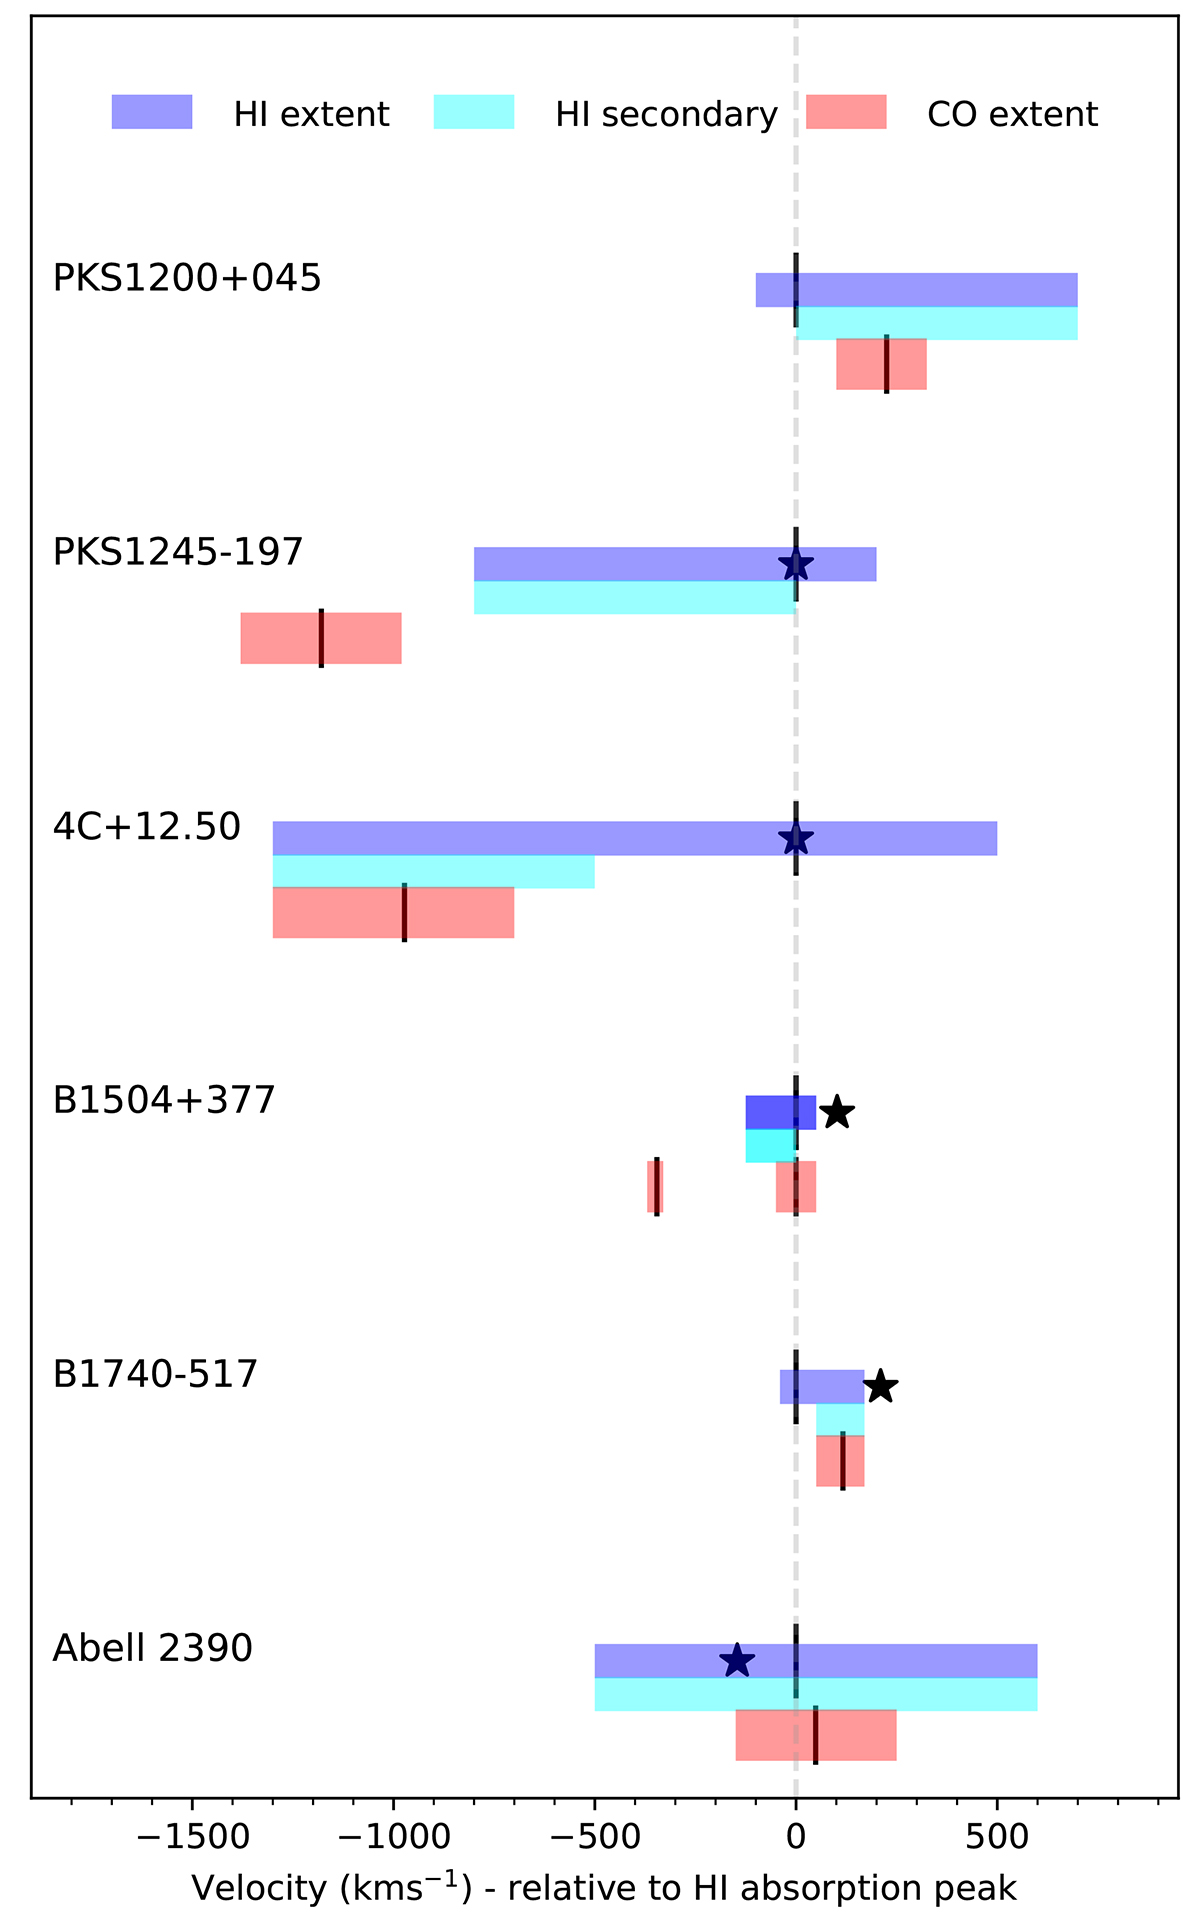
Fig. 10.
Download original image
Velocity offsets of H I 21 cm and CO absorption lines. The zero of the velocity scale corresponds to z21. For H I, both the extent of the full and secondary absorption are shown. The vertical ticks mark the location of H I and CO absorption peaks, and the systemic velocity – except for PKS 1200+045 – based on optical emission lines is shown with a star ⋆.
Current usage metrics show cumulative count of Article Views (full-text article views including HTML views, PDF and ePub downloads, according to the available data) and Abstracts Views on Vision4Press platform.
Data correspond to usage on the plateform after 2015. The current usage metrics is available 48-96 hours after online publication and is updated daily on week days.
Initial download of the metrics may take a while.