| Issue |
A&A
Volume 683, March 2024
|
|
|---|---|---|
| Article Number | A101 | |
| Number of page(s) | 10 | |
| Section | Stellar structure and evolution | |
| DOI | https://doi.org/10.1051/0004-6361/202348344 | |
| Published online | 11 March 2024 | |
Exsolution process in white dwarf stars
1
Departament de Física, Universitat Politècnica de Catalunya, c/Esteve Terrades 5, 08860 Castelldefels, Spain
e-mail: This email address is being protected from spambots. You need JavaScript enabled to view it.
2
Ioffe Institute, Politekhnicheskaya 26, 194021 Saint Petersburg, Russia
3
Institute for Space Studies of Catalonia, c/Gran Capità 2–4, Edif. Nexus 104, 08034 Barcelona, Spain
Received:
21
October
2023
Accepted:
1
December
2023
Abstract
Context. White dwarf stars are considered to be suitable cosmic laboratories for studying the physics of dense plasma. Furthermore, the use of white dwarf stars as cosmic clocks to date stellar populations and main sequence companions demands an appropriate understanding of the physics of white dwarfs in order to provide precise ages for these stars.
Aims. We aim to study exsolution in the interior of white dwarf stars, a process in which a crystallized ionic binary mixture separates into two solid solutions with different fractions of the constituents. Depending on the composition of the parent solid mixture, this process can release or absorb heat, thus leading to a delay or a speed-up of white dwarf cooling.
Methods. Relying on accurate phase diagrams for exsolution, we modeled this process in hydrogen(H)-rich white dwarfs with both carbon–oxygen (CO) and oxygen–neon (ONe) core composition, with masses ranging from 0.53 to 1.29 M⊙ and from 1.10 to 1.29 M⊙, respectively.
Results. Exsolution is a slow process that takes place at low luminosities (log(L/L⊙)≲ − 2.75) and effective temperatures (Teff ≲ 18 000 K) in white dwarfs. We find that exsolution begins at brighter luminosities in CO than in ONe white dwarfs of the same mass. Massive white dwarfs undergo exsolution at brighter luminosities than their lower-mass counterparts. The net effect of exsolution on white dwarf cooling times depends on the stellar mass and the exact chemical profile. For standard core chemical profiles and preferred assumptions regarding miscibility gap microphysics, the cooling delay can be as large as ∼0.35 Gyr at log(L/L⊙)∼ − 5. We neglect any chemical redistribution possibly associated with this process, which could lead to a further cooling delay. Although the chemical redistribution is known to accompany exsolution in binary solid mixtures on Earth, given the solid state of the matter, it is hard to model in a reliable way, and its effect may be postponed until very low luminosities.
Conclusions. Exsolution has a marginal effect on white dwarf cooling times and, accordingly, we find no white dwarf branches associated with it on the Gaia color–magnitude diagram. However, exsolution in massive white dwarfs can alter the faint end of the white dwarf luminosity function, thus impacting white dwarf cosmochronology.
Key words: dense matter / stars: evolution / stars: interiors / white dwarfs
© The Authors 2024
 Open Access article, published by EDP Sciences, under the terms of the Creative Commons Attribution License (https://creativecommons.org/licenses/by/4.0), which permits unrestricted use, distribution, and reproduction in any medium, provided the original work is properly cited.
This article is published in open access under the Subscribe to Open model. This email address is being protected from spambots. You need JavaScript enabled to view it. to support open access publication.
1. Introduction
White dwarf stars are the most common stellar remnants, as more than 95% of main sequence stars end their lives as white dwarfs. These old and numerous objects therefore provide valuable information on the stellar evolution theory, the final states of planetary systems, the structure and evolution of our Galaxy, and the properties of stellar matter under extreme conditions – see for example, the reviews of Fontaine & Brassard (2008), Winget & Kepler (2008), Althaus et al. (2010a), García-Berro & Oswalt (2016), Córsico et al. (2019), and Isern et al. (2022). Indeed, white dwarfs can be used to infer the star formation rate, the initial mass function, the initial-to-final-mass relation, the age–velocity dispersion relation, and the chemical evolution in the solar neighborhood (e.g., Rebassa-Mansergas et al. 2021; Raddi et al. 2022).
Furthermore, nuclear reactions have ceased in white dwarf cores and therefore these stars undergo a slow cooling process that lasts for several billion years (Gyr). The use of accurate evolutionary sequences based on a proper understanding of the physics involved in the cooling of white dwarfs allows the ages of individual white dwarfs to be determined with high precision. These objects have therefore become reliable cosmochronometers with which to date stellar populations and main sequence companions. In particular, the white dwarf population in open and globular clusters can provide age estimates independent of the ages determined using the traditional main sequence turn-off method. For instance, Bellini et al. (2010), Bedin et al. (2010, 2015), and Griggio et al. (2023) studied the white dwarf members to determine the age of the young open clusters, M 67, NGC 2158, NGC 6819, and M 37, respectively, and Hansen et al. (2002, Bedin et al. (2009), Bellini et al. (2013), Torres et al. (2015) employed this method to date the globular clusters M 4, ω Centauri, and NGC 6397. Furthermore, García-Berro et al. (2010) determined the age of the old, metal-rich open cluster NGC 6791 using the white dwarf cooling sequence, thus solving a long-standing problem regarding a discrepancy between the ages of the main sequence and white dwarf stars in that cluster.
In order to exploit the white dwarf stars in the Galaxy as powerful cosmic clocks, from the theoretical point of view, we need accurate white dwarf evolutionary models that provide precise stellar ages. To fill this theoretical gap, over recent decades, a new generation of precise white dwarf evolutionary models has been calculated using different stellar evolutionary codes (see, e.g., Camisassa et al. 2016; Bédard et al. 2020; Salaris et al. 2022; Bauer 2023). According to Salaris et al. (2013), the uncertainties in the white dwarf cooling times arising from different numerical implementations of the stellar evolution equations nowadays are below 2%, which is lower than the differences arising from the uncertainties in the chemical stratification. To reduce these latter uncertainties, many white dwarf models employ initial chemical profiles resulting from the complete treatment of the progenitor evolution starting on the zero-age main sequence (ZAMS). Then, during the white dwarf phase, the evolution of the chemical profile due to the action of chemical diffusion and convective mixing is followed (Camisassa et al. 2016, 2017, 2019; Althaus et al. 2015, 2021). Furthermore, this new generation of white dwarf models includes all the relevant sources and sinks of energy that govern their evolution. Among these sources, it is important to mention the energy released by sedimentation of neutron-rich species (such as 22Ne) and the energy released during the process of core crystallization, which releases latent heat and gravitational energy due to phase separation of the main chemical components (see Bauer 2023; Camisassa et al. 2022a, for details of the implementation of these energy sources).
Despite significant efforts regarding the modeling, recent observations have questioned the capability of these models to accurately provide precise white dwarf ages, particularly for the most massive white dwarfs. The Gaia space mission has revealed the existence of a pile-up in the color–magnitude diagram, named the Q branch, which coincides with the crystallization process (Gaia Collaboration 2018; Tremblay et al. 2019). However, recent studies have shown that a fraction of the ultramassive white dwarfs (MWD ≳ 1.05 M⊙) should have a strong delay (∼8 Gyr) of their cooling times when passing through the Q branch. This is not compatible with the cooling delays predicted by models that include the energy released by crystallization, even when both the latent heat and the energy released by phase separation are taken into account. This phenomenon is referred to as “the cooling anomaly of ultramassive white dwarfs” and is reflected both in their Gaia kinematic (Cheng et al. 2019) and photometric properties (Camisassa et al. 2021). Although for massive (0.9 M⊙ ≲ MWD ≲ 1.1 M⊙) white dwarfs, Tremblay et al. (2019) claimed that the energy released by crystallization could account for pile-up in the Q branch, the simplified treatment of the energy released during crystallization performed by these authors leaves an open possibility that a “cooling anomaly” could also take place in these stars, albeit probably less prominent than for ultramassive white dwarfs.
On the other hand, on the SDSS footprint, Kilic et al. (2021) found a well-defined ultracool infrared(IR)-faint branch in the white dwarf color–magnitude diagram, which was also later reported by Scholz (2022) as a faint blue white dwarf branch on the Gaia color–magnitude diagram. Bergeron et al. (2022) analyzed these IR-faint white dwarfs using accurate mixed H/He atmospheres and obtained significantly higher effective temperatures and larger stellar masses than previously estimated. Still, these authors found a group of ultramassive white dwarfs in the Debye cooling regime, a rapidly cooling phase where, due to ion quantum effects, the ion contribution to the heat capacity of crystallized matter switches from a nearly temperature-independent regime to dropping as T3 (see Althaus et al. 2007). As mentioned by Bergeron et al. (2022), it is surprising to find a large number of massive IR-faint white dwarfs caught in this rapidly evolving phase. Therefore, we can speculate on the possibility that an unknown energy source may be causing a delay of the cooling times of these stars.
Several studies have proposed alternative energy sources that could alter the white dwarf evolutionary timescales, causing a cooling anomaly in ultramassive white dwarfs (see e.g., Bauer et al. 2020; Horowitz 2020; Caplan et al. 2021, 2023). Among these studies, the most promising solutions invoke 22Ne distillation (Blouin et al. 2021) and 22Ne sedimentation processes (Camisassa et al. 2021) occurring in ultramassive white dwarfs with CO cores. All attempts to reproduce the necessary cooling delay in ultramassive white dwarfs with ONe cores have failed, and this is particularly interesting because, to date, there is no clear evidence that ultramassive white dwarfs harbor CO or ONe cores (see e.g., Camisassa et al. 2022b, for a thorough discussion).
In two recent papers, Baiko (2022, 2023) studied the phase diagrams for crystallization of fully ionized binary ionic mixtures typical of white dwarf interior and found a lower-temperature solid-solid structure never before reported in the astrophysical literature. Instead of a single stable solid solution, this author obtained an extensive unstable domain, where a mechanical mixture of two solids is thermodynamically preferable. Such regions are called miscibility gaps and are well-known in terrestrial materials (e.g., Gordon 1968). The miscibility gaps in azeotropic fully ionized binary mixtures (such as CO or ONe) were demonstrated to arise naturally (with a decrease in the charge ratio) from solid–solid regions of eutectic phase diagrams characteristic of mixtures of more different constituents (e.g., CNe, CMg, or OSi).
After crystallization takes place, white dwarf matter cools down as a single stable solid solution until the temperature reaches the miscibility gap. Then, exsolution begins to take place, whereby a new solid solution nucleates from the original one. The composition of the new solution is determined by the phase diagram. With further temperature decrease, the fraction of the parent solution decreases, whereas the fraction of the new one increases. By the end of the process (at T = 0), the original solid is separated in two solid phases, which, for the fully ionized binary ionic mixtures under consideration, have pure ionic compositions.
The exsolution process can either release or absorb energy depending on the initial composition of the solid, and therefore can slow down or accelerate white dwarf cooling. In this paper, we study the exsolution process taking place in the interior of both CO-core and ONe-core white dwarfs. To that end, we incorporated the exsolution process consistently into the LPCODE stellar evolutionary code (Althaus et al. 2005). The energy released by exsolution is coupled to the luminosity equation at each time step. Thus, we calculated, for the first time, white dwarf evolutionary models that include the exsolution process and provide realistic cooling times for this process. These models cover a mass range from 0.53 to 1.29 M⊙. Furthermore, we analyzed actual observational samples to identify possible white dwarf candidates in which the exsolution process should be occurring.
Finally, let us note that, with further improvements to observational capabilities (e.g., the recent commissioning of JWST), we anticipate a steady flow of new and/or more detailed information on the structure of the white dwarf color–magnitude diagram at low luminosities. This will lead to further update of theoretical research and numerical simulations of various physical processes at later stages of white dwarf evolution.
2. Methods
2.1. Input physics
The white dwarf evolutionary models presented in this study were computed using the stellar evolutionary code LPCODE (see Althaus et al. 2005, for details). This code has undergone rigorous testing against other evolutionary codes, covering different phases of stellar evolution, including the red giant phase (Silva Aguirre et al. 2020; Christensen-Dalsgaard et al. 2020) and the white dwarf phase (Salaris et al. 2013). Furthermore, LPCODE has been extensively applied in the study of diverse aspects of low-mass stars (see Althaus et al. 2010b; Renedo et al. 2010; Miller Bertolami 2016; Camisassa et al. 2017, and references therein).
Here, we provide a brief overview of the key input physics used in LPCODE for modeling the white dwarf regime. For the low-density regime, we adopt the equation of state from Magni & Mazzitelli (1979), while for the high-density regime, we rely on the equation of state developed by Segretain et al. (1994). Radiative opacities are taken from the OPAL project (Iglesias & Rogers 1996), except for the low-temperature regime where LPCODE incorporates molecular radiative opacities that account for varying carbon-to-oxygen ratios (Ferguson et al. 2005). Conductive opacities are taken from Cassisi et al. (2007). To account for neutrino emission rates, including pair, photo, and bremsstrahlung processes, we adopt the rates from Itoh et al. (1996), whereas for plasma processes, we follow the prescription from Haft et al. (1994). External boundary conditions for our evolving models are determined using nongray model atmospheres sourced from Rohrmann et al. (2012). LPCODE also considers variations in chemical abundances arising from element diffusion, including gravitational settling, chemical diffusion, and thermal diffusion processes. To model the crystallization process, we employed the phase diagram of Horowitz et al. (2010) for CO mixture and a phase diagram for ONe mixture based on the approach of Medin & Cumming (2010). To facilitate a comparison with previous work, we do not include the latent heat of crystallization values calculated by Baiko (2023), but use a fixed value of 0.77 kBT per ion instead. We do not expect this approximation to qualitatively affect our conclusions.
2.2. Initial white dwarf models
We modeled H-rich CO-core white dwarfs with masses of 0.53, 0.58, 0.66, 0.83, 0.95, 1.1, 1.16, 1.23, and 1.29 M⊙ and H-rich ONe-core ultramassive white dwarfs with masses of 1.1, 1.16, 1.23, and 1.29 M⊙. For each mass, we calculated four evolutionary sequences, one in which both processes – crystallization and exsolution – are taken into account, two in which only one process is considered, and the last one in which both processes are disregarded1. A total of 52 evolutionary sequences were calculated and we neglect the 22Ne sedimentation process in all of them.
The initial chemical profiles and the thermo-mechanic structure of the CO-core models with 0.53, 0.58, 0.66, and 0.83 M⊙ are taken from Miller Bertolami (2016). These are the result of the full progenitor evolution from the ZAMS all the way to the white dwarf phase. For the CO-core 0.95 M⊙ evolutionary models, we rescaled the structure of the 0.83 M⊙ model. The ultramassive CO-core white dwarf models, that is, models with 1.1, 1.16, 1.23, and 1.29 M⊙, employ the initial chemical profile that results from the full progenitor evolution of the model stars computed in Althaus et al. (2021) with the Monash-Mount Stromlo code MONSTAR (Wood & Faulkner 1987; Frost & Lattanzio 1996; Campbell & Lattanzio 2008; Gil-Pons et al. 2013, 2018). In this case, the mass-loss rates of Vassiliadis & Wood (1993) were reduced along the early asymptotic giant branch (AGB) and the thermally pulsing AGB (see Camisassa et al. 2022a, for details of these models). The initial chemical profiles in the ONe-core models are the same as in Camisassa et al. (2019), which result from the progenitor evolution calculated through the superasymptotic giant branch in Siess (2010). We note that each initial white dwarf model has a different chemical profile, leading to different energy releases from the exsolution process.
In our initial chemical profiles, there are some Rayleigh-Taylor-unstable regions, where the mean molecular weight is inverted. These regions are expected to rapidly mix, and therefore we performed this mixing at the beginning of the white dwarf phase assuming it to be instantaneous. During the white dwarf evolution, the chemical abundances change due to element diffusion. Gravitational settling purifies the envelopes of our models, leaving pure-H envelopes, whereas chemical and thermal diffusion smoothes the chemical interfaces. Finally, the crystallization process also alters the chemical profile as a result of the phase separation.
2.3. The exsolution process
After crystallization, the dense solid matter in the white dwarf interior will undergo the exsolution process, in which the two main components of matter gradually separate. We modeled this process, following the phase diagrams for binary mixtures of CO and ONe from Baiko (2023, Fig. 1). The phase diagram for the exsolution process in an ONe mixture is reproduced in the upper panel of Fig. 1. We omit the CO phase diagram description because it exhibits a similar behavior. The x-axis in Fig. 1 is the Ne numerical abundance and the y-axis in the upper panel of this figure is the temperature in units of the crystallization temperature of the lighter ion (i.e. oxygen),  . In this case, the atomic number is ZO = 8, kB is the Boltzmann constant, e is the electron charge, ae = (4πne/3)−1/3 is the mean electron spacing, ne is the electron density, and the Coulomb coupling parameter Γm = 175.6.
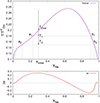 |
Fig. 1. Phase diagram (upper panel) and entropy excess (lower panel) for the exsolution process in a binary ONe mixture taken from Baiko (2023). Upper panel: the purple line is the solvus and the region below it is the miscibility gap. A solid solution with an initial Ne numerical abundance Xinitial will begin exsolution at a temperature TExol determined by the solvus. By the time the temperature drops to the value T1, the solid will be decomposed into two mixtures, one depleted in Ne, with a Ne abundance XNe = a1, and the other enriched in Ne, with a Ne abundance XNe = b1. By the time the temperature drops to the value T2, the two solids will have respective abundances of a2 and b2. The exsolution process is completed at temperature T = 0, where the solid is separated into two components, pure O and pure Ne. Lower panel: excess entropy of exsolution as a function of Ne numerical abundance in a solid undergoing decomposition. |
The temperature of crystallized matter keeps dropping until it reaches the solvus, which is the purple line in the upper panel of Fig. 1 that delimits the miscibility gap. Any solution inside the miscibility gap is thermodynamically unstable. Therefore, the mixture will evolve through the solvus, separating into two mixtures with different O–Ne proportions determined by the lever rule. For instance, an ONe solid mixture with initial Ne numerical abundance Xinitial will begin the exsolution at a temperature TExol determined by the solvus. When the temperature decreases to a value T1, the mixture is going to be divided into two mixtures with different O–Ne proportions: one on the left side of the miscibility gap with Ne numerical abundance a1 and the other on the right side of the gap with Ne numerical abundance b1. When the temperature drops to a value T2, the Ne-depleted solution will have Ne abundance a2 and the Ne-enriched solution will have Ne abundance b2. The exsolution will continue until T = 0, where O and Ne will be completely separated with afinal = 0 and bfinal = 1.
Let us define two more quantities: N1, which is the number of ions on the left side of the gap (i.e. in the Ne-depleted solution) and M1, which is the number of ions on the right side of the gap (i.e. in the Ne-enriched solution). The condition N1 + M1 = NTOT, where NTOT is the total number of ions in the initial mixture, must be fulfilled at all times. The values of Ni and Mi at a timestep i are determined by:
 (1)
(1)
 (2)
(2)
The white dwarf core is not a binary mixture. For the case of CO-core white dwarfs, the total mass fraction of C plus O in the core is ≳95%, whereas for ONe-core white dwarfs, the total mass fraction of O plus Ne is ≳85%. We neglect exsolution in the white dwarf envelope, where these fractions monotonically decrease as a function of the stellar radius (or inner mass fraction). For CO-core white dwarfs, if the O abundance is XO, we consider the carbon abundance to be XC = 1 − XO. That is, for modeling exsolution, we consider all other elements that are neither C nor O as C. Similarly, for ONe-core white dwarfs, if the Ne abundance is XNe, we consider the O abundance to be XO = 1 − XNe.
The exsolution is a slow process that lasts for billions of years (formally speaking, it lasts until T = 0) and can release or absorb heat. In each evolutionary time-step, we add this exsolution heat term to the luminosity equation in the stellar evolutionary code LPCODE (Eq. (1) in Camisassa et al. 2022a). The exsolution heat has been taken from the entropy change calculated by Baiko (2023, Fig. 1c). This entropy excess is shown by a red line in the lower panel of Fig. 1 for a binary mixture of O-Ne. In the case where the solid begins exsolution on the left side of the miscibility gap, the heat at time step 2 is dictated by the change from M1 to M2:
 (3)
(3)
where Δs is the specific entropy change evaluated at a1. In the case where the solid begins exsolution on the right side of the miscibility gap, the heat at time step 2 will be
 (4)
(4)
where Δs is evaluated at b1.
We note that, in this latter case, Δs is negative and therefore the process absorbs energy, leading to a cooling acceleration. The condition for reaching the solvus on the left (right) side of the miscibility gap is that the Ne abundance Xinitial is lower (higher) than ≈0.64. Therefore, those regions where Xinitial > 0.64 will absorb energy and those regions where Xinitial < 0.64 will release energy. In all regions of all our ONe white dwarf models, Xinitial < 0.64. For CO mixtures, the solvus maximum is at the O abundance ≈0.66 and, in some regions of our CO models, Xinitial can be larger than 0.66, which leads to the appearance of an energy sink.
It is possible that a chemical redistribution in which the heavier solution sinks towards the center of the star occurs upon exsolution, despite the fact that the matter is in a solid phase. On Earth, exsolution in the solid phase results in the formation of lamellar structures that can range from microscopic in size to visible to the naked eye. How this translates into a white dwarf is an open question. In the present study, we simply neglect any ensuing chemical redistribution and include only the exsolution heat release due to the difference in entropy.
There are other theoretical uncertainties in the description of the exsolution process. In this paper, we rely on binary mixture thermodynamics derived from the linear-mixing formalism with corrections to linear-mixing energies reported by Ogata et al. (1993). In principle, the actual miscibility gaps can be more or less prominent than we have here, that is, if another parametrization of these corrections is used, if the formation of an ordered binary crystal plays any role, or if the spinodal curve has to be used in place of the solvus (see Baiko 2022, for discussion). The entropy difference would then have to be recalculated accordingly.
3. Results
3.1. General features of the cooling tracks
The main contributions to the white dwarf luminosity as a function of the logarithm of the white dwarf cooling time for our 1.16 M⊙ ONe-core model are shown in Fig. 2. We define the white dwarf cooling time as the time elapsed since the star reached the maximum effective temperature when entering the white dwarf phase. We can see that, throughout the entire white dwarf phase, the gravothermal energy dominates the white dwarf energetics. Also, at early stages of the white dwarf cooling sequence, the energy lost by neutrino emission is important and can be of the order of the gravothermal energy. At log(tcooling) ∼ 8.5, when the logarithm of the stellar luminosity is log(L/L⊙)∼ − 2, the crystallization process starts in the center of the white dwarf, releasing latent heat and gravitational energy due to the ONe phase separation. We note that, in this model, the energy released as latent heat is about four times greater than the energy released by phase separation. The crystallization in this ONe model will last for ∼1.7 × 10⁹ yr. Finally, when log(tcooling) ∼ 9.4 and the logarithm of the stellar luminosity is log(L/L⊙)∼ − 3.75 (i.e., ∼55 times lower than at crystallization onset), the exsolution process starts in the center of this white dwarf model. The release of the major fraction of the exsolution heat will be occurring over ∼2.8 × 10⁹ yr. The energy released as exsolution heat is about two orders of magnitude lower than the latent heat released by crystallization. Nevertheless, as the stellar luminosity at exsolution is also much lower, the effect of exsolution on the cooling times is just some 30% smaller than that of crystallization.
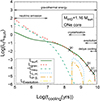 |
Fig. 2. Main contributions to the white dwarf luminosity (solid dark-green line) in terms of the cooling age (defined as zero when the star reaches the maximum effective temperature) for the 1.16 M⊙ ONe model including crystallization and exsolution processes. The dashed red line displays the gravothermal energy release, the dashed green line indicates the energy lost by neutrino emission, the dotted blue line is the latent heat of crystallization, the dot-dashed orange line shows the energy released due to the ONe phase separation induced by crystallization, and the dot-dashed yellow line displays the exsolution heat. The arrows indicate the times when these physical processes are acting. The crosses indicate the moments at which we plot the chemical profiles in Fig. 3. |
In Fig. 3, we show the chemical profiles and the heat released by exsolution in our 1.16 M⊙ ONe-core model at four different epochs: (a) before crystallization onset, (b) when ∼95% of the white dwarf mass has crystallized, (c) when ∼50% of the white dwarf mass has begun exsolution, and (d) when ∼80% of the white dwarf mass has begun exsolution. These epochs are marked in Fig. 2 by crosses. Before the onset of crystallization, the chemical profile of the star is that resulting from the progenitor evolution calculated by Siess (2010) and rehomogenization due to Rayleigh-Taylor instabilities (see Camisassa et al. 2019). Due to the shape of the phase diagram, after crystallization, the inner regions of the core are additionally enriched in Ne (blue dotted line) and depleted in O (green dashed line), whereas the outer regions are enriched in O and depleted in Ne. This is the chemical profile that will dictate the exsolution process (in models without crystallization, the exsolution will commence with the chemical profile pre-crystallization).
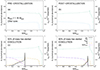 |
Fig. 3. Chemical profiles and exsolution heat release for our 1.16 M⊙ ONe-core model including crystallization and exsolution at different stages of the white dwarf evolution. The dashed green (dotted blue) line displays the 16O (20Ne) numerical abundance, the solid black line depicts the energy released by the exsolution process in units of 10−5 erg gr−1 s−1, the dot-dashed orange line displays the Ne numerical abundance ai of the Ne-depleted mixture, and the dot-dot-dashed purple line depicts the fraction of ions in the Ne-enriched mixture Mi/NTOT (see Sect. 2.3 for details). Panels a–d show the moments before the crystallization onset (Teff = 25 700 K), after 95% of the mass has crystallized (Teff = 8900 K), when 50% of the white dwarf mass has begun exsolution (Teff = 6400 K), and when 80% of the white dwarf mass has begun exsolution (Teff = 5300 K), respectively. These epochs are marked in Fig. 2 by crosses. |
In this model, when the temperature reaches the solvus, it does so always on the left side of the miscibility gap, because XNe is lower than 0.64 everywhere. The exsolution heat is therefore always positive. In panel c, the center of the white dwarf (Mr/M⊙ = 0) has almost completed exsolution, and therefore the heat being released is already zero in this region. By contrast, the layers with Mr/M⊙ ≈ 0.6 are just starting this process and therefore the exsolution heat there is at a maximum. The regions where 0.05 ≲ Mr/M⊙ ≲ 0.6 are undergoing the exsolution and the regions where Mr/M⊙ ≳ 0.6 have not started it yet. After ∼1.8 Gyr, in panel d, the regions where Mr/M⊙ ≲ 0.7 have almost finished exsolution, while the regions with 0.7 ≲ Mr/M⊙ ≲ 1 are still undergoing the exsolution process.
All other ONe models exhibit a similar behavior. The solvus is reached on the left side of the miscibility gap in all the regions of the white dwarf and the exsolution heat is always positive. However, in certain regions of some CO-core white dwarf models, the solvus is reached on the right side of the miscibility gap. Such is the case for the inner regions of our CO-core 0.53, 0.58, 0.66, 1.1, 1.16, 1.23, and 1.29 M⊙ models, where the exsolution heat is absorbed.
3.2. Effect on the white dwarf cooling times
The main properties of the 52 white dwarf evolutionary models calculated in our study are summarized in Table 1. For each white dwarf mass, we list the logarithm of the stellar luminosity, log(L/L⊙), and the effective temperature Teff(K) at the crystallization and exsolution onsets. We also list, for each mass, the absolute and relative cooling time delays, Δtcool and  , caused by exsolution alone, crystallization alone, and both processes combined, all with respect to the cooling sequence that disregards both processes. The relative cooling delays are shown in parentheses and
  is the cooling time of the sequence that disregards both processes.
Effective temperature and stellar luminosity at crystallization and exsolution onsets for each of the white dwarf models presented in this paper.
In concordance with crystallization, exsolution begins at brighter luminosities and higher effective temperatures in more massive white dwarfs (which have higher central densities). On the other hand, although ONe white dwarfs crystallize at brighter luminosities (and higher effective temperatures) than CO white dwarfs of the same mass, the opposite is true for the exsolution, which occurs at fainter luminosities in ONe white dwarfs. This can be understood from the phase diagrams (see Fig. 1a in Baiko 2023), which predict a higher temperature for exsolution in a CO mixture than in an ONe mixture, relative to the melting temperature.
The effect of exsolution on the cooling times of selected white dwarf models can be seen in Figs. 4–6. In the left panels of these figures, we show the logarithm of the stellar luminosity in solar units versus white dwarf cooling times for the sequences that disregard crystallization and exsolution processes (purple line), include exsolution but disregard crystallization (blue line), include crystallization but disregard exsolution (green line), or include both processes (orange line). The cooling delays of these latter three sequences with respect to the sequence that disregards both crystallization and exsolution are plotted in the middle panels. We note that these cooling delays when log(L/L⊙) = −5 are listed in Cols. 6–8 of Table 1, respectively. Finally, in the right panels, we show the percentage of crystallized mass and the percentage of mass that has begun exsolution as a function of the stellar luminosity.
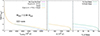 |
Fig. 4. Impact of crystallization (including latent heat and phase separation) and exsolution processes on the cooling times of a 0.58 M⊙ CO-core white dwarf model. The left panel shows the luminosity versus cooling time for the sequence that disregards crystallization and exsolution (purple line), includes crystallization but disregards exsolution (green line), includes exsolution but disregards crystallization (blue line), and includes both processes (orange line). The middle panel shows the cooling delay of the last three sequences with respect to the first one. The right panel shows the percentage of crystallized mass (green line) and the percentage of mass that has begun exsolution (blue line) versus the stellar luminosity. |
In Fig. 4, we can see that, in the 0.58 M⊙ model, while crystallization (both latent heat and phase separation) produces a delay of ∼1.7 Gyr at log(L/L⊙) = −5, exsolution produces a marginal delay of ∼0.1 Gyr. Exsolution begins at very faint luminosities in a 0.58 M⊙ star. Indeed, at log(L/L⊙) = −5, although 75% of the white dwarf mass has started the exsolution, less than 10% of the mass has released most of its exsolution heat and therefore a lot of this heat is yet to be generated. More generally, incomplete heat production by log(L/L⊙) = −5 in low-mass stars is responsible for the initial growth of time delays with mass increase in Cols. 6 and 7 of Table 1.
More massive white dwarfs undergo crystallization and exsolution at higher luminosities, and such is the case for the 1.16 M⊙ CO model shown in Fig. 5. In this model, while the time delay caused by crystallization is ∼1 Gyr at log(L/L⊙) = −5, ∼90% of the white dwarf mass has already effectively completed exsolution by this luminosity. This adds another ∼0.25 Gyr to the time delay.
It is interesting to note that, in the two CO models above, the oxygen abundance in the liquid phase is less than 0.66, but, upon crystallization and redistribution, XO increases above this value in some inner core layers. Thus, these latter layers become a heat sink, which partially offsets the exsolution heat released by the outer layers of the core. The net effect on the white dwarf cooling times is a delay, and the difference between the exsolution delays with and without crystallization illustrates the effect of heat absorption.
A peculiar case is represented by the 0.53 M⊙ CO model. In this star, the oxygen abundance slightly exceeds the critical value in the inner ∼0.33 M⊙ even without crystallization, and this whole region becomes a heat sink. The net cooling delay due to exsolution is then a mere 4 million years. However, if crystallization is taken into account, only inner the ∼0.26 M⊙ operates as a heat sink, a noticeably more massive outer region emits heat, and exsolution adds 40 million years to cooling delay due to crystallization.
Finally, in the 1.16 M⊙ ONe-core model (Fig. 6), the time delays induced by crystallization and exsolution are of the same order at log(L/L⊙) = −5, being ∼0.18 and ∼0.13 Gyr, respectively. At such low luminosities, ∼90% of the white dwarf mass has mostly completed exsolution. We note that, in this model, the percentage of mass that has started the exsolution process (blue line, right panel) increases monotonically as evolution proceeds, until it reaches a value of ∼90%, where it stops growing. The reason for this is that, in the outer 10% of the white dwarf mass, C and other elements are abundant and we can no longer consider the approximation of a binary mixture of O-Ne. Therefore, we neglect exsolution in the outer 10% of the white dwarf mass for this model.
Another relevant feature of this model is that the time delay caused by crystallization starts to decrease as a function of luminosity for log(L/L⊙) ≲ −4. Such a “reversal effect” also occurs in the most massive (1.23 and 1.29 M⊙) ONe-core models, where the time delay caused by crystallization can become zero or negative at very low luminosities. This effect was analyzed by Camisassa et al. (2019), who noticed that, at these late stages, more than 99% of the white dwarf mass had crystallized and no more energy was released due to crystallization, but the phase separation induced by crystallization strongly altered both the structure and thermal properties of ultramassive white dwarfs, impacting their cooling rates.
Generally speaking, the exact time delay produced by exsolution depends on the white dwarf mass, composition, and chemical profile left by the progenitor evolution and chemical redistribution upon crystallization. For standard core chemical profiles and preferred assumptions regarding miscibility gap microphysics, this delay can be 0.35 Gyr at most at log(L/L⊙) ∼ −5.
3.3. Searching for observational evidence
In Fig. 7, a Gaia DR3 color–magnitude diagram for the sample of white dwarfs within 100 pc of the Sun is shown along with the IR-faint white dwarfs in the sample from Bergeron et al. (2022) and our white dwarf cooling tracks. We employ the pure H atmosphere models of Koester (2010) to convert our evolutionary models to the Gaia passbands. The IR-faint white dwarfs from Bergeron et al. (2022) are not expected to follow the pure H evolutionary tracks on the Gaia color–magnitude diagram, as their atmospheric composition is not pure H, but a mixture of H and He instead. Blue squares (filled black circles) indicate the crystallization onset and the moment when 80% of the mass has crystallized in our ONe (CO) models. Filled purple squares (filled brown circles) delimit the exsolution regions for ONe (CO) white dwarfs. More precisely, they show the exsolution onset (i.e., the moment when the stellar center reaches the solvus) and the moment when 80% of the mass has begun exsolution.
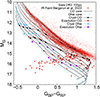 |
Fig. 7. Crystallization and exsolution on the Gaia DR3 color–magnitude diagram. Solid black lines and dot-dashed blue lines are CO and ONe evolutionary sequences, respectively. The masses of the CO (ONe) sequences are, from top to bottom, 0.53, 0.58, 0.66, 0.83, 0.95, 1.1, 1.16, 1.23, and 1.29 (1.1, 1.16, 1.23, and 1.29) M⊙. Filled blue squares (filled black circles) indicate the crystallization onset and the moment when 80% of the white dwarf mass has crystallized for ONe (CO) white dwarfs. Filled purple squares (filled brown circles) show the exsolution onset and the moment when 80% of the white dwarf mass has begun exsolution for ONe (CO) white dwarfs. The white dwarf sample within 100 pc and the IR-faint white dwarfs from Bergeron et al. (2022) are plotted as red dots and filled red circles, respectively. |
As can be observed, there is a pile-up of objects between the CO crystallization onset and the 80% of CO crystallization. This pile-up is the Q branch discussed in Sect. 1. We can see that this branch is compatible with the crystallization regions for both CO and ONe models with H atmospheres.
It is important to remark that exsolution is a slow process; once it begins in a stellar layer, it continues for several evolutionary timescales before the temperature drops down sufficiently (cf. Fig. 1) and the major heat fraction is released (or absorbed). In some of our CO models, the exsolution starts in the center of the star before the outer regions have begun crystallizing. In Fig. 7, we show the moment when matter at the mass coordinate Mr/MWD = 0.8 reaches the solvus, but the inner regions with Mr/MWD < 0.8 are still undergoing the exsolution, and the associated heat there is not zero (cf. Fig. 3d). From a simple inspection, we cannot attribute any structure on the white dwarf color–magnitude diagram to the exsolution process.
In Fig. 8, we show the location of crystallization and exsolution processes on the effective temperature–mass plane, together with the DA white dwarfs within 100 pc from Jiménez-Esteban et al. (2023) and the IR-faint white dwarfs from Bergeron et al. (2022). The crystallization in ONe white dwarfs occurs at higher effective temperatures than the range of this plot. As mentioned in Sect. 3.1, the exsolution takes place at higher effective temperatures in CO than in ONe white dwarfs of the same mass, which is in contrast to the crystallization.
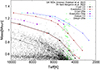 |
Fig. 8. Crystallization and exsolution processes on the mass–effective temperature plane. Solid black lines indicate the crystallization onset and the moment when 80% of the white dwarf mass is crystallized in our CO models. Solid brown (dot-dashed purple) curves display the exsolution onset and the moment when 80% of the white dwarf mass has begun exsolution in CO (ONe) models. Solid blue and cyan lines indicate the transition between the classic and the quantum Debye regime in dense ionic plasma. Black dots are the DA white dwarfs within 100 pc from the Sun (Jiménez-Esteban et al. 2023), while the green crosses are the sample of 105 IR-faint white dwarfs (Bergeron et al. 2022). |
The boundary between classic and quantum Debye regimes at the stellar center is plotted as a blue or cyan curve for CO and ONe models, respectively. This boundary is defined as in Althaus et al. (2007): the temperature at the center T = θD/20, where the Debye temperature is θD = 3.48 × 10³⟨Z/A⟩ρ1/2 K. We can see that the most massive model with the ONe core, with 1.29 M⊙, enters the Debye regime when less than 80% of its mass has begun exsolving. We find that only 7 of the 105 IR-faint white dwarfs analyzed by Bergeron et al. (2022) are in the Debye cooling phase.
The IR-faint white dwarfs with masses MWD/M⊙ ≳ 0.66 should be undergoing the exsolution process. However, the accumulation of IR-faint white dwarfs in a narrow strip around Teff ∼ 4500 K regardless of the mass is hard to explain by a specific physical process in the core because of the vast range of physical conditions that seem to be involved, that is, from incomplete crystallization in low-mass stars to quantum solids in the ultramassive ones.
Overall, we find no signatures associated with the exsolution process on both the Gaia color–magnitude diagram and the effective temperature–mass plane. This is consistent with the marginal effect of the exsolution process on the white dwarf cooling times.
4. Summary and conclusions
After crystallization, the temperature continues to drop and the solid binary ionic mixture in the central regions of a white dwarf reaches the miscibility gap, an unstable domain where a mechanical mixture of two solids is thermodynamically preferable. As soon as the temperature drops below the solvus, the original solid begins nucleating out a new solid solution, whose composition is determined by the phase diagram. As evolution proceeds, the parent mixture continues to decompose until both solutions reach pure compositions. This process is known as exsolution and, depending on the initial composition of the solid, can release or absorb heat, leading to a deceleration or an acceleration of white dwarf cooling. In this paper, we studied the exsolution process occurring in white dwarf stars with CO and ONe cores, H-rich envelopes, and masses ranging from 0.53 to 1.29 M⊙. Although we neglect 22Ne sedimentation, which should lead to further delays in the cooling times, we expect this process to be independent of exsolution and to not affect our main findings.
We find that, similar to crystallization, exsolution occurs at brighter luminosities in more massive white dwarfs due to higher mass densities in their interior. On the other hand, in contrast with crystallization, exsolution occurs at brighter luminosities for CO white dwarfs than for ONe white dwarfs of the same mass. The reason for this can be deduced from the phase diagrams for the exsolution (Baiko 2023), which predict a higher exsolution temperature relative to the melting temperature in CO mixtures. In our CO models, exsolution starts in the center of the star while the outer layers are still crystallizing. We also find that exsolution is slow and produces (or absorbs) noticeable amounts of energy for several gigayears. It can take ∼2.5 Gyr for a stellar layer to complete the exsolution process, in contrast with crystallization, which we assume to be instantaneous in each layer.
The impact of the exsolution process on the white dwarf cooling times depends on the mass and the exact chemical profile of the solid mixture. Indeed, those layers, where the numerical abundance of the heavier component is larger than the critical value, will absorb heat, while layers where the numerical abundance of the heavier component is below this number will release heat. We find that some inner regions of 0.53, 0.58, 0.66, 1.1, 1.16, 1.23, and 1.29 M⊙ CO-core models absorb heat. However, this is counterbalanced with the energy release in the outer layers of these models.
Overall, we can characterize the effect of the exsolution process on the white dwarf cooling times as marginal, with a maximum delay of ∼0.35 Gyr for luminosities down to log(L/L⊙)∼ − 5, standard compositions, and preferred assumptions regarding the miscibility gap microphysics. For ONe white dwarfs, the cooling delay caused by the heat release due to exsolution is of the same order of magnitude as that caused by crystallization, when both latent heat and phase separation are included. For the most massive ONe white dwarfs (M ≳ 1.2 M⊙), the change in stellar radius induced by phase separation produces a “reversal effect” that almost totally eliminates the cooling delay associated with crystallization. In this case, the exsolution cooling delay becomes the dominant effect.
We also plot the location of exsolution and crystallization processes on the Gaia color–magnitude diagram, relying on the atmosphere models of Koester (2010) for pure H composition. We do not find any branch on this diagram associated with the exsolution, which is consistent with the marginal importance of this process for the white dwarf cooling times. Also, we find that the so-called Q branch is consistent with the crystallization for both CO and ONe white dwarfs when a pure H-atmospheric composition is considered.
We compared our models with the IR-faint white dwarfs from Bergeron et al. (2022), finding that these objects with masses of MWD/M⊙ ≳ 0.66 should be undergoing exsolution. We find that only 7 of the 105 IR-faint white dwarfs in this sample are in the Debye cooling regime, where the heat capacity drops due to ion quantum effects and cooling accelerates.
The time delay induced by exsolution in massive white dwarfs might have significant implications for white dwarf cosmochronology. Within a population of white dwarfs, the less massive ones have had less time to evolve to very low luminosities compared to their more massive counterparts. Consequently, the faint end of the white dwarf luminosity function is populated by massive white dwarfs, where exsolution leads to an approximately 0.3 Gyr delay. Therefore, the age estimated based on the cutoff of the white dwarf luminosity function in such populations may be underestimated by approximately 0.3 Gyr.
In this preliminary work, we have not considered a chemical redistribution caused by exsolution, which could also lead to a further delay in white dwarf cooling times. The chemical redistribution is known to accompany exsolution in binary solid mixtures on Earth. However, given the solid state of the white dwarf matter, this effect is hard to model reliably and it may be postponed until very low luminosities. In summary, it would be very hard to prove the exsolution occurrence in white dwarfs with current observational techniques, but the situation may improve in the future.
In sequences which disregard crystallization, we switch off latent heat release and phase separation including element redistribution and gravitational heat release. All the other thermodynamic properties of matter below crystallization temperature remain such as they are in the crystallized phase.
Acknowledgments
We acknowledge the expert referee, Maurizio Salaris, whose comments helped to improve the original version of the manuscript. M.C. acknowledges grant RYC2021-032721-I, funded by MCIN/AEI/10.13039/501100011033 and by the European Union NextGenerationEU/PRTR. This work was partially supported by the AGAUR/Generalitat de Catalunya grant SGR-386/2021 and by the Spanish MINECO grant PID2020-117252GB-I00. This research made use of NASA Astrophysics Data System and data from the European Space Agency (ESA) mission Gaia (https://www.cosmos.esa.int/gaia), processed by the Gaia Data Processing and Analysis Consortium (DPAC, https://www.cosmos.esa.int/web/gaia/dpac/consortium). Funding for the DPAC has been provided by national institutions, in particular the institutions participating in the Gaia Multilateral Agreement.
References
- Althaus, L. G., Serenelli, A. M., Panei, J. A., et al. 2005, A&A, 435, 631 [NASA ADS] [CrossRef] [EDP Sciences] [Google Scholar]
- Althaus, L. G., García-Berro, E., Isern, J., Córsico, A. H., & Rohrmann, R. D. 2007, A&A, 465, 249 [NASA ADS] [CrossRef] [EDP Sciences] [Google Scholar]
- Althaus, L. G., Córsico, A. H., Isern, J., & García-Berro, E. 2010a, A&ARv, 18, 471 [NASA ADS] [CrossRef] [Google Scholar]
- Althaus, L. G., Córsico, A. H., Bischoff-Kim, A., et al. 2010b, ApJ, 717, 897 [NASA ADS] [CrossRef] [Google Scholar]
- Althaus, L. G., Camisassa, M. E., Miller Bertolami, M. M., Córsico, A. H., & García-Berro, E. 2015, A&A, 576, A9 [NASA ADS] [CrossRef] [EDP Sciences] [Google Scholar]
- Althaus, L. G., Gil-Pons, P., Córsico, A. H., et al. 2021, A&A, 646, A30 [NASA ADS] [CrossRef] [EDP Sciences] [Google Scholar]
- Baiko, D. A. 2022, MNRAS, 517, 3962 [NASA ADS] [CrossRef] [Google Scholar]
- Baiko, D. A. 2023, MNRAS, 522, L26 [NASA ADS] [CrossRef] [Google Scholar]
- Bauer, E. B. 2023, ApJ, 950, 115 [NASA ADS] [CrossRef] [Google Scholar]
- Bauer, E. B., Schwab, J., Bildsten, L., & Cheng, S. 2020, ApJ, 902, 93 [Google Scholar]
- Bédard, A., Bergeron, P., Brassard, P., & Fontaine, G. 2020, ApJ, 901, 93 [Google Scholar]
- Bedin, L. R., Salaris, M., Piotto, G., et al. 2009, ApJ, 697, 965 [NASA ADS] [CrossRef] [Google Scholar]
- Bedin, L. R., Salaris, M., King, I. R., et al. 2010, ApJ, 708, L32 [NASA ADS] [CrossRef] [Google Scholar]
- Bedin, L. R., Salaris, M., Anderson, J., et al. 2015, MNRAS, 448, 1779 [NASA ADS] [CrossRef] [Google Scholar]
- Bellini, A., Bedin, L. R., Piotto, G., et al. 2010, A&A, 513, A50 [NASA ADS] [CrossRef] [EDP Sciences] [Google Scholar]
- Bellini, A., Anderson, J., Salaris, M., et al. 2013, ApJ, 769, L32 [NASA ADS] [CrossRef] [Google Scholar]
- Bergeron, P., Kilic, M., Blouin, S., et al. 2022, ApJ, 934, 36 [NASA ADS] [CrossRef] [Google Scholar]
- Blouin, S., Daligault, J., & Saumon, D. 2021, ApJ, 911, L5 [NASA ADS] [CrossRef] [Google Scholar]
- Camisassa, M. E., Althaus, L. G., Córsico, A. H., et al. 2016, ApJ, 823, 158 [CrossRef] [Google Scholar]
- Camisassa, M. E., Althaus, L. G., Rohrmann, R. D., et al. 2017, ApJ, 839, 11 [NASA ADS] [CrossRef] [Google Scholar]
- Camisassa, M. E., Althaus, L. G., Córsico, A. H., et al. 2019, A&A, 625, A87 [NASA ADS] [CrossRef] [EDP Sciences] [Google Scholar]
- Camisassa, M. E., Althaus, L. G., Torres, S., et al. 2021, A&A, 649, L7 [NASA ADS] [CrossRef] [EDP Sciences] [Google Scholar]
- Camisassa, M. E., Althaus, L. G., Koester, D., et al. 2022a, MNRAS, 511, 5198 [NASA ADS] [CrossRef] [Google Scholar]
- Camisassa, M. E., Raddi, R., Althaus, L. G., et al. 2022b, MNRAS, 516, L1 [NASA ADS] [CrossRef] [Google Scholar]
- Campbell, S. W., & Lattanzio, J. C. 2008, A&A, 490, 769 [NASA ADS] [CrossRef] [EDP Sciences] [Google Scholar]
- Caplan, M. E., Freeman, I. F., Horowitz, C. J., Cumming, A., & Bellinger, E. P. 2021, ApJ, 919, L12 [NASA ADS] [CrossRef] [Google Scholar]
- Caplan, M. E., Blouin, S., & Freeman, I. F. 2023, ApJ, 946, 78 [NASA ADS] [CrossRef] [Google Scholar]
- Cassisi, S., Potekhin, A. Y., Pietrinferni, A., Catelan, M., & Salaris, M. 2007, ApJ, 661, 1094 [NASA ADS] [CrossRef] [Google Scholar]
- Cheng, S., Cummings, J. D., & Ménard, B. 2019, ApJ, 886, 100 [Google Scholar]
- Christensen-Dalsgaard, J., Silva Aguirre, V., Cassisi, S., et al. 2020, A&A, 635, A165 [NASA ADS] [CrossRef] [EDP Sciences] [Google Scholar]
- Córsico, A. H., Althaus, L. G., Miller Bertolami, M. M., & Kepler, S. O. 2019, A&ARv, 27, 7 [Google Scholar]
- Ferguson, J. W., Alexander, D. R., Allard, F., et al. 2005, ApJ, 623, 585 [Google Scholar]
- Fontaine, G., & Brassard, P. 2008, PASP, 120, 1043 [NASA ADS] [CrossRef] [Google Scholar]
- Frost, C. A., & Lattanzio, J. C. 1996, ApJ, 473, 383 [NASA ADS] [CrossRef] [Google Scholar]
- Gaia Collaboration (Brown, A. G. A., et al.) 2018, A&A, 616, A1 [NASA ADS] [CrossRef] [EDP Sciences] [Google Scholar]
- García-Berro, E., & Oswalt, T. D. 2016, New Astron. Rev., 72, 1 [CrossRef] [Google Scholar]
- García-Berro, E., Torres, S., Althaus, L. G., et al. 2010, Nature, 465, 194 [Google Scholar]
- Gil-Pons, P., Doherty, C. L., Lau, H., et al. 2013, A&A, 557, A106 [NASA ADS] [CrossRef] [EDP Sciences] [Google Scholar]
- Gil-Pons, P., Doherty, C. L., Gutiérrez, J. L., et al. 2018, PASA, 35, 38 [NASA ADS] [CrossRef] [Google Scholar]
- Gordon, P. 1968, Principles of Phase Diagrams in Materials Systems (New York: McGraw-Hill) [Google Scholar]
- Griggio, M., Salaris, M., Nardiello, D., et al. 2023, MNRAS, 524, 108 [Google Scholar]
- Haft, M., Raffelt, G., & Weiss, A. 1994, ApJ, 425, 222 [NASA ADS] [CrossRef] [Google Scholar]
- Hansen, B. M. S., Brewer, J., Fahlman, G. G., et al. 2002, ApJ, 574, L155 [NASA ADS] [CrossRef] [Google Scholar]
- Horowitz, C. J. 2020, Phys. Rev. D, 102, 083031 [Google Scholar]
- Horowitz, C. J., Schneider, A. S., & Berry, D. K. 2010, Phys. Rev. Lett., 104, 231101 [NASA ADS] [CrossRef] [Google Scholar]
- Iglesias, C. A., & Rogers, F. J. 1996, ApJ, 464, 943 [NASA ADS] [CrossRef] [Google Scholar]
- Isern, J., Torres, S., & Rebassa-Mansergas, A. 2022, Front. Astron. Space Sci., 9, 6 [NASA ADS] [CrossRef] [Google Scholar]
- Itoh, N., Hayashi, H., Nishikawa, A., & Kohyama, Y. 1996, ApJS, 102, 411 [NASA ADS] [CrossRef] [Google Scholar]
- Jiménez-Esteban, F. M., Torres, S., Rebassa-Mansergas, A., et al. 2023, MNRAS, 518, 5106 [Google Scholar]
- Kilic, M., Bergeron, P., Kosakowski, A., et al. 2021, MNRAS, 503, 4734 [Google Scholar]
- Koester, D. 2010, Mem. Soc. Astron. It., 81, 921 [NASA ADS] [Google Scholar]
- Magni, G., & Mazzitelli, I. 1979, A&A, 72, 134 [NASA ADS] [Google Scholar]
- Medin, Z., & Cumming, A. 2010, Phys. Rev. E, 81, 036107 [Google Scholar]
- Miller Bertolami, M. M. 2016, A&A, 588, A25 [NASA ADS] [CrossRef] [EDP Sciences] [Google Scholar]
- Ogata, S., Iyetomi, H., Ichimaru, S., & van Horn, H. M. 1993, Phys. Rev. E, 48, 1344 [CrossRef] [Google Scholar]
- Raddi, R., Torres, S., Rebassa-Mansergas, A., et al. 2022, A&A, 658, A22 [NASA ADS] [CrossRef] [EDP Sciences] [Google Scholar]
- Rebassa-Mansergas, A., Maldonado, J., Raddi, R., et al. 2021, MNRAS, 505, 3165 [NASA ADS] [CrossRef] [Google Scholar]
- Renedo, I., Althaus, L. G., Miller Bertolami, M. M., et al. 2010, ApJ, 717, 183 [Google Scholar]
- Rohrmann, R. D., Althaus, L. G., García-Berro, E., Córsico, A. H., & Miller Bertolami, M. M. 2012, A&A, 546, A119 [NASA ADS] [CrossRef] [EDP Sciences] [Google Scholar]
- Salaris, M., Althaus, L. G., & García-Berro, E. 2013, A&A, 555, A96 [NASA ADS] [CrossRef] [EDP Sciences] [Google Scholar]
- Salaris, M., Cassisi, S., Pietrinferni, A., & Hidalgo, S. 2022, MNRAS, 509, 5197 [Google Scholar]
- Scholz, R.-D. 2022, Res. Notes Am. Astron. Soc., 6, 36 [Google Scholar]
- Segretain, L., Chabrier, G., Hernanz, M., et al. 1994, ApJ, 434, 641 [NASA ADS] [CrossRef] [Google Scholar]
- Siess, L. 2010, A&A, 512, A10 [NASA ADS] [CrossRef] [EDP Sciences] [Google Scholar]
- Silva Aguirre, V., Christensen-Dalsgaard, J., Cassisi, S., et al. 2020, A&A, 635, A164 [NASA ADS] [CrossRef] [EDP Sciences] [Google Scholar]
- Torres, S., García-Berro, E., Althaus, L. G., & Camisassa, M. E. 2015, A&A, 581, A90 [NASA ADS] [CrossRef] [EDP Sciences] [Google Scholar]
- Tremblay, P.-E., Fontaine, G., Fusillo, N. P. G., et al. 2019, Nature, 565, 202 [Google Scholar]
- Vassiliadis, E., & Wood, P. R. 1993, ApJ, 413, 641 [Google Scholar]
- Winget, D. E., & Kepler, S. O. 2008, ARA&A, 46, 157 [Google Scholar]
- Wood, P. R., & Faulkner, D. J. 1987, Proc. Astron. Soc. Aust., 7, 75 [Google Scholar]
All Tables
Effective temperature and stellar luminosity at crystallization and exsolution onsets for each of the white dwarf models presented in this paper.
All Figures
|
Fig. 1. Phase diagram (upper panel) and entropy excess (lower panel) for the exsolution process in a binary ONe mixture taken from Baiko (2023). Upper panel: the purple line is the solvus and the region below it is the miscibility gap. A solid solution with an initial Ne numerical abundance Xinitial will begin exsolution at a temperature TExol determined by the solvus. By the time the temperature drops to the value T1, the solid will be decomposed into two mixtures, one depleted in Ne, with a Ne abundance XNe = a1, and the other enriched in Ne, with a Ne abundance XNe = b1. By the time the temperature drops to the value T2, the two solids will have respective abundances of a2 and b2. The exsolution process is completed at temperature T = 0, where the solid is separated into two components, pure O and pure Ne. Lower panel: excess entropy of exsolution as a function of Ne numerical abundance in a solid undergoing decomposition. |
| In the text | |
|
Fig. 2. Main contributions to the white dwarf luminosity (solid dark-green line) in terms of the cooling age (defined as zero when the star reaches the maximum effective temperature) for the 1.16 M⊙ ONe model including crystallization and exsolution processes. The dashed red line displays the gravothermal energy release, the dashed green line indicates the energy lost by neutrino emission, the dotted blue line is the latent heat of crystallization, the dot-dashed orange line shows the energy released due to the ONe phase separation induced by crystallization, and the dot-dashed yellow line displays the exsolution heat. The arrows indicate the times when these physical processes are acting. The crosses indicate the moments at which we plot the chemical profiles in Fig. 3. |
| In the text | |
|
Fig. 3. Chemical profiles and exsolution heat release for our 1.16 M⊙ ONe-core model including crystallization and exsolution at different stages of the white dwarf evolution. The dashed green (dotted blue) line displays the 16O (20Ne) numerical abundance, the solid black line depicts the energy released by the exsolution process in units of 10−5 erg gr−1 s−1, the dot-dashed orange line displays the Ne numerical abundance ai of the Ne-depleted mixture, and the dot-dot-dashed purple line depicts the fraction of ions in the Ne-enriched mixture Mi/NTOT (see Sect. 2.3 for details). Panels a–d show the moments before the crystallization onset (Teff = 25 700 K), after 95% of the mass has crystallized (Teff = 8900 K), when 50% of the white dwarf mass has begun exsolution (Teff = 6400 K), and when 80% of the white dwarf mass has begun exsolution (Teff = 5300 K), respectively. These epochs are marked in Fig. 2 by crosses. |
| In the text | |
|
Fig. 4. Impact of crystallization (including latent heat and phase separation) and exsolution processes on the cooling times of a 0.58 M⊙ CO-core white dwarf model. The left panel shows the luminosity versus cooling time for the sequence that disregards crystallization and exsolution (purple line), includes crystallization but disregards exsolution (green line), includes exsolution but disregards crystallization (blue line), and includes both processes (orange line). The middle panel shows the cooling delay of the last three sequences with respect to the first one. The right panel shows the percentage of crystallized mass (green line) and the percentage of mass that has begun exsolution (blue line) versus the stellar luminosity. |
| In the text | |
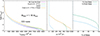 |
Fig. 5. Same as Fig. 4, but for the 1.16 M⊙ CO-core white dwarf model. |
| In the text | |
 |
Fig. 6. Same as Fig. 4, but for the 1.16 M⊙ ONe-core white dwarf model. |
| In the text | |
|
Fig. 7. Crystallization and exsolution on the Gaia DR3 color–magnitude diagram. Solid black lines and dot-dashed blue lines are CO and ONe evolutionary sequences, respectively. The masses of the CO (ONe) sequences are, from top to bottom, 0.53, 0.58, 0.66, 0.83, 0.95, 1.1, 1.16, 1.23, and 1.29 (1.1, 1.16, 1.23, and 1.29) M⊙. Filled blue squares (filled black circles) indicate the crystallization onset and the moment when 80% of the white dwarf mass has crystallized for ONe (CO) white dwarfs. Filled purple squares (filled brown circles) show the exsolution onset and the moment when 80% of the white dwarf mass has begun exsolution for ONe (CO) white dwarfs. The white dwarf sample within 100 pc and the IR-faint white dwarfs from Bergeron et al. (2022) are plotted as red dots and filled red circles, respectively. |
| In the text | |
|
Fig. 8. Crystallization and exsolution processes on the mass–effective temperature plane. Solid black lines indicate the crystallization onset and the moment when 80% of the white dwarf mass is crystallized in our CO models. Solid brown (dot-dashed purple) curves display the exsolution onset and the moment when 80% of the white dwarf mass has begun exsolution in CO (ONe) models. Solid blue and cyan lines indicate the transition between the classic and the quantum Debye regime in dense ionic plasma. Black dots are the DA white dwarfs within 100 pc from the Sun (Jiménez-Esteban et al. 2023), while the green crosses are the sample of 105 IR-faint white dwarfs (Bergeron et al. 2022). |
| In the text | |
Current usage metrics show cumulative count of Article Views (full-text article views including HTML views, PDF and ePub downloads, according to the available data) and Abstracts Views on Vision4Press platform.
Data correspond to usage on the plateform after 2015. The current usage metrics is available 48-96 hours after online publication and is updated daily on week days.
Initial download of the metrics may take a while.