Fig. 3.
Download original image
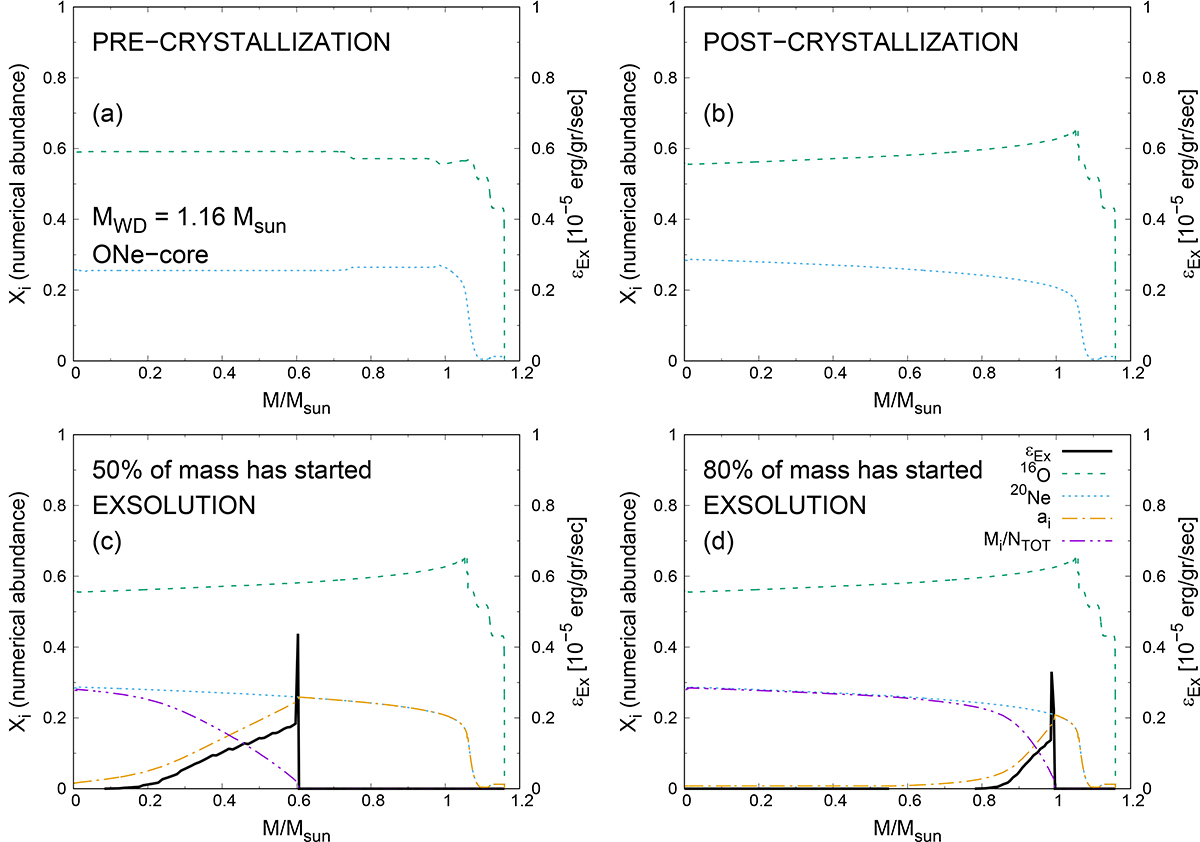
Chemical profiles and exsolution heat release for our 1.16 M⊙ ONe-core model including crystallization and exsolution at different stages of the white dwarf evolution. The dashed green (dotted blue) line displays the 16O (20Ne) numerical abundance, the solid black line depicts the energy released by the exsolution process in units of 10−5 erg gr−1 s−1, the dot-dashed orange line displays the Ne numerical abundance ai of the Ne-depleted mixture, and the dot-dot-dashed purple line depicts the fraction of ions in the Ne-enriched mixture Mi/NTOT (see Sect. 2.3 for details). Panels a–d show the moments before the crystallization onset (Teff = 25 700 K), after 95% of the mass has crystallized (Teff = 8900 K), when 50% of the white dwarf mass has begun exsolution (Teff = 6400 K), and when 80% of the white dwarf mass has begun exsolution (Teff = 5300 K), respectively. These epochs are marked in Fig. 2 by crosses.
Current usage metrics show cumulative count of Article Views (full-text article views including HTML views, PDF and ePub downloads, according to the available data) and Abstracts Views on Vision4Press platform.
Data correspond to usage on the plateform after 2015. The current usage metrics is available 48-96 hours after online publication and is updated daily on week days.
Initial download of the metrics may take a while.