Fig. 8.
Download original image
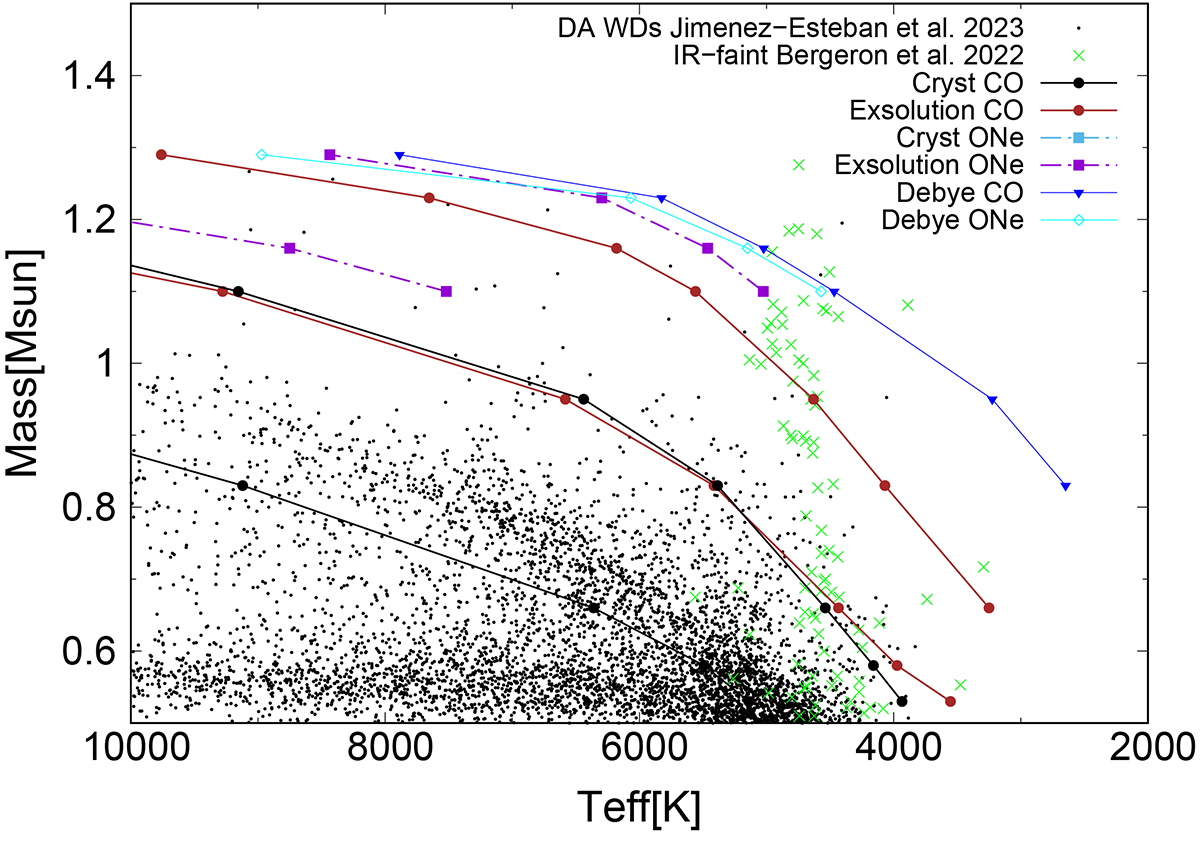
Crystallization and exsolution processes on the mass–effective temperature plane. Solid black lines indicate the crystallization onset and the moment when 80% of the white dwarf mass is crystallized in our CO models. Solid brown (dot-dashed purple) curves display the exsolution onset and the moment when 80% of the white dwarf mass has begun exsolution in CO (ONe) models. Solid blue and cyan lines indicate the transition between the classic and the quantum Debye regime in dense ionic plasma. Black dots are the DA white dwarfs within 100 pc from the Sun (Jiménez-Esteban et al. 2023), while the green crosses are the sample of 105 IR-faint white dwarfs (Bergeron et al. 2022).
Current usage metrics show cumulative count of Article Views (full-text article views including HTML views, PDF and ePub downloads, according to the available data) and Abstracts Views on Vision4Press platform.
Data correspond to usage on the plateform after 2015. The current usage metrics is available 48-96 hours after online publication and is updated daily on week days.
Initial download of the metrics may take a while.