Fig. 7.
Download original image
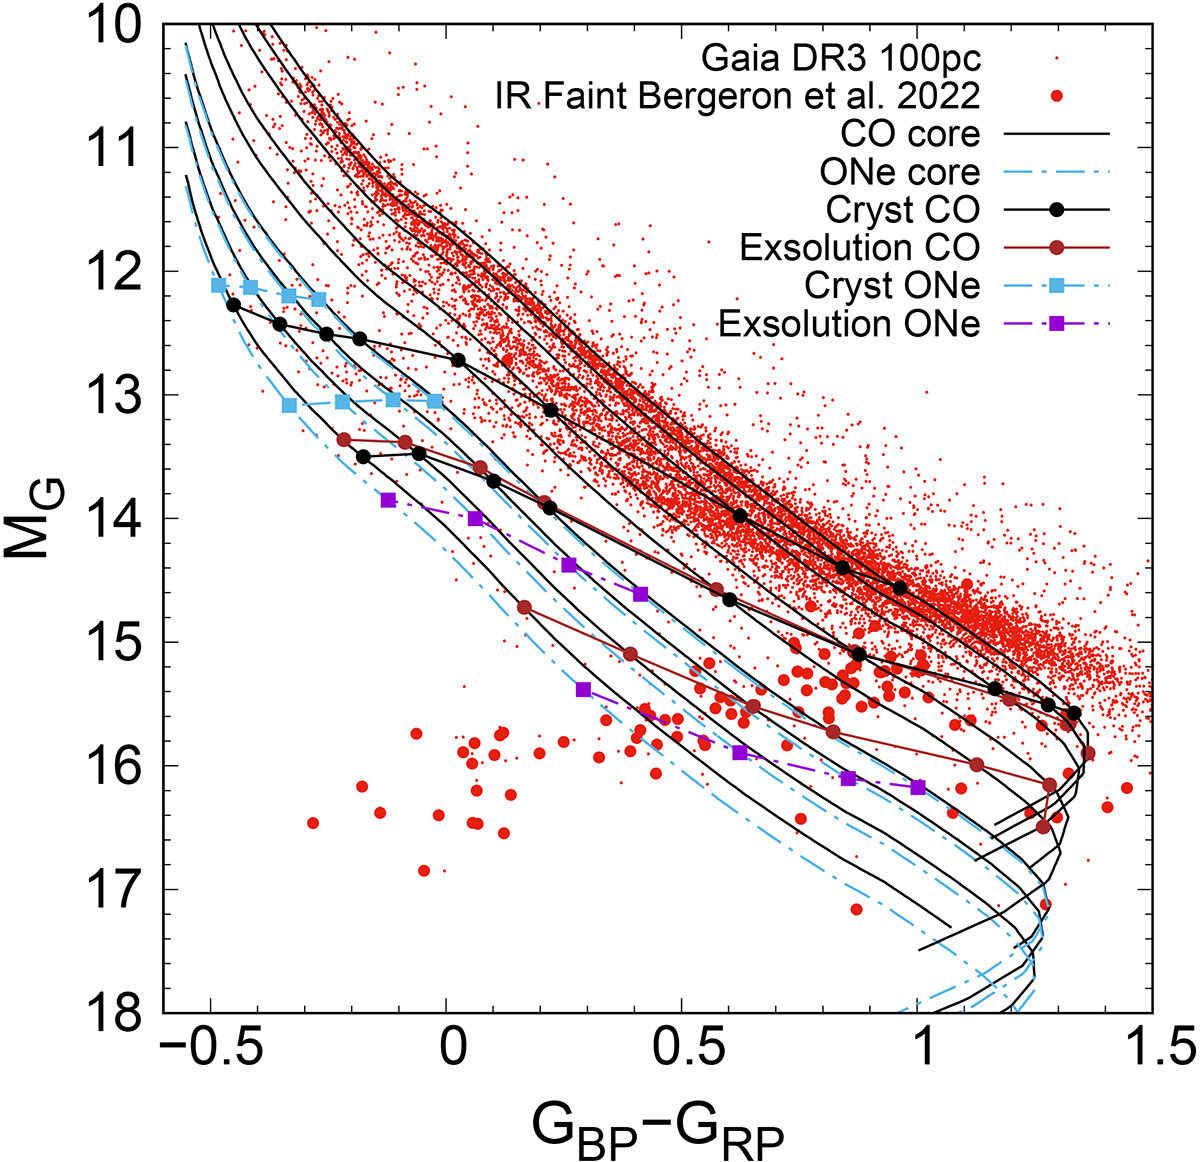
Crystallization and exsolution on the Gaia DR3 color–magnitude diagram. Solid black lines and dot-dashed blue lines are CO and ONe evolutionary sequences, respectively. The masses of the CO (ONe) sequences are, from top to bottom, 0.53, 0.58, 0.66, 0.83, 0.95, 1.1, 1.16, 1.23, and 1.29 (1.1, 1.16, 1.23, and 1.29) M⊙. Filled blue squares (filled black circles) indicate the crystallization onset and the moment when 80% of the white dwarf mass has crystallized for ONe (CO) white dwarfs. Filled purple squares (filled brown circles) show the exsolution onset and the moment when 80% of the white dwarf mass has begun exsolution for ONe (CO) white dwarfs. The white dwarf sample within 100 pc and the IR-faint white dwarfs from Bergeron et al. (2022) are plotted as red dots and filled red circles, respectively.
Current usage metrics show cumulative count of Article Views (full-text article views including HTML views, PDF and ePub downloads, according to the available data) and Abstracts Views on Vision4Press platform.
Data correspond to usage on the plateform after 2015. The current usage metrics is available 48-96 hours after online publication and is updated daily on week days.
Initial download of the metrics may take a while.