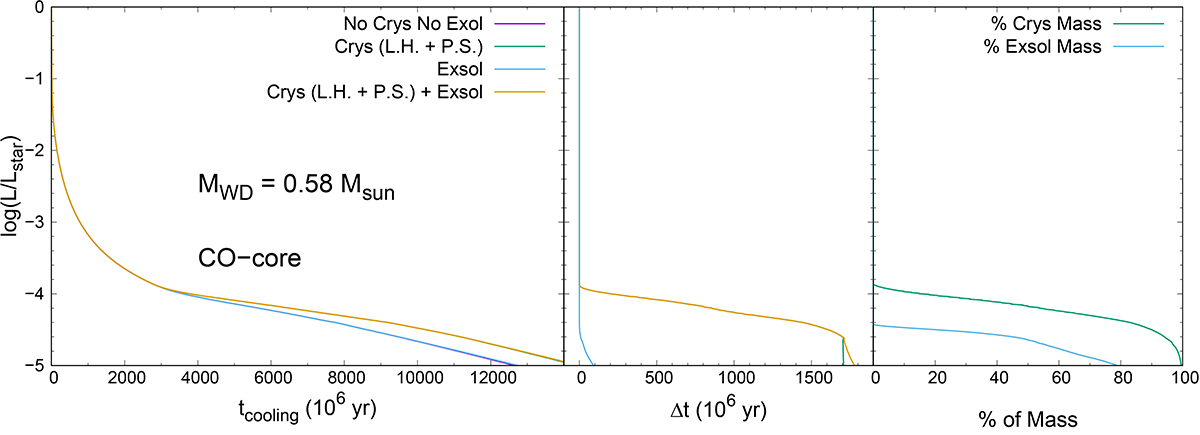
Fig. 4.
Download original image
Impact of crystallization (including latent heat and phase separation) and exsolution processes on the cooling times of a 0.58 M⊙ CO-core white dwarf model. The left panel shows the luminosity versus cooling time for the sequence that disregards crystallization and exsolution (purple line), includes crystallization but disregards exsolution (green line), includes exsolution but disregards crystallization (blue line), and includes both processes (orange line). The middle panel shows the cooling delay of the last three sequences with respect to the first one. The right panel shows the percentage of crystallized mass (green line) and the percentage of mass that has begun exsolution (blue line) versus the stellar luminosity.
Current usage metrics show cumulative count of Article Views (full-text article views including HTML views, PDF and ePub downloads, according to the available data) and Abstracts Views on Vision4Press platform.
Data correspond to usage on the plateform after 2015. The current usage metrics is available 48-96 hours after online publication and is updated daily on week days.
Initial download of the metrics may take a while.