| Issue |
A&A
Volume 683, March 2024
|
|
|---|---|---|
| Article Number | A131 | |
| Number of page(s) | 16 | |
| Section | Extragalactic astronomy | |
| DOI | https://doi.org/10.1051/0004-6361/202348098 | |
| Published online | 13 March 2024 | |
Interpreting the long-term variability of the changing-look AGN Mrk 1018
1
Netherlands Institute for Radio Astronomy (ASTRON), Oude Hoogeveensedijk 4, 7991 PD Dwingeloo, The Netherlands
e-mail: This email address is being protected from spambots. You need JavaScript enabled to view it.
2
Kapteyn Astronomical Institute, University of Groningen, PO Box 800 9700 AV Groningen, The Netherlands
3
Dipartimento di Fisica e Astronomia Augusto Righi, Università degli Studi di Bologna, Via Gobetti 93/2, 40129 Bologna, Italy
4
INAF – Osservatorio di Astrofisica e Scienza dello Spazio di Bologna, Via Gobetti 93/3, 40129 Bologna, Italy
5
INAF – Osservatorio Astronomico di Brera, Via Brera 28, 20121 Milano, Italy
6
Quasar Science Resources SL for ESA, European Space Astronomy Centre (ESAC), Science Operations Department, 28692 Villanueva de la Cañada, Madrid, Spain
7
Department of Physics – University of Pisa, Largo B. Pontecorvo 3, 56127 Pisa, Italy
8
INFN, Largo B. Pontecorvo 3, 56127 Pisa, Italy
Received:
28
September
2023
Accepted:
11
December
2023
Abstract
We present a comprehensive study of the changing-look active galactic nucleus (CL-AGN) Mrk 1018 based on the largest dataset of optical, UV, and X-ray spectro-photometric data ever assembled for this source. Our investigation comprises a detailed analysis of X-ray spectra, broad-band photometry, and optical-to-X-ray spectral energy distribution (SED) fitting, with the aim being to unravel the nature of the changing-look behavior observed in Mrk 1018 between 2005 and 2019. Based on the results of our analysis, we confirm that, in those 14 years, the X-rays from the source underwent a significant spectral variation, with the hardness ratio between the 0.5−2 keV band and the 2−10 keV band increasing from 0.2 ± 0.1 to 0.4 ± 0.1. We also validate the dramatic broad-band dimming, with the optical, UV, and X-ray luminosities decreasing by a factor of > 7, > 24, and ∼9, respectively. We find that the declining UV emission is driving these drops. By describing the X-ray spectra with a two-Comptonization model, with a hot (kT ∼ 100 keV) and a warm (kT < 1 keV) Comptonizing medium reprocessing the photons from the accretion disk, we reach the conclusion that, between 2005 and 2019, the properties of the hot medium remained the same, while the warm component cooled down from a temperature of ∼0.4 keV to ∼0.2 keV. This cooling can be explained by the weakening of the magnetic fields in the accretion disk and is also the source of the UV dimming. We propose that this decline is caused by the formation of a jet, itself originating from the change in the state of the inner accretion flow from a geometrically thin, optically thick structure to a geometrically thick, optically thin flow. Our optical-to-X-ray SED fitting seems to support this conclusion, as the estimated accretion rate normalized to the Eddington rate in the bright state (μ ∼ 0.06) is above the critical value μ = 0.02 for a stable radiative flow, while in the faint state we find μ ∼ 0.01 < 0.02, which is compatible with advective accretion. Instabilities arising at the interface of the state transition are then able to reduce the viscous timescale from ∼105 years to the observed ∼10 years of Mrk 1018 variability, reconciling all the observational properties of this CL-AGN into a complex but elegant physically motivated framework. Finally, we explored a possible mechanism triggering the state transition of the inner accretion flow. Our speculation is that gaseous clouds are pushed onto the innermost regions of the AGN by a galactic (dynamical friction) and/or an extragalactic process (wet merger, cold chaotic accretion). When one of these clouds passes by, it deposits material onto the accretion disk, causing the accretion flow to “puff up”, establishing the state transition. If this scenario is confirmed by future numerical simulations, it will open a new branch of study to place CL-AGN into our current understanding of the feeding and feedback of AGN. We also think that our results can be applied to other CL-AGN as well, and speculate that an accretion rate of μ ∼ 0.02, coupled with minor “disturbances” in the accretion disk, could indeed be the primary factor prompting the complex changing-look phenomenon.
Key words: accretion / accretion disks / magnetic fields / techniques: spectroscopic / galaxies: active / galaxies: nuclei / X-rays: galaxies
© The Authors 2024
 Open Access article, published by EDP Sciences, under the terms of the Creative Commons Attribution License (https://creativecommons.org/licenses/by/4.0), which permits unrestricted use, distribution, and reproduction in any medium, provided the original work is properly cited.
This article is published in open access under the Subscribe to Open model. This email address is being protected from spambots. You need JavaScript enabled to view it. to support open access publication.
1. Introduction
Active galactic nuclei (AGN) are generally classified based on the presence of both broad (> 103 km s−1) and narrow optical emission lines (type 1) or the presence of only the narrow component (type 2). According to the AGN unification model (Antonucci 1993), the difference between the two classes is only due to the line of sight: in type 2 AGN, the dusty torus surrounding the supermassive black hole (SMBH) at scales of parsecs to tens of parsecs obscures the broad line emission, while in type 1 AGN the observer has a direct line of sight to the broad line region (BLR).
However, the distinction between type 1 and type 2 cannot be a mere orientation effect, as there is evidence of significant variation of the optical emission lines of AGN, with the appearance and disappearance of their broad component on timescales that go from days to decades (Risaliti et al. 2007; McElroy et al. 2016; Yang et al. 2018; MacLeod et al. 2019; Graham et al. 2020). These are the so-called changing-look AGN (CL-AGN) and are currently an open issue in AGN physics. Indeed, the variation might be related to changes in the column density (Risaliti et al. 2005; Marchese et al. 2012; Dexter et al. 2019); for example those brought on by eclipsing events, disk instabilities (Gezari et al. 2017; Dexter et al. 2019), and accretion-rate variations (LaMassa et al. 2015; Ruan et al. 2016).
Mrk 1018 (see Table 1 for the main observational properties) is currently one of the most studied CL-AGN (McElroy et al. 2016; Husemann et al. 2016; Krumpe et al. 2017; LaMassa et al. 2017; Kim et al. 2018; Noda & Done 2018; Dexter & Begelman 2019; Hutsemékers et al. 2020; Feng et al. 2021; Lyu et al. 2021; Walsh et al. 2023; Brogan et al. 2023) because of its peculiar behavior. It was optically classified as a type 2 AGN with narrow optical emission lines in 1981 (Osterbrock 1981), but later studies carried out by Cohen et al. (1986) and Goodrich (1989) revealed that broad emission lines appear in the optical spectrum, coupled with an increase in Hβ flux by a factor of 6.6. Therefore, Mrk 1018 was reclassified as a type 1 AGN.
Mrk 1018 main observational properties.
While Cohen et al. (1986) concluded that the variability was the result of a brightening of the UV continuum, which had ionized more material, the spectropolarimetry measurements used by Goodrich (1989) suggested that the disappearing of dusty material along the line of sight was the reason behind the spectral variation. No further studies in this regard were performed until 2016, when the Close AGN Reference Survey (McElroy et al. 2016; Husemann et al. 2016) compared the spectrum of Mrk 1018 taken by Sloan Digital Sky Survey (SDSS) in 2003 with that obtained by the Multi-Unit Spectroscopic Explorer (MUSE) in 2015, discovering that the broad optical emission lines have almost disappeared. The spectral changes were accompanied by a dimming of the source, with the r-band magnitude dropping from 15.2 ± 0.2 mag to 17.0 ± 0.2 mag over a timescale of 12 years.
A number of hypotheses were proposed in an attempt to explain the mechanism behind the behavior of Mrk 1018: a tidal disruption of a massive star (McElroy et al. 2016); the transit of obscuring clouds (McElroy et al. 2016; Husemann et al. 2016); a progressive shutdown of the AGN activity due to a simple lack of fuel (McElroy et al. 2016); the presence of a binary SMBH system (McElroy et al. 2016; Husemann et al. 2016); a state transition of the accretion disk (Noda & Done 2018; Dexter & Begelman 2019; Lyu et al. 2021); a recoiling SMBH (Kim et al. 2018); and a magnetically driven outflow in the accretion disk (Feng et al. 2021). Nevertheless, no conclusive explanation of the peculiar behavior of Mrk 1018 has been found.
The main outcome of these works is the finding that the mechanism leading to the variability of Mrk 1018 very likely resides in the innermost regions of the AGN; that is, the accretion disk. However, the lack of sufficient spectral coverage, statistics, or temporal coverage has always limited interpretations, and the phenomenon triggering the perturbation affecting the accretion disk is still an open question. Motivated by these considerations, and because the radiation in these bands samples the accretion flow, we decided to analyze all the available X-ray and optical/UV data in an attempt to understand what is making Mrk 1018 a CL-AGN.
In Sect. 2 we list the main properties of the observations used in this paper and the data reduction process of the raw archival data to obtain high-quality scientific products. In Sect. 3 we show the analysis we performed in an attempt to decipher what is triggering the variability of Mrk 1018. In Sect. 4 we discuss our main results. In Sect. 5 we present our interpretation of the changing-look nature of Mrk 1018. Finally, we provide a summary of our research in Sect. 6 and some future prospects in Sect. 7.
Throughout the paper we assume a flat cosmology with H0 = 70 km s−1 Mpc−1 and ΩM = 0.3 (Planck Collaboration VI 2020; Brout et al. 2022). All uncertainties are at the 90% confidence level for one parameter of interest (Avni 1976) unless explicitly stating otherwise.
2. Observations and data reduction
The observational campaign presented in this paper comprises 82 datasets from four X-ray observatories (Chandra, XMM-Newton, Swift-XRT1, and NuSTAR), for a total of ∼600 kiloseconds (ks) of exposure time. The sample comprises eight observations taken during the bright state, which corresponds to the period 2005−2012 hereafter, and the remaining observations were made during the faint state from 2012 to 2020. To overcome the limitations in the statistics, we combined most of the observations as described in the following sections. A summary of the final dataset used in this study can be found in Tables 2 and 3.
Main properties and statistics of the observations of Mrk 1018.
Optical/UV flux densities of Mrk 1018 in units of 10−16 erg s−1 cm−2 Å−1 for each filter.
2.1. Common data reduction steps
The details of each instrument are provided below. First we provide a brief overview of the standard procedure used to reduce the data:
-
Data reprocessing: The most recent calibrations are applied; bad pixel, chip gaps, and good time intervals (GTIs) are obtained; exposure maps, ancillary response functions (ARFs), and response matrix functions (RMF) are made; and images of the object are reconstructed.
-
Definition of source and background extraction regions.
-
Spectral binning (or grouping): Channels are grouped to have more than 20 counts per energy bin (necessary to apply a χ2 statistics).
2.2. Chandra data reduction
Chandra (Weisskopf et al. 2000) observed Mrk 1018 a total of 11 times: once in 2010, once in 2016, and nine times in the period from 2017 to 2019. The exposure time varied from 18 ks to 51 ks, with a mean value of 26 ks. The Chandra bandwidth (0.3−7 keV) covers the energy range where we expect to find the bulk of the X-ray emission.
The data were reduced using tools from CIAO (Fruscione et al. 2006), namely the v4.12 package. The calibration parameters during the reprocessing steps were automatically retrieved by CIAO from the online HEASARC Calibration Database CALDB v4.9.0.
The AGN spectrum was extracted for each observation from a circular region with a radius of 2.5″ so that the encircled energy fraction (EEF) is ∼90% at 5 keV. The background spectrum was taken from four circular source-free regions far from Mrk 1018 (angular distances and radii were arbitrary).
The architecture of the Chandra detector means that it potentially suffers from the pileup effect, a faulty measurement of two or more photons detected as a single particle whose energy is the sum of the energy of the photons. We evaluated how much each dataset was affected by this issue with the online tool PIMMS v4.102, finding that for the observation with ID 12868 a high fraction of the data (ca. 23%) is affected. In order to mitigate the effects of pile up, we added a pileup component in the expected spectrum of this dataset as proposed by LaMassa et al. (2017) for the same observation.
Given the very low count rate (C) of the other datasets with respect to 12868, we assume that these observations were taken during the faint state. Therefore, after ensuring that the count rate and the hardness ratio  of these other datasets are comparable, we co-added all of them to form a combined spectrum with the task combine_spectra. The spectra were finally grouped to have at least 30 counts per bin.
2.3. XMM-Newton data reduction
XMM-Newton (Jansen et al. 2001) observed Mrk 1018 four times: in 2005, 2008, 2018, and 2019. The exposure time varied from 12 ks to 75 ks, with a mean value of 43 ks. The nominal energy range (0.3−10 keV) of this instrument is larger than that of Chandra and provides the opportunity to better investigate both the soft X-ray region (< 0.5 keV) and the properties of the Kα iron line at 6.4 keV.
All XMM-Newton observations have simultaneous optical-UV photometry from Optical Monitor (XMM-OM, Mason et al. 2001). Four filters were used: U (λeff = 344 nm), UVW1 (λeff = 291 nm), UVM2 (λeff = 231 nm), and UVW2 (λeff = 212 nm). The simultaneous optical-to-X-ray coverage provides key information for understanding the interplay between the disk and its surrounding environment (BLR and corona).
The data reduction was carried out with tools from SAS (Gabriel et al. 2004; SAS Development Team 2014) v18.0.0 package. After reprocessing3, we filtered the flaring background, that is, the detection of high-energy (> 10 keV) charged particles that cause a false-positive cascade. This filtering was performed by extracting the light curve of the events with energy above 10 keV, and considering only the periods where the count rate is low (≤0.4 counts s−1, according to the XMM-Newton users handbook4), and checking against these data. The removal of the flaring background caused the loss of 46% of the exposure time, which was reduced from 172.04 ks to 94.40 ks.
The level of pileup was evaluated by the task epatplot and was graded as negligible.
The 0.3−10 keV source spectrum was taken from a 40″ wide circle equal to 90% and 85% of the EEF of the MOS and pn cameras at 5 keV, respectively. The background spectrum was extracted from a single source-free region. Data were grouped with a minimum of 25 counts per energy bin.
2.4. NuSTAR data reduction
NuSTAR (Harrison et al. 2013) acquired data for Mrk 1018 four times, once in 2016 and three times in 2018, with exposure times that varied from 22 ks to 43 ks, with a mean value of 33 ks. Thanks to its nominal bandpass of 3−79 keV, we were able to investigate the high-energy region of the Mrk 1018 spectrum.
Because NuSTAR uses cadmium-zinc-telluride (CZT) detectors, its data are always free from significant pileup. The spectra were extracted with the tools nupipeline from the HEASOFT5 (Nasa High Energy Astrophysics Science Archive Research Center 188 (Heasarc) 2014) v6.26.1 package, which produced filtered and calibrated6 events files, and nuproduct, which built the image in the nominal 3−79 keV range and extracted the source and background spectrum.
The selection region for the source was a 40″ wide circle (50% of the EEF at 10 keV for both cameras), while the background was defined by four circular regions free of sources around the image (angular distances and radii were arbitrary). The data were grouped with a minimum of 30 counts per energy bin.
Inspecting the signal-to-noise ratio (S/N) of the spectra, we found that the channels above 25 keV were extremely noisy and consequently removed them, which meant losing information about the very high-energy environment.
2.5. Swift-XRT data reduction
Swift-XRT (0.3−10 keV) has the largest set of observations, with a total of 63 data acquisitions spanning the 2005−2019 period. However, this instrument has the lowest exposure per observation. Indeed, the mean exposure time is 4 ks with minimum and maximum values of 0.7 ks and 7 ks, respectively. The time-wide coverage of Swift helped us to place constraints on the time-evolution of the Mrk 1018 spectrum and its flux. We also exploited the simultaneous Swift-UVOT photometry obtained in six optical/UV filters: V (λeff = 547 nm), B (λeff = 439 nm), U (λeff = 347 nm), UVW1 (λeff = 260 nm), UVM2 (λeff = 225 nm), and UVW2 (λeff = 193 nm).
Using the online tool “Swift Build XRT products routine”7, we combined the observations from 2005 to 2010 in order to produce a dataset for the bright state, and from 2016 to 2019, resulting in a dataset for the faint state. The data were grouped with a minimum of 30 counts per bin.
Observations 00049654001 and 00049654002 were taken in 2014 when the source was transitioning to the faint state. Consequently, given the very low statistics in their spectra, we opted to not use them in the X-ray analysis.
2.6. Optical/UV data reduction
As far as the optical/UV data reduction is concerned, XMM-OM data were reduced by running the SAS task omichain with default input parameters. For each filter, in each observation, we also extracted the spectral points using om2pha. Swift-UVOT photometry was instead retrieved with the task uvotsource from the HEASOFT package using as input:
-
a circular source region of 5″ in diameter (i.e., the size of the point spread function) centered on the source coordinates (Gaia Collaboration 2020). These were retrieved from the SIMBAD Astronomical Database (Wenger et al. 2000), as suggested by Pal et al. (2016);
-
a background region of ∼50″ away from the source;
-
a 3σ background threshold, where σ is the root mean square noise of each image.
We also used the task uvotimsum to combine the observations from 2005 to 2010 in order to obtain an image in each filter for the bright state, and from 2016 to 2019 to produce the image for the faint state. We finally ran uvotsource with the same input as above to get the photometry, and uvot2pha to extract the spectral points, for each filter, for both the bright and the faint state.
3. Data analysis
3.1. X-ray spectroscopy
We carried out the spectral analysis using XSPEC v12.13.0c (Arnaud 1996). We started the analysis of the X-ray spectra using a simple model with three components:
 (1)
(1)
where
-
phabs is the effect of the photoelectric absorption, which depends on the column density (nH) and the photoelectric cross-section. This effect is associated with the Milky Way gas; we impose nH = 2.48 × 10²⁰ atoms cm−2, as given by the neutral hydrogen map of HI4PI Collaboration (2016).
-
zpowerlw is the power law originating from the hot Comptonization (HC) scattering of the photons emitted by the accretion disk. We refer to this as the primary power law. The free parameters are the spectral index (ΓHC) and the power-law normalization (kHC).
-
zgauss models the 6.4 keV Fe Kα emission line using a Gaussian profile. We fixed the line width to 0.01 keV and let the normalization and the rest-frame energy free to vary.
We fit the model only to energies 3−10 keV (3−25 keV for NuSTAR), as in this regime the primary power law is likely dominant. We also produced the confidence contours to study the variation of ΓHC as a function of the normalization (see Fig. 1). The best fits are acceptable, as the  (degrees of freedom) is about 1.0 for each observation. However, when we apply these best fits to the full energy range, we find positive residuals below 2 keV. As an example, we report the best fit for the XMM-Newton 2008 observation 0554920301 in the left panels of Fig. 2. We modeled this soft excess first using a thermal component (mekal: Mewe et al. 1985, 1986; Liedahl et al. 1995) representing the emission from the diffuse hot gas in the host galaxy, and then via a double power law. However, the outcomes were not reasonable in either case. Indeed, in the former, the gas temperature is variable between the two states, which is not physically possible given the considered timescale of a few years; in the latter the second power law is negligible.
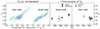 |
Fig. 1. HC properties of Mrk 1018. Left panel: confidence intervals of ΓHC vs. normalization for the HC power law. Contour levels correspond to confidence of 68%, 90%, and 99%. Dashed lines are used for the data related to the faint state, while solid lines correspond to the observations acquired during the bright state. Right panel: time evolution of ΓHC. Symbols and colors correspond to different telescopes: blue square Chandra, black circle XMM-Newton, green star NuSTAR, and red diamond Swift-XRT. The first data point of Chandra corresponds to the observation 12868, which is heavily affected by the pileup. The vertical dashed black line roughly denotes the separation between the bright and the faint state. |
Therefore, we modeled the soft excess using the dual-corona model (Czerny & Elvis 1987; Mehdipour et al. 2011; Petrucci et al. 2013; Ursini et al. 2020; Middei et al. 2020; Alston et al. 2023; Kawanaka & Mineshige 2023). In this scenario, there is a hot (∼100 keV) optically thin (τ < 1) spherical corona around the SMBH that produces the primary power law, and a warm (< 1 keV) optically thick (τ ≫ 1) corona in the innermost regions of the accretion flow that up-scatter the UV photons of the accretion disk to the soft X-ray range. However, the geometry of this secondary corona is still unknown (Done et al. 2012; Petrucci et al. 2013).
We used the XSPEC model nthcomp (Zdziarski et al. 1996; Życki et al. 1999) to reproduce the continuum of the warm Comptonization (WC). It is described by five parameters: the power-law spectral index8 (ΓWC), the temperature of the seeding photons, the temperature of the corona, and the normalization; that is, the flux at 1 keV. We set the seeding photons, whose temperature was fixed at 22 eV given the SMBH mass of about 107.84 M⊙, to be coming from a geometrically thin accretion disk emitting similarly to a black body (Shakura & Sunyaev 1973).
Thus, the observed spectra were described with the following model:
 (2)
(2)
For each dataset, we fixed the parameters of zpowerlw and zgauss to their best-fit values obtained for model (1). For the Swift-XRT combined dataset of the faint state, the properties of the WC were not constrained, and therefore we fixed ΓWC and the corona temperature to the values of the XMM-Newton observation closest in time. The results are reported in Table 4 and the improvement in the fits is shown in the right panels of Fig. 2.
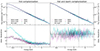 |
Fig. 2. Mrk 1018 0.3−10 keV spectrum taken from the XMM 2008 observation (ID: 0554920301). Top left panel: spectrum and the best-fit model (1) for each camera. The data of the two MOSs are plotted in magenta and in black, while pn data are represented in dark cyan. The best-fit for each camera is reported using the bold lines (of corresponding color) and refers to data at energies above 3 keV (the vertical dashed gray line). Bottom left panel: residuals, expressed in terms of (data-model)/error, for the HC model (1). The horizontal dashed black line indicates the zero-level, while the vertical dashed gray line denotes the 3 keV energy channel. Top right panel and bottom right panel: same as the left-side panels, but now the model and the residuals refer to the modeling with both the HC and WC and fitted over the whole energy range. |
Outcomes of the best-fit model for each available data set.
For completeness, we also checked the background spectra, which show that the noise level is negligible over the whole energy range. Again, as an example, we present the background spectrum of the XMM-Newton 0554920301 dataset in Fig. 3. This further increases the robustness of our analysis.
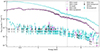 |
Fig. 3. Comparison between the Mrk 1018 0.3−10 keV spectrum and the background level for the XMM 2008 observation (ID: 0554920301). The color-coding is the same as in Fig. 2. The background is negligible across the whole energy band for all cameras. |
We produced the confidence contours for the warm corona temperature against ΓWC (left panel of Fig. 4), and find that the datasets for each state are very isolated in the parameter space, with the exception of the Chandra 12868 observation. This is the observation that is the most heavily affected by pileup, and therefore the corresponding spectrum must be interpreted with caution (see Sect. 4.2 for further discussion).
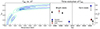 |
Fig. 4. WC properties of Mrk 1018. Left panel: confidence intervals of ΓWC vs. the warm corona temperature. Contour levels corresponds to confidence of 68%, 90%, and 99%. Dashed lines are used for the data related to the faint state, while solid lines correspond to the observations acquired during the bright state. Right panel: time evolution of ΓWC. Symbols and colors correspond to different telescopes: the blue squares are Chandra data, the black circles are XMM-Newton, the green stars are NuSTAR, and the red diamonds are Swift-XRT. The first data point of Chandra corresponds to observation 12868, which is heavily affected by pileup. The vertical dashed black line denotes the separation between the bright and the faint state. |
3.2. Optical, UV, and X-ray photometry
We used the optical and UV fluxes provided by the data reduction process of XMM-OM and Swift-UVOT observations and the 0.5−10 keV fluxes retrieved from the best fits of the X-ray spectra to study the photometric properties of Mrk 1018 between the two states. By plotting all the measurements (see Fig. 5), it is evident that the brightness of Mrk 1018 exhibits variability – which is sometimes dramatic – in all bands, as reported in Tables 2 and 3, and summarized in Table 5.
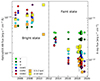 |
Fig. 5. Optical, UV, and X-ray evolution of Mrk 1018 photometry from 2005 to 2019. Values are reported in Tables 2 and 3. The scales are different: the y-scale on the left is related to the optical/UV fluxes, while the scale on the right is related to the X-ray emission. The X-ray points are labeled with orange and yellow squares for the 0.5−2 keV and 2−10 keV bands, respectively. Each optical/UV filter is marked with circles of different color: V in green, B in dark green, U in cyan, UVW1 in blue, UVM2 in purple, and UVW2 in red. The vertical black dashed line distinguishes between the bright and the faint state. |
Broad-band variability of Mrk 1018.
We checked whether or not the UV and X-ray flux variations are correlated, as we would expect also from the well-known AGN relation between the luminosity at 2500 Å and at 2 keV (e.g., Zamorani et al. 1981; Strateva et al. 2005; Lusso et al. 2010). The interplay between UV and X-ray is parameterized by the spectral index αox defined as9
 (3)
(3)
We took advantage of the Swift-UVOT UVW1 filter to compute αox, because it is the one with the closest effective wavelength (νλeff) to 2500 Å. F2500 was estimated under the assumption that Fν ∝ ν−0.5 (Vanden Berk et al. 2001):
 (4)
(4)
Instead, F2 keV was extrapolated from the primary power-law normalization, that is, the flux at 1 keV, using:
 (5)
(5)
The time evolution of αox shows a slight increase in the value between the bright and faint state, going from −1.38 ± 0.02 to −1.18 ± 0.04 (see also Fig. 6 and Table 6). This means that the UV/X-ray ratio becomes smaller. We also note that the variation of αox reported with the red points in Fig. 6 is consistent with the relation found by Nanni et al. (2017) between αox and L2500:
 (6)
(6)
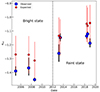 |
Fig. 6. Comparison between Mrk 1018 observed (blue) and expected (red) spectral index αox over the 14 years of observations presented in this paper. The vertical black dashed line denotes the separation between the bright and the faint state. The uncertainties on the expected value of αox were calculated by applying a propagation of the uncertainties formula in Eq. (6). |
Mrk 1018 observed and expected value for the optical/UV to X-ray flux ratio parameter αox.
This supports the hypothesis that the X-ray emission is responding to a reduction in the UV. Furthermore, this result allows us to speculate that something is happening in Mrk 1018 at the level of the accretion disk, because the UV photons come mainly from that region.
As discussed in the following sections, by combining our large amount of data with models reported in the literature, we not only robustly conclude that the changing-look behavior of Mrk 1018 is indeed likely due to a change in the state of the inner accretion flow, but we also push our interpretation even further, and reveal, for the first time, the complexity of the mechanisms leading to such variations.
4. Discussion
4.1. The hot corona
Figure 1 shows the temporal evolution of ΓHC with respect to both the normalization of the HC component (left panel) and time (right panel). Over the course of the analyzed 14 year period, ΓHC has remained nearly constant, indicating minimal variation in the interplay between the hot corona and the accretion disk (Haardt & Maraschi 1991; Alston et al. 2023). However, there is substantial variation in the normalization of the power law, with a decrease of a factor of about 10. This dimming of the coronal emission is likely caused by the fainter flux of UV seed photons, as suggested by our analysis of αox, which in turn is probably related to a lower accretion rate rather than a significant increase in the line-of-sight column density.
Indeed, adding an absorption term to model (2) resulted in a negligible obscuration. A recent investigation of the ultrahard X-ray light curve using Swift-BAT (Temple et al. 2023) demonstrated a gradual decline (from ∼1 mCrab to < 0.1 mCrab) in the 14−195 keV flux over a 13 year timescale, which is unrelated to an increasing column density along the line of sight. Other studies also reached the conclusion that an eclipsing event is likely not the origin of the changing-look behavior in Mrk 1018 (McElroy et al. 2016; Husemann et al. 2016; LaMassa et al. 2017; Noda & Done 2018; Hutsemékers et al. 2020; Brogan et al. 2023).
4.2. The warm corona
Figure 4 illustrates notable differences in ΓWC between the bright (ΓWC ∼ 2.6) and faint state (ΓWC ∼ 1.6). The flattening of the WC power law indicates that the soft X-ray emission (E < 2 keV) has dimmed more than the hard one during the state-transition. In other words, the X-ray spectrum became harder, as confirmed by the evolution of the hardness ratio
 (7)
(7)
that went from 0.2 ± 0.1 during the bright state to 0.4 ± 0.1. We will return to this in Sect. 4.4.
Figure 4 also reveals important variations in the warm corona temperature, which decreases from ∼0.4 keV to ∼0.2 keV. These changes strongly suggest a potential connection between the changing-look behavior of Mrk 1018 and the properties of the WC medium.
Intriguingly, Chandra observation 12868 captured Mrk 1018 in the bright state, yet the warm corona temperature is similar to those observed during the faint state (see Table 4). This might imply that the cooling of the warm corona occurred within a time interval of less than two years, as the spectrum of the 2008 XMM-Newton observation (obsID: 0554920301) was adequately described by a warm corona with a temperature of ∼0.4 keV. The results presented so far suggest the existence of a physical process capable of cooling the warm corona; the nature of this process is an open question.
4.3. The role of magnetic fields
Previous studies proposed that the physical mechanism governing the corona temperature is likely correlated with magnetic fields (Merloni & Fabian 2001; Reeves et al. 2002; Fabian et al. 2015). Therefore, the observed cooling of the warm corona between the two states may be a consequence of the weakening of the magnetic intensity.
In this scenario (see Ferreira 2003 for the mathematical derivation, and Ferreira et al. 2006; Marcel et al. 2018a,b, 2019, 2020 for its applications to stellar-mass black hole X-ray binaries), the lines of the magnetic field in the accretion disk are oriented vertically with respect to the disk plane. As the disk is rotating, a torque is applied to the lines, making them bend horizontally. In turn, this bending generates another torque acting radially, bringing mass inward. Here, the viscous timescale is effectively reduced, and the stronger the magnetic field, the stronger the radial torque and the lower the timescale for accretion.
Applying this model to Mrk 1018 results not only in a reduced intensity of the magnetic field between the bright and the faint state, but also in a natural explanation of the very short timescale (∼10 years) for the variability (Feng et al. 2021). Therefore, this discussion strongly suggests the magnetic fields are responsible for the photometric variations observed in this source: as these magnetic fields weaken, the radial torque becomes less significant, and the radial inflow diminishes. The result is a decrease in the UV luminosity emitted by the AGN, which strongly correlates with the accretion rate. The dimming in UV luminosity in turn reduces the number of seed photons available for the HC, leading to fainter X-ray emission. By invoking the magnetic field, we are able to explain with a single physical mechanism the broad-band photometric variability of Mrk 1018.
4.4. The changing-state accretion disk
There are still two open questions that we need to answer. The first refers to the mechanism behind the spectral variability, and the second to that causing the weakening of the magnetic fields. Both questions might be answered by arguing that the changing-look behavior of Mrk 1018 is due to a changing-state accretion disk. This idea has already been proposed, for example by Noda & Done (2018) and Dexter & Begelman (2019) for this source, and by Stern et al. (2018) for the CL-AGN WISE J105203.55+151929.5, and we believe our analysis reveals another element in favor of this interpretation.
Indeed, the lower X-ray hardness ratio of Mrk 1018 during the bright state compared to during the faint state (see Sect. 4.2) remarkably resembles the behavior of stellar-mass black hole X-ray binaries when they evolve from an active to a quiescent phase (e.g., Fender et al. 2004; Petrucci et al. 2008; Begelman & Armitage 2014). In this transition, the accretion disk changes its state from a geometrically thin, optically thick structure (Shakura-Sunyaev disk (SSD); Shakura & Sunyaev 1973) to a geometrically thick, optically thin flow (advective dominated accretion flow (ADAF); Narayan et al. 1996). In an ADAF, the energy is primarily released through the formation of a jet (Rees et al. 1982; Narayan & Yi 1995; Narayan et al. 1996; Yuan & Narayan 2004; Yuan et al. 2009; Taam et al. 2012), which removes magnetic energy from the system and effectively weakens the magnetic fields. We argue that this transition is occurring in the inner part of the accretion flow, because in the faint state the hard X-ray spectral shape is unchanged.
Therefore, we are now able to explain both the spectral and the photometric variability of Mrk 1018: the transition of the accretion disk from a fully SSD to an outer SSD with an inner ADAF changes the mode of energy release in the inner accretion flow, which now occurs primarily in the form of a jet. The jet extracts magnetic energy from the system, reducing the intensity of the magnetic fields.
From this, two main outcomes can be derived. First, the warm corona cools down, and the soft X-ray emission is no longer fully supported by it, causing the 0.5−2 keV flux to drop. Second, the weaker magnetic fields lower the accretion rate, leading to the broad-band dimming of the AGN as described at the end of Sect. 4.3. The former is likely the origin of the observed X-ray spectral variability observed through the comparison of the hardness ratio.
The changing-state accretion disk scenario might also explain the optical spectral variability, that is, the type 1 to type 2 transition. McElroy et al. (2016) argued that the observed disappearance of the broad optical lines could be potentially related to the alteration of the BLR structure and kinematics due to a binary SMBH system. However, based on our results, we believe that it is instead the presence of a jet that is affecting the BLR properties. Nevertheless, even our conclusion in this regard requires further data for confirmation.
5. Confirming the state transition of the disk
To validate the hypothesis that the changing-look events observed in Mrk 1018 can be attributed to the transition of the accretion disk from a fully radiative flow to a “quasi-radiative” disk with an inner advective region and vice versa, we performed a spectral energy distribution (SED) fit. This kind of analysis has already been carried out by Noda & Done (2018), but the results of these authors were limited by their small sample size. Instead, we can rely on a much larger set of data points, that is, in terms of energy range (we have the > 10 keV measurements provided by NuSTAR, which were not available when Noda & Done (2018) carried out their analysis), temporal coverage (2005 to 2019 in comparison to their 2008 to 2016), and statistics.
5.1. SED fitting
The SED fit incorporates optical/UV spectral points10 obtained from all XMM-OM observations and from the combined Swift-UVOT images (see Sect. 2.6), along with the majority of the X-ray data listed in Table 2. We left Chandra ObsID 12868 out of the fitting because the source might have been captured at the beginning of the state transition (see the discussion in Sect. 4.2), and Swift-XRT datasets 00049654001 and 00049654002 were also not included because these were obtained during the transition.
We simultaneously fitted the SED of each state using the XSPEC model AGNSED (Narayan & Yi 1995; Kubota & Done 2018). To reduce degeneracy and facilitate the fitting procedure, certain parameters were fixed to standard values. These include setting the dimensionless black hole spin to zero, the cosine of the inclination angle for the WC to 0.5, the hot corona temperature to 100 keV, the outer radius of the disk to the self-gravity radius, the upper limit of the scale height for the hot corona to the default value of 10 gravitational radii ( ), and the normalization to 1 (internally computed).
The free parameters are therefore the SMBH mass, the accretion rate normalized to the Eddington ratio  , the warm corona temperature and radius, the hot corona radius, and the spectral indexes for the WC and HC power laws. Additionally, we incorporated the Fe Kα transition line, the normalization of which was left free to vary while the width and the rest-frame energy were fixed at 0.01 keV and 6.4 keV, respectively; a dereddening factor of E(B − V) = 0.372 (Noda & Done 2018); the photoelectric absorption from the Milky Way gas, and a constant for each X-ray spectrum. This last term accounts for intrinsic flux differences between observations taken at significantly different times. The best-fit values of the physical parameters of the model are reported in Table 7, and a plot showing the SED in both states is provided in Fig. 7.
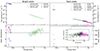 |
Fig. 7. Mrk 1018 optical-to-X-ray SED. Top left panel: SED for the bright state. Swift-XRT data are reported in green, those from Swift-UVOT in red, and XMM-OM in blue. The best-fit model for each telescope is reported using the bold lines (in corresponding colors). XMM-Newton data are not shown to avoid overcrowding. Bottom left panel: residuals, expressed in terms of (data-model)/error, for the model described in Sect. 5.1. The horizontal dashed black line indicates the 0-level. Top right panel and bottom right panel: same as in the left panel, but now the data and residuals refers to the faint state. NuSTAR points are given in magenta, while Chandra in black. Y-axis scale is the same for the top panels, allowing for a direct comparison between the two states. The optical/UV points for the faint state are not fitted to the model, as the fit would otherwise be unconstrained. The residuals for the X-ray points are in the range ±5, as shown in the inset panel. |
Best-fit result for the model AGNSED.
5.2. The bright state: An SSD disk
The best fit to the bright state of Mrk 1018 (left panels of Fig. 7) confirms that, during that period around the SMBH, there was an inner HC region extending up to ∼20 Rg, a WC structure (kT ∼ 0.46 keV) with a size of ∼65 Rg, and an SSD. The spectral index for the WC (ΓWC ∼ 2.64) and the HC (ΓHC ∼ 1.71), as well as the temperature of the WC region, align with the values obtained from our previous spectral analysis (see Sect. 3.1), confirming the reliability of our best-fit model.
The estimated SMBH mass of ∼9.7 × 10⁷ M⊙ is consistent with the estimates reported in the literature (see, e.g., Table 1). Additionally, we determined the Eddington ratio by calculating the bolometric luminosity at 3000 Å, as measured from the Swift-UVOT UVW1 filter flux density:
 (8)
(8)
where 0.75 is the correction factor accounting for the viewing angle of the accretion disk (Runnoe et al. 2012), 5.18 is the bolometric factor as retrieved from Table 1 of Runnoe et al. (2012), and DL is the luminosity distance. The conversion from the effective wavelength of the UVW1 filter to 3000 Å was performed using Eq. (4). By plugging DL = 183.5 Mpc, we obtained μ = 0.04 ± 0.01 for the bright state, which closely aligns with our best-fit value.
Based on the Eddington ratio, we conclude that during the bright state, the accretion disk in Mrk 1018 exhibited characteristics of a geometrically thin, optically thick accretion flow. This is supported by μ exceeding the critical value of μc = 0.02 (Kubota & Done 2018). We note that for the bright state, μ ∼ μc, promoting the idea suggested by Noda & Done (2018) that CL-AGN accrete close to μc. Furthermore, the observed value of ΓHC ∼ 1.7 indicates that the accretion disk in the bright state is likely truncated at the boundary of the inner hot corona (refer to Fig. 6 of Kubota & Done 2018), again leaving no space for an inner ADAF.
5.3. The faint state: An SSD + ADAF disk
We attempted to fit the SED of the faint state of Mrk 1018, with limited success. We observed that the optical/UV points in the SED were significantly overestimated, while the X-ray data points provided better constraints, although the  was still ≫1 for the whole dataset. Consequently, we decided to apply our model exclusively to the X-ray spectra. This choice has no impact on the conclusions presented in Sect. 3.2 about αox. Indeed, αox is a measure of the correlation between the UV and X-ray flux, and is not an indicator of the underlying spectral shape between the 2500 Å and 2 keV flux. In other words, αox tells us whether or not the UV and X-ray emission are related, but not how.
As the fitting was still not converging, we fixed the SMBH mass and the hot corona properties to the best-fit values obtained for the bright state of Mrk 1018. This assumption is motivated by the physical reasoning that no variations occurred either in the SMBH or the hot corona between the two states. Our method yields a good-quality fit with a  ∼ 1.06.
When we incorporated the optical/UV points into the best-fit model, they were once again found to be highly overestimated ( > 104, see right panels of Fig. 7). This indicates that the optical/UV emission no longer originates from a radiative disk because is considerably fainter than what is predicted by the model AGNSED, which assumes a radiative disk. Indeed, the Eddington ratios derived from both the fit (μ = 0.011 ± 0.001) and the bolometric luminosity (μ = 0.005 ± 0.001) are subcritical, meaning the accretion flow is expected to be (partially) advective.
If a portion of the flow is no longer efficiently cooling, the majority of the energy is released through a jet, as proposed by various studies (Rees et al. 1982; Narayan & Yi 1995; Narayan et al. 1996; Yuan & Narayan 2004; Yuan et al. 2009; Taam et al. 2012). Consequently, the peak of emission from this medium shifts to longer wavelengths instead of the optical/UV band. As already anticipated, this state transition is likely occurring in a small region of the accretion flow, probably the inner part. The results from the Chandra observation (ObsID: 12868) discussed in Sect. 4.2 could support this view. This latter observation is best described by an SSD but with a cooler WC region. As the WC medium is likely localized in the inner part of the accretion flow, the observation was probably taken when the inner ADAF was formed but the HC and the outer SSD had not fully responded to that transition.
Our in-depth analysis has finally managed to confirm the idea proposed by Noda & Done (2018) that the changing-look behavior of Mrk 1018 is triggered by a state transition of its (inner) accretion flow. In the following section, we provide further elements that support this conclusion.
5.4. Elements in favor of a state transition of the disk
A study conducted on Centaurus A using NuSTAR and XMM-Newton by Fürst et al. (2016) concluded that the high-energy spectrum (E > 10 keV) could be indicative of the accretion mode: a simple power law (or a single Comptonization component) suggests the presence of an inner ADAF. Indeed, if the accretion disk is entirely geometrically thin, we would expect to see the Compton hump at E > 10 keV due to the soft X-ray photons of the hot corona being reflected from the accretion disk (Magdziarz & Zdziarski 1995). However, if the inner accretion flow is puffed up, it can eclipse the hot corona and the reflection can no longer take place. The Compton hump disappears and the high-energy spectrum is described by only the Comptonization component. Our analysis of the faint state of Mrk 1018 indicates that a single Comptonization component is sufficient to fit the NuSTAR spectra, as shown in Table 4, and that there is no need for a reflection factor. However, the lack of NuSTAR observations during the bright state limits our ability to draw firm conclusions.
Another element supporting the state transition is provided by the polarimetry analysis of Hutsemékers et al. (2020). These authors compare the polarimetric properties of the broad Hα and Hβ in the bright and faint state of the AGN, and obtain intriguing results. First of all, the continuum polarization did not change significantly, and it was even slightly higher in the bright state, again disfavoring the hypothesis of an increasing line-of-sight column density as the source of the AGN variability. Secondly, the polarization signatures of a binary SMBH system (Savić et al. 2019; Savić 2019) were not observed. Lastly, the authors speculated that the asymmetric polarization profile of Hα and the lack of rotation in the polarization angle may suggest that the broad Hα is produced in a polar outflow. We think that this conclusion could support the interpretation of Chen et al. (2021), who propose the possible presence of magnetic outflows in the disk originating from the transition of the inner accretion flow into an ADAF.
Brogan et al. (2023) reported a remarkable outburst event in 2020, where the fluxes in the u′-, c-, and o-band exhibited an extraordinary increase by factors of ∼12, 22, and 14, respectively. These authors ruled out a number of possibilities to explain this outburst, from reduction in the line-of-sight absorption to a tidal disruption event (TDE, Rees 1988; Phinney 1989), a warped accretion disk (Rees 1988; Phinney 1989), and a clumpy accretion flow (Natarajan & Pringle 1998; Raj & Nixon 2021). We think that this outburst might indicate the presence of an inner ADAF. Indeed, at the interface between the outer SSD and the ADAF, radiation pressure instabilities are expected to arise, leading to quasi-periodic outbursts spanning a range of amplitudes and timescales (Sniegowska et al. 2020). Long-scale monitoring of Mrk 1018 during its faint state could potentially confirm this conclusion.
Finally, recent Very Long Baseline Interferometry (VLBI) observations of this AGN (Walsh et al. 2023) show that the radio source associated with the nucleus has a proper motion that is inconsistent with a recoiling SMBH (Kim et al. 2018) or a binary SMBH (Husemann et al. 2016), but is likely consistent with an unresolved jet component, as expected from the changing-state accretion-disk scenario.
5.5. The triggering mechanism of the state transition
One last thing we need to do is to provide a comprehensive, physically reasonable process that is able to trigger the changing state of the accretion disk of Mrk 1018. The environment within a few parsecs of a SMBH is dense in gas, stars, and stellar remnants (Ostriker 1983; Syer et al. 1991; Artymowicz et al. 1993; Goodman & Tan 2004; Levin 2007; Nayakshin & Sunyaev 2007; McKernan et al. 2011a,b). Some of this material might enter the inner (< pc) region where the accretion disk is located (e.g., Bellovary et al. 2016; Stern et al. 2018). This can happen in a number of different ways.
For instance, the host galaxy of Mrk 1018 is likely a late-stage merger and in the case of a wet merger, gas is expected to lose angular momentum and feed the central SMBH (Volonteri & Rees 2005; Hopkins et al. 2006, 2008; Kormendy & Ho 2013; Gao et al. 2020). Another mechanism that can pull gas toward the accretion disk is cold chaotic accretion (CCA; Gaspari et al. 2013, 2017, 2020; Maccagni et al. 2021). In this model, multi-phase clouds condense in and outside the galactic halo and descend onto the central SMBH. Within distances of ∼1 to 100 parsecs from the SMBH, these clouds undergo inelastic collisions, shedding angular momentum and plunging onto the SMBH. Furthermore, dynamical friction is also able to cause massive objects – such as star clusters and gas clouds – to lose angular momentum and sink onto the innermost regions of the AGN (e.g., Chandrasekhar 1943a,b,c; Tremaine et al. 1975; Ostriker 1999).
We speculate that, for Mrk 1018, it was probably a gas cloud that caused the state transition. The reasoning behind this speculation is based on the duration of the bright state, which was too long to be caused by the disruption of a compact object (see, e.g., McElroy et al. 2016). We would like to note that a similar event is also plausible, namely where a cloud passes close (< pc) to a SMBH, as has been observed in our Galaxy (Valencia-S. et al. 2015). Furthermore, based on a statistically large sample of CL-AGN, Liu et al. (2021) proposed that cold-gas clumps can be formed stochastically in the fueling flow, and their episodic infall could lead to sharp peaks in the accretion-rate curve.
In the following, we try to explain how the close-by passage of a gas cloud can be the triggering mechanism for the state transition of the disk of Mrk 1018. Our hypothesis is schematized in the cartoon of Fig. 8. The close-by passage of such a cloud establishes an accretion flow (ηc) onto the accretion disk, which in turn is accreting onto the SMBH at a rate of η (panel a). If ηc > η, the mass coming from the cloud starts to accumulate in this region, puffing it up, because the matter has no other option than to extend vertically. The optical depth increases, and the energy produced through viscous friction is no more efficiently released (panel b). Therefore, the temperature in this region starts to increase, to the point that it induces a jump in the sound speed, enabling matter to move faster throughout the disk (see the discussion about H-ionization in Noda & Done 2018). As a result, in this region the local accretion rate (ηl) can become higher than η, triggering the instability of the subsequent innermost ring (panel c). If ηc ≫ η, this local instability can lead to a switch in the properties of the whole inner accretion flow, which becomes an ADAF (panel d).
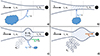 |
Fig. 8. Cartoon describing our proposed scenario to explain the broad-band spectro-photometric variability of Mrk 1018. The initial condition is an optically thick, geometrically thin disk with internal accretion (η), temperature (Td), and a magnetic field (Bd). A cloud pushed toward the center – the effect of a wet merger or cold chaotic accretion – passes nearby and starts to deposit gas at a given radius (denoted by the vertical dashed lines) at a rate of ηc (panel a). If ηc > η, the region in the disk where the gas from the cloud accretes starts to puff up. The energy produced via viscous friction is no more efficiently released and the temperature T suddenly rises (panel b). When T ≫ Td, the hot gas is accreted inward at a rate of ηl > η, triggering this instability in the adjacent inner ring (panel c). The energy starts to be released magnetically and the magnetic field (B) in this region decreases. If ηc ≫ η, this process extends to the whole inner accretion flow, making it optically thin and geometrically thick. The energy is released magnetically (Eb), likely in the form of a jet, drastically reducing the temperature of the gas and advecting the material onto the SMBH at a rate of ηa < η (panel d). |
This state transition has two outcomes (see discussion in Sects. 4.3 and 4.4): a number of different instabilities (Noda & Done 2018; Stern et al. 2018; Dexter & Begelman 2019; Sniegowska et al. 2020; Feng et al. 2021), which reduce the viscous timescale to the observed value of ∼10 years, and the formation of a jet (Rees et al. 1982; Narayan & Yi 1995; Narayan et al. 1996; Yuan & Narayan 2004; Yuan et al. 2009; Taam et al. 2012), which weakens the magnetic fields and interacts with the surrounding environment, producing the broad-band spectro-photometric variability of Mrk 1018, including the type 1 to type 2 evolution.
We would like to stress that our speculative scenario is also qualitative. Factors that must be considered in order to confirm that a close-by passage of a gas cloud could trigger a state transition of the accretion disk include the mass of such a cloud, its dynamics with respect to the accretion disk, and its density. Finding optimal choices for these parameters is beyond the scope of this work and would require extensive simulations; these could be the subject of a follow-up study.
We must also point out that the idea described above might only be relevant for AGN that are accreting very close to the critical Eddington ratio μ = 0.02 (Kubota & Done 2018). Indeed, for μ ≫ 0.02 (radiative) and μ ≪ 0.02 (jetted) AGN, the accretion disk is in equilibrium for its particular configuration (SSD for radiative AGN, and SSD+ADAF or ADAF for jetted AGN) and any small perturbation will not produce any relevant variability in their emission. However, for AGN accreting close to μ = 0.02, even a tiny perturbation of the accretion rate might trigger a state transition and changing-look behavior. This could also explain the rarity of CL-AGN.
6. Conclusions
In this study, we conducted a comprehensive investigation of the changing-look AGN Mrk 1018 using an extensive dataset comprising optical, UV, and X-ray spectro-photometric measurements (Sect. 2). By performing a meticulous and systematic analysis of the X-ray spectra (Sect. 3.1), broad-band photometry (Sect. 3.2), and optical-to-X-ray SED fitting (Sect. 5.1), we arrive at a compelling conclusion regarding the nature of not only the variability of Mrk 1018, but possibly the changing-look phenomenon in general.
The changing-look behavior is likely due to a state transition of the inner region of the accretion flow, which becomes optically thin and radiatively inefficient, as described in Sect. 4.4. The formation of an inner ADAF leads to the internal energy being released through a jet, weakening the magnetic fields and establishing the spectro-photometric variability observed in Mrk 1018 (see Sects. 4.3 and 4.4). In particular, we speculate that this AGN – and possibly most of the other CL-AGN as well – differs from a “standard” AGN, because its intrinsic accretion rate is near the critical value of μ = 0.02, which separates the population of AGN into radiative and jetted. Therefore, any small perturbation to its accretion flow can potentially trigger the change of state in the inner part of the disk.
For Mrk 1018, we further explored a possible process that triggers the evolution of the accretion flow (Sect. 5.5). We propose that clouds of gas might be brought close (< pc) to the accretion disk by a galactic phenomenon (e.g., galactic friction Chandrasekhar 1943a,b,c; Tremaine et al. 1975; Ostriker 1999) and/or by an extragalactic process (a past merging event, Volonteri & Rees 2005; Hopkins et al. 2006, 2008; Kormendy & Ho 2013; Gao et al. 2020; CCA, Gaspari et al. 2013, 2017, 2020; Maccagni et al. 2021). When one of these gaseous structures passes near the accretion disk, as has been observed in our own Galaxy (Valencia-S. et al. 2015), it gets disrupted and its material accumulates within the disk. If the accretion rate of the cloud onto the disk is greater than that of the disk onto the SMBH, a portion of the accretion flow puffs up, to the point that it changes into an ADAF.
The transition establishes instabilities (Noda & Done 2018; Stern et al. 2018; Dexter & Begelman 2019; Sniegowska et al. 2020; Feng et al. 2021) that reduce the viscous timescale to ∼10 years. Moreover, the formation of a jet (Rees et al. 1982; Narayan & Yi 1995; Narayan et al. 1996; Yuan & Narayan 2004; Yuan et al. 2009; Taam et al. 2012) produces the observed broad-band spectro-photometric variability. In particular, the optical-to-X-ray dimming and the change in the X-ray hardness ratio are likely due to the disk being magnetized (Ferreira 2003; Ferreira et al. 2006; Marcel et al. 2018a,b, 2019, 2020). There is also some evidence in the literature supporting the hypothesis of a state transition of the inner accretion flow (Fürst et al. 2016; Hutsemékers et al. 2020; Brogan et al. 2023; Walsh et al. 2023).
Overall, our study suggests that the changing-look behavior exhibited by Mrk 1018, and maybe that of the majority of CL-AGN, can be attributed to galactic or extragalactic (≫kpc scale) phenomena, such as mergers and/or CCA, coupled with processes happening at the level of the accretion disk (subparsec scale), for example involving the intrinsic critical accretion rate (μ ∼ 0.02) and/or magnetic fields. These findings provide significant insights into the physics driving CL-AGN and highlight the importance of considering not only the innermost regions of an AGN, but also its wider host galaxy and even further to the extragalactic environment in order to understand the complexity of the processes driving AGN activity.
Moreover, our results suggest that accretion in stellar-mass black hole X-ray binaries and in AGN might be explained with the same physics, as the magnetized disk model was developed for X-ray binaries (e.g., Ferreira 2003). In other words, accretion onto a black hole could be described in the same way for a stellar black hole or a SMBH, spanning about eight orders of magnitude in mass. If correct, this would not only change the way we try to understand such phenomena, but would also mean that we can explore AGN physics with high-signal-to-noise-ratio observations of nearby X-ray binaries and vice versa.
7. Future prospects
Although our conclusions are supported by observational and theoretical evidence, there are still several crucial steps that need to be taken in order to validate the proposed scenario. If the AGN were indeed undergoing inefficient accretion, a significant portion of the released energy would manifest in the form of a relativistic jet. Recent VLBI observations of Mrk 1018 (Walsh et al. 2023) have led to speculation over the presence of a jet, but further high-resolution (< 1 mas, i.e., subparsec) data are needed to confirm that the disappearing of the broad optical lines is due to the interaction between the hypothetic jet and the surrounding BLR.
The short-term variability observed over a span of ∼10 years suggests that the jet could have persisted for a few decades, expanding to a maximum size of 6 parsecs from the central SMBH. If we were to assume that this changing-look behavior occurred throughout the entire AGN lifetime of ∼105 years (Schawinski et al. 2015), we would expect to observe the presence of ∼103 − 104 “mini-jets” expanding within the galaxy. The interaction of these mini-jets with the molecular gas in the host galaxy could be explored by investigating potential outflows or winds (Oosterloo et al. 2007; Morganti et al. 2015, 2021; Wagner et al. 2016; Murthy et al. 2019; Maccagni et al. 2021).
As a past wet merging event and/or CCA could be the primary factor behind the changing-look phenomenon observed in Mrk 1018, it becomes imperative that we obtain high-resolution data, both spatially and spectrally, concerning the multi-phase gas distribution within and around this galaxy. While MUSE observation taken in 2015 will provide insights into the ionized gas component, our understanding of the host galaxy remains limited. To comprehensively investigate this scenario and confirm the importance of mergers and CCA for Mrk 1018, and maybe for other CL-AGN, it is essential to trace the molecular gas using the Atacama Large Millimeter/submillimeter Array (ALMA, Wootten & Thompson 2009), as well as to examine the distribution of neutral hydrogen and the radio continuum emission with the Karoo Radio Telescope (MeerKAT, Jonas & MeerKAT Team 2016). These two telescopes offer the necessary angular (∼1″, i.e., ∼1 kpc) and spectral resolution (< 5 km s−1) required for such in-depth exploration.
The second ingredient contributing to the description of the changing-look behavior of Mrk 1018 relates to its intrinsic accretion rate, which appears to be in proximity of the critical value μ = 0.02. If this parameter indeed plays a pivotal role in triggering the changing-look phenomenon, it stands to reason that a substantial proportion of CL-AGN should also exhibit accretion rates close to μ = 0.02. To ascertain the validity of this hypothesis, a rigorous statistical analysis involving a large sample of CL-AGN becomes indispensable.
Another crucial aspect that requires attention is the development of a comprehensive model for the broad-band spectrum of an AGN with the proposed properties exhibited by Mrk 1018. This model should incorporate an outer optically thick and geometrically thin accretion disk overlaid with a WC medium, as well as an inner optically thin and geometrically thick flow accompanied by a HC medium surrounding the SMBH. Additionally, the potential presence of a jet must be considered in the model. Interestingly, a valid candidate comes again from the studies of X-ray binaries: the physically motivated jet-emitting disk-standard accretion disk (JED-SAD, Petrucci et al. 2008; Marcel et al. 2018a,b) model was tentatively applied to AGN by Ursini et al. (2020), but the lack of a direct observation of the jet limited their interpretation. Combining this modeling with high-resolution VLBI experiments that can probe the presence of a jet during this faint state of Mrk 1018 might be the missing piece of the puzzle required to understand the spectral characteristics and physical processes at play in Mrk 1018 and in CL-AGN. The hypothesis presented in Sect. 5.5 is speculative and qualitative. It is imperative to develop numerical simulations of the interaction between a gaseous cloud and an accretion disk in order to understand wether or not our speculation is feasible and under what conditions.
Finally, if confirmed, our proposed scenario that a large-scale (≫kpc) process – such as a galactic merger and/or CCA – is a prompt for the state transition of CL-AGN accretion disks can be used as a starting point to insert CL-AGN into the current understanding of AGN feeding and feedback (Ciotti & Ostriker 2007; Cattaneo et al. 2009; Alexander & Hickox 2012; Fabian 2012; Yuan & Narayan 2014; Harrison 2017; Morganti 2017), which is still missing these rare but intriguing objects in its framework.
The observation 00049654004 was omitted because data were taken whilst the spacecraft or instruments were in an anomalous state (see https://www.swift.ac.uk/support/anomaly.php), while 00035776038 was excluded because the data were faulty.
The calibration files were downloaded from the XMM-Newton Science Archive.
The calibration parameters were automatically retrieved from the online HEASARC archive CALDB.
This parameter has not the same physical meaning of ΓHC. It is a mathematical representation that quantifies the steepness of the soft excess bump at energies < 2 keV.
αox is defined as negative according to Eq. (3).
The V, B, and U filters were not used extensively due to contamination from the host-galaxy emission.
Acknowledgments
We thank the anonymous referee for the constructive comments and the suggested improvements for the quality and clarity of this paper. This research has made use of data obtained from the Chandra Data Archive and the Chandra Source Catalog, and software provided by the Chandra X-ray Center (CXC) in the application packages CIAO and Sherpa. This research was based on observations obtained with XMM-Newton, an ESA science mission with instruments and contributions directly funded by ESA Member States and NASA. We acknowledge also the use of public data from the Swift data archive. This research has made use of the SIMBAD database, operated at CDS, Strasbourg, France. S.V. acknowledges G. Marcel for the insightful discussion about magnetized disks and the link between AGN and X-ray binaries, and M. Trebitsch for useful comments about timescales. P.S. and C.V. acknowledge financial contribution from Bando Ricerca Fondamentale INAF 2022 Large Grant “Dual and binary supermassive black holes in the multi-messenger era: from galaxy mergers to gravitational waves”. This work has received funding from the European Research Council (ERC) under the European Union’s Horizon 2020 research and innovation programme (grant agreement No. 882793 “MeerGas”).
References
- Ahn, C. P., Alexandroff, R., Allende Prieto, C., et al. 2012, ApJS, 203, 21 [Google Scholar]
- Alexander, D. M., & Hickox, R. C. 2012, New Astron. Rev., 56, 93 [Google Scholar]
- Alston, W., Giustini, M., & Petrucci, P. O. 2023, in Handbook of X-ray and Gamma-ray Astrophysics, eds. C. Bambi, & A. Santangelo, 135 [Google Scholar]
- Antonucci, R. 1993, ARA&A, 31, 473 [Google Scholar]
- Arnaud, K. A. 1996, in Astronomical Data Analysis Software and Systems V, eds. G. H. Jacoby, & J. Barnes, ASP Conf. Ser., 101, 17 [NASA ADS] [Google Scholar]
- Artymowicz, P., Lin, D. N. C., & Wampler, E. J. 1993, ApJ, 409, 592 [NASA ADS] [CrossRef] [Google Scholar]
- Avni, Y. 1976, ApJ, 210, 642 [NASA ADS] [CrossRef] [Google Scholar]
- Begelman, M. C., & Armitage, P. J. 2014, ApJ, 782, L18 [NASA ADS] [CrossRef] [Google Scholar]
- Bellovary, J. M., Mac Low, M.-M., McKernan, B., & Ford, K. E. S. 2016, ApJ, 819, L17 [NASA ADS] [CrossRef] [Google Scholar]
- Brogan, R., Krumpe, M., Homan, D., et al. 2023, A&A, 677, A116 [NASA ADS] [CrossRef] [EDP Sciences] [Google Scholar]
- Brout, D., Scolnic, D., Popovic, B., et al. 2022, ApJ, 938, 110 [NASA ADS] [CrossRef] [Google Scholar]
- Cattaneo, A., Faber, S. M., Binney, J., et al. 2009, Nature, 460, 213 [NASA ADS] [CrossRef] [Google Scholar]
- Chandrasekhar, S. 1943a, ApJ, 97, 255 [Google Scholar]
- Chandrasekhar, S. 1943b, ApJ, 97, 263 [NASA ADS] [CrossRef] [Google Scholar]
- Chandrasekhar, S. 1943c, ApJ, 98, 54 [NASA ADS] [CrossRef] [Google Scholar]
- Chen, Q., Meyer, M., Popping, A., et al. 2021, MNRAS, 508, 2758 [NASA ADS] [CrossRef] [Google Scholar]
- Ciotti, L., & Ostriker, J. P. 2007, ApJ, 665, 1038 [NASA ADS] [CrossRef] [Google Scholar]
- Cohen, R. D., Rudy, R. J., Puetter, R. C., Ake, T. B., & Foltz, C. B. 1986, ApJ, 311, 135 [NASA ADS] [CrossRef] [Google Scholar]
- Czerny, B., & Elvis, M. 1987, ApJ, 321, 305 [NASA ADS] [CrossRef] [Google Scholar]
- Dexter, J., & Begelman, M. C. 2019, MNRAS, 483, L17 [NASA ADS] [CrossRef] [Google Scholar]
- Dexter, J., Xin, S., Shen, Y., et al. 2019, ApJ, 885, 44 [NASA ADS] [CrossRef] [Google Scholar]
- Done, C., Davis, S. W., Jin, C., Blaes, O., & Ward, M. 2012, MNRAS, 420, 1848 [Google Scholar]
- Fabian, A. C. 2012, ARA&A, 50, 455 [Google Scholar]
- Fabian, A. C., Lohfink, A., Kara, E., et al. 2015, MNRAS, 451, 4375 [Google Scholar]
- Fender, R. P., Belloni, T. M., & Gallo, E. 2004, MNRAS, 355, 1105 [NASA ADS] [CrossRef] [Google Scholar]
- Feng, J., Cao, X., Li, J.-W., & Gu, W.-M. 2021, ApJ, 916, 61 [NASA ADS] [CrossRef] [Google Scholar]
- Ferreira, J. 2003, ArXiv e-prints [arXiv:astro-ph/0311621] [Google Scholar]
- Ferreira, J., Petrucci, P. O., Henri, G., Saugé, L., & Pelletier, G. 2006, A&A, 447, 813 [NASA ADS] [CrossRef] [EDP Sciences] [Google Scholar]
- Fürst, F., Müller, C., Madsen, K. K., et al. 2016, ApJ, 819, 150 [CrossRef] [Google Scholar]
- Fruscione, A., McDowell, J. C., Allen, G. E., et al. 2006, in Society of Photo-Optical Instrumentation Engineers (SPIE) Conference Series, eds. D. R. Silva, & R. E. Doxsey, 6270, 62701V [NASA ADS] [Google Scholar]
- Gabriel, C., Denby, M., Fyfe, D. J., et al. 2004, in Astronomical Data Analysis Software and Systems (ADASS) XIII, eds. F. Ochsenbein, M. G. Allen, & D. Egret, ASP Conf. Ser., 314, 759 [NASA ADS] [Google Scholar]
- Gaia Collaboration 2020, VizieR Online Data Catalog: I/350 [Google Scholar]
- Gao, F., Wang, L., Pearson, W. J., et al. 2020, A&A, 637, A94 [NASA ADS] [CrossRef] [EDP Sciences] [Google Scholar]
- Gaspari, M., Ruszkowski, M., & Oh, S. P. 2013, MNRAS, 432, 3401 [NASA ADS] [CrossRef] [Google Scholar]
- Gaspari, M., Temi, P., & Brighenti, F. 2017, MNRAS, 466, 677 [Google Scholar]
- Gaspari, M., Tombesi, F., & Cappi, M. 2020, Nat. Astron., 4, 10 [Google Scholar]
- Gezari, S., Hung, T., Cenko, S. B., et al. 2017, ApJ, 835, 144 [Google Scholar]
- Goodman, J., & Tan, J. C. 2004, ApJ, 608, 108 [NASA ADS] [CrossRef] [Google Scholar]
- Goodrich, R. W. 1989, ApJ, 340, 190 [NASA ADS] [CrossRef] [Google Scholar]
- Graham, M. J., Ross, N. P., Stern, D., et al. 2020, MNRAS, 491, 4925 [NASA ADS] [Google Scholar]
- Haardt, F., & Maraschi, L. 1991, ApJ, 380, L51 [Google Scholar]
- Harrison, C. M. 2017, Nat. Astron., 1, 0165 [NASA ADS] [CrossRef] [Google Scholar]
- Harrison, F. A., Craig, W. W., Christensen, F. E., et al. 2013, ApJ, 770, 103 [Google Scholar]
- HI4PI Collaboration (Ben Bekhti, N., et al.) 2016, A&A, 594, A116 [NASA ADS] [CrossRef] [EDP Sciences] [Google Scholar]
- Hopkins, P. F., Somerville, R. S., Hernquist, L., et al. 2006, ApJ, 652, 864 [NASA ADS] [CrossRef] [Google Scholar]
- Hopkins, P. F., Hernquist, L., Cox, T. J., & Kereš, D. 2008, ApJS, 175, 356 [Google Scholar]
- Husemann, B., Urrutia, T., Tremblay, G. R., et al. 2016, A&A, 593, L9 [NASA ADS] [CrossRef] [EDP Sciences] [Google Scholar]
- Hutsemékers, D., Agís González, B., Marin, F., & Sluse, D. 2020, A&A, 644, L5 [NASA ADS] [CrossRef] [EDP Sciences] [Google Scholar]
- Jansen, F., Lumb, D., Altieri, B., et al. 2001, A&A, 365, L1 [NASA ADS] [CrossRef] [EDP Sciences] [Google Scholar]
- Jin, C., Ward, M., & Done, C. 2012, MNRAS, 425, 907 [NASA ADS] [CrossRef] [Google Scholar]
- Jonas, J., & MeerKAT Team 2016, MeerKAT Science: On the Pathway to the SKA, 1 [Google Scholar]
- Kawanaka, N., & Mineshige, S. 2023, ArXiv e-prints [arXiv:2304.07463] [Google Scholar]
- Kim, D. C., Yoon, I., & Evans, A. S. 2018, ApJ, 861, 51 [NASA ADS] [CrossRef] [Google Scholar]
- Kormendy, J., & Ho, L. C. 2013, ARA&A, 51, 511 [Google Scholar]
- Koss, M., Mushotzky, R., Veilleux, S., et al. 2011, ApJ, 739, 57 [Google Scholar]
- Krumpe, M., Husemann, B., Tremblay, G. R., et al. 2017, A&A, 607, L9 [NASA ADS] [CrossRef] [EDP Sciences] [Google Scholar]
- Kubota, A., & Done, C. 2018, MNRAS, 480, 1247 [Google Scholar]
- LaMassa, S. M., Cales, S., Moran, E. C., et al. 2015, ApJ, 800, 144 [NASA ADS] [CrossRef] [Google Scholar]
- LaMassa, S. M., Yaqoob, T., & Kilgard, R. 2017, ApJ, 840, 11 [NASA ADS] [CrossRef] [Google Scholar]
- Levin, Y. 2007, MNRAS, 374, 515 [Google Scholar]
- Liedahl, D. A., Osterheld, A. L., & Goldstein, W. H. 1995, ApJ, 438, L115 [CrossRef] [Google Scholar]
- Liu, W.-J., Lira, P., Yao, S., et al. 2021, ApJ, 915, 63 [NASA ADS] [CrossRef] [Google Scholar]
- Lusso, E., Comastri, A., Vignali, C., et al. 2010, A&A, 512, A34 [NASA ADS] [CrossRef] [EDP Sciences] [Google Scholar]
- Lyu, B., Yan, Z., Yu, W., & Wu, Q. 2021, MNRAS, 506, 4188 [NASA ADS] [CrossRef] [Google Scholar]
- Maccagni, F. M., Serra, P., Gaspari, M., et al. 2021, A&A, 656, A45 [NASA ADS] [CrossRef] [EDP Sciences] [Google Scholar]
- MacLeod, C. L., Green, P. J., Anderson, S. F., et al. 2019, ApJ, 874, 8 [Google Scholar]
- Magdziarz, P., & Zdziarski, A. A. 1995, MNRAS, 273, 837 [Google Scholar]
- Marcel, G., Ferreira, J., Petrucci, P. O., et al. 2018a, A&A, 617, A46 [NASA ADS] [CrossRef] [EDP Sciences] [Google Scholar]
- Marcel, G., Ferreira, J., Petrucci, P. O., et al. 2018b, A&A, 615, A57 [NASA ADS] [CrossRef] [EDP Sciences] [Google Scholar]
- Marcel, G., Ferreira, J., Clavel, M., et al. 2019, A&A, 626, A115 [NASA ADS] [CrossRef] [EDP Sciences] [Google Scholar]
- Marcel, G., Cangemi, F., Rodriguez, J., et al. 2020, A&A, 640, A18 [EDP Sciences] [Google Scholar]
- Marchese, E., Braito, V., Della Ceca, R., Caccianiga, A., & Severgnini, P. 2012, MNRAS, 421, 1803 [NASA ADS] [CrossRef] [Google Scholar]
- Mason, K. O., Breeveld, A., Much, R., et al. 2001, A&A, 365, L36 [NASA ADS] [CrossRef] [EDP Sciences] [Google Scholar]
- McElroy, R. E., Husemann, B., Croom, S. M., et al. 2016, A&A, 593, L8 [NASA ADS] [CrossRef] [EDP Sciences] [Google Scholar]
- McKernan, B., Ford, K. E. S., Lyra, W., et al. 2011a, MNRAS, 417, L103 [NASA ADS] [CrossRef] [Google Scholar]
- McKernan, B., Ford, K. E. S., Yaqoob, T., & Winter, L. M. 2011b, MNRAS, 413, L24 [NASA ADS] [CrossRef] [Google Scholar]
- Mehdipour, M., Branduardi-Raymont, G., Kaastra, J. S., et al. 2011, A&A, 534, A39 [NASA ADS] [CrossRef] [EDP Sciences] [Google Scholar]
- Merloni, A., & Fabian, A. C. 2001, MNRAS, 321, 549 [NASA ADS] [CrossRef] [Google Scholar]
- Mewe, R., Gronenschild, E. H. B. M., & van den Oord, G. H. J. 1985, A&AS, 62, 197 [NASA ADS] [Google Scholar]
- Mewe, R., Lemen, J. R., & van den Oord, G. H. J. 1986, A&AS, 65, 511 [NASA ADS] [Google Scholar]
- Middei, R., Petrucci, P. O., Bianchi, S., et al. 2020, A&A, 640, A99 [NASA ADS] [CrossRef] [EDP Sciences] [Google Scholar]
- Morganti, R. 2017, Front. Astron. Space Sci., 4, 42 [CrossRef] [Google Scholar]
- Morganti, R., Oosterloo, T., Oonk, J. B. R., Frieswijk, W., & Tadhunter, C. 2015, A&A, 580, A1 [NASA ADS] [CrossRef] [EDP Sciences] [Google Scholar]
- Morganti, R., Oosterloo, T., Tadhunter, C., Bernhard, E. P., & Raymond Oonk, J. B. 2021, A&A, 656, A55 [NASA ADS] [CrossRef] [EDP Sciences] [Google Scholar]
- Murthy, S., Morganti, R., Oosterloo, T., et al. 2019, A&A, 629, A58 [NASA ADS] [CrossRef] [EDP Sciences] [Google Scholar]
- Nanni, R., Vignali, C., Gilli, R., Moretti, A., & Brandt, W. N. 2017, A&A, 603, A128 [NASA ADS] [CrossRef] [EDP Sciences] [Google Scholar]
- Narayan, R., & Yi, I. 1995, ApJ, 452, 710 [NASA ADS] [CrossRef] [Google Scholar]
- Narayan, R., McClintock, J. E., & Yi, I. 1996, ApJ, 457, 821 [CrossRef] [Google Scholar]
- Nasa High Energy Astrophysics Science Archive Research Center (Heasarc) 2014, Astrophysics Source Code Library [record ascl:1408.004] [Google Scholar]
- Natarajan, P., & Pringle, J. E. 1998, ApJ, 506, L97 [NASA ADS] [CrossRef] [Google Scholar]
- Nayakshin, S., & Sunyaev, R. 2007, MNRAS, 377, 1647 [NASA ADS] [CrossRef] [Google Scholar]
- Noda, H., & Done, C. 2018, MNRAS, 480, 3898 [Google Scholar]
- Oosterloo, T., Fraternali, F., & Sancisi, R. 2007, AJ, 134, 1019 [Google Scholar]
- Osterbrock, D. E. 1981, ApJ, 249, 462 [Google Scholar]
- Ostriker, E. C. 1999, ApJ, 513, 252 [Google Scholar]
- Ostriker, J. P. 1983, ApJ, 273, 99 [NASA ADS] [CrossRef] [Google Scholar]
- Pal, M., Dewangan, G. C., Misra, R., & Pawar, P. K. 2016, MNRAS, 457, 875 [NASA ADS] [CrossRef] [Google Scholar]
- Petrucci, P.-O., Ferreira, J., Henri, G., & Pelletier, G. 2008, MNRAS, 385, L88 [NASA ADS] [CrossRef] [Google Scholar]
- Petrucci, P. O., Paltani, S., Malzac, J., et al. 2013, A&A, 549, A73 [NASA ADS] [CrossRef] [EDP Sciences] [Google Scholar]
- Phinney, E. S. 1989, in The Center of the Galaxy, ed. M. Morris, 136, 543 [NASA ADS] [CrossRef] [Google Scholar]
- Planck Collaboration VI. 2020, A&A, 641, A6 [NASA ADS] [CrossRef] [EDP Sciences] [Google Scholar]
- Raj, A., & Nixon, C. J. 2021, ApJ, 909, 82 [NASA ADS] [CrossRef] [Google Scholar]
- Rees, M. J. 1988, Nature, 333, 523 [Google Scholar]
- Rees, M. J., Begelman, M. C., Blandford, R. D., & Phinney, E. S. 1982, Nature, 295, 17 [CrossRef] [Google Scholar]
- Reeves, J. N., Wynn, G., O’Brien, P. T., & Pounds, K. A. 2002, MNRAS, 336, L56 [NASA ADS] [CrossRef] [Google Scholar]
- Risaliti, G., Elvis, M., Fabbiano, G., Baldi, A., & Zezas, A. 2005, ApJ, 623, L93 [Google Scholar]
- Risaliti, G., Elvis, M., Fabbiano, G., et al. 2007, ApJ, 659, L111 [NASA ADS] [CrossRef] [Google Scholar]
- Ruan, J. J., Anderson, S. F., Cales, S. L., et al. 2016, ApJ, 826, 188 [NASA ADS] [CrossRef] [Google Scholar]
- Runnoe, J. C., Brotherton, M. S., & Shang, Z. 2012, MNRAS, 427, 1800 [NASA ADS] [CrossRef] [Google Scholar]
- SAS Development Team 2014, Astrophysics Source Code Library [record ascl:1404.004] [Google Scholar]
- Savić, D. 2019, Int. J. Cosmol., 1, 50 [Google Scholar]
- Savić, D., Marin, F., & Popović, L. Č. 2019, A&A, 623, A56 [NASA ADS] [CrossRef] [EDP Sciences] [Google Scholar]
- Schawinski, K., Koss, M., Berney, S., & Sartori, L. F. 2015, MNRAS, 451, 2517 [Google Scholar]
- Shakura, N. I., & Sunyaev, R. A. 1973, A&A, 24, 337 [NASA ADS] [Google Scholar]
- Sniegowska, M., Czerny, B., Bon, E., & Bon, N. 2020, A&A, 641, A167 [NASA ADS] [CrossRef] [EDP Sciences] [Google Scholar]
- Stern, D., McKernan, B., Graham, M. J., et al. 2018, ApJ, 864, 27 [Google Scholar]
- Strateva, I. V., Brandt, W. N., Schneider, D. P., Vanden Berk, D. G., & Vignali, C. 2005, AJ, 130, 387 [Google Scholar]
- Syer, D., Clarke, C. J., & Rees, M. J. 1991, MNRAS, 250, 505 [NASA ADS] [CrossRef] [Google Scholar]
- Taam, R. E., Liu, B. F., Yuan, W., & Qiao, E. 2012, ApJ, 759, 65 [NASA ADS] [CrossRef] [Google Scholar]
- Temple, M. J., Ricci, C., Koss, M. J., et al. 2023, MNRAS, 518, 2938 [Google Scholar]
- Tremaine, S. D., Ostriker, J. P., & Spitzer, L., Jr. 1975, ApJ, 196, 407 [NASA ADS] [CrossRef] [Google Scholar]
- Ursini, F., Petrucci, P. O., Bianchi, S., et al. 2020, A&A, 634, A92 [NASA ADS] [CrossRef] [EDP Sciences] [Google Scholar]
- Valencia-S., M., Eckart, A., Zajaček, M., et al. 2015, ApJ, 800, 125 [NASA ADS] [CrossRef] [Google Scholar]
- Vanden Berk, D. E., Richards, G. T., Bauer, A., et al. 2001, AJ, 122, 549 [Google Scholar]
- Volonteri, M., & Rees, M. J. 2005, ApJ, 633, 624 [NASA ADS] [CrossRef] [Google Scholar]
- Wagner, A. Y., Bicknell, G. V., Umemura, M., Sutherland, R. S., & Silk, J. 2016, Astron. Nachr., 337, 167 [NASA ADS] [CrossRef] [Google Scholar]
- Walsh, G., Burke-Spolaor, S., & Lazio, T. J. W. 2023, ApJ, 952, 18 [NASA ADS] [CrossRef] [Google Scholar]
- Weisskopf, M. C., Tananbaum, H. D., Van Speybroeck, L. P., & O’Dell, S. L. 2000, in X-Ray Optics, Instruments, and Missions III, eds. J. E. Truemper, & B. Aschenbach, SPIE Conf. Ser., 4012, 2 [NASA ADS] [CrossRef] [Google Scholar]
- Wenger, M., Ochsenbein, F., Egret, D., et al. 2000, A&AS, 143, 9 [NASA ADS] [CrossRef] [EDP Sciences] [Google Scholar]
- Wootten, A., & Thompson, A. R. 2009, IEEE Proc., 97, 1463 [NASA ADS] [CrossRef] [Google Scholar]
- Yang, Q., Wu, X.-B., Fan, X., et al. 2018, ApJ, 862, 109 [Google Scholar]
- Yuan, F., & Narayan, R. 2004, ApJ, 612, 724 [NASA ADS] [CrossRef] [Google Scholar]
- Yuan, F., & Narayan, R. 2014, ARA&A, 52, 529 [NASA ADS] [CrossRef] [Google Scholar]
- Yuan, F., Lin, J., Wu, K., & Ho, L. C. 2009, MNRAS, 395, 2183 [NASA ADS] [CrossRef] [Google Scholar]
- Zamorani, G., Henry, J. P., Maccacaro, T., et al. 1981, ApJ, 245, 357 [NASA ADS] [CrossRef] [Google Scholar]
- Zdziarski, A. A., Johnson, W. N., & Magdziarz, P. 1996, MNRAS, 283, 193 [NASA ADS] [CrossRef] [Google Scholar]
- Życki, P. T., Done, C., & Smith, D. A. 1999, MNRAS, 309, 561 [Google Scholar]
All Tables
Optical/UV flux densities of Mrk 1018 in units of 10−16 erg s−1 cm−2 Å−1 for each filter.
Mrk 1018 observed and expected value for the optical/UV to X-ray flux ratio parameter αox.
All Figures
|
Fig. 1. HC properties of Mrk 1018. Left panel: confidence intervals of ΓHC vs. normalization for the HC power law. Contour levels correspond to confidence of 68%, 90%, and 99%. Dashed lines are used for the data related to the faint state, while solid lines correspond to the observations acquired during the bright state. Right panel: time evolution of ΓHC. Symbols and colors correspond to different telescopes: blue square Chandra, black circle XMM-Newton, green star NuSTAR, and red diamond Swift-XRT. The first data point of Chandra corresponds to the observation 12868, which is heavily affected by the pileup. The vertical dashed black line roughly denotes the separation between the bright and the faint state. |
| In the text | |
|
Fig. 2. Mrk 1018 0.3−10 keV spectrum taken from the XMM 2008 observation (ID: 0554920301). Top left panel: spectrum and the best-fit model (1) for each camera. The data of the two MOSs are plotted in magenta and in black, while pn data are represented in dark cyan. The best-fit for each camera is reported using the bold lines (of corresponding color) and refers to data at energies above 3 keV (the vertical dashed gray line). Bottom left panel: residuals, expressed in terms of (data-model)/error, for the HC model (1). The horizontal dashed black line indicates the zero-level, while the vertical dashed gray line denotes the 3 keV energy channel. Top right panel and bottom right panel: same as the left-side panels, but now the model and the residuals refer to the modeling with both the HC and WC and fitted over the whole energy range. |
| In the text | |
|
Fig. 3. Comparison between the Mrk 1018 0.3−10 keV spectrum and the background level for the XMM 2008 observation (ID: 0554920301). The color-coding is the same as in Fig. 2. The background is negligible across the whole energy band for all cameras. |
| In the text | |
|
Fig. 4. WC properties of Mrk 1018. Left panel: confidence intervals of ΓWC vs. the warm corona temperature. Contour levels corresponds to confidence of 68%, 90%, and 99%. Dashed lines are used for the data related to the faint state, while solid lines correspond to the observations acquired during the bright state. Right panel: time evolution of ΓWC. Symbols and colors correspond to different telescopes: the blue squares are Chandra data, the black circles are XMM-Newton, the green stars are NuSTAR, and the red diamonds are Swift-XRT. The first data point of Chandra corresponds to observation 12868, which is heavily affected by pileup. The vertical dashed black line denotes the separation between the bright and the faint state. |
| In the text | |
|
Fig. 5. Optical, UV, and X-ray evolution of Mrk 1018 photometry from 2005 to 2019. Values are reported in Tables 2 and 3. The scales are different: the y-scale on the left is related to the optical/UV fluxes, while the scale on the right is related to the X-ray emission. The X-ray points are labeled with orange and yellow squares for the 0.5−2 keV and 2−10 keV bands, respectively. Each optical/UV filter is marked with circles of different color: V in green, B in dark green, U in cyan, UVW1 in blue, UVM2 in purple, and UVW2 in red. The vertical black dashed line distinguishes between the bright and the faint state. |
| In the text | |
|
Fig. 6. Comparison between Mrk 1018 observed (blue) and expected (red) spectral index αox over the 14 years of observations presented in this paper. The vertical black dashed line denotes the separation between the bright and the faint state. The uncertainties on the expected value of αox were calculated by applying a propagation of the uncertainties formula in Eq. (6). |
| In the text | |
|
Fig. 7. Mrk 1018 optical-to-X-ray SED. Top left panel: SED for the bright state. Swift-XRT data are reported in green, those from Swift-UVOT in red, and XMM-OM in blue. The best-fit model for each telescope is reported using the bold lines (in corresponding colors). XMM-Newton data are not shown to avoid overcrowding. Bottom left panel: residuals, expressed in terms of (data-model)/error, for the model described in Sect. 5.1. The horizontal dashed black line indicates the 0-level. Top right panel and bottom right panel: same as in the left panel, but now the data and residuals refers to the faint state. NuSTAR points are given in magenta, while Chandra in black. Y-axis scale is the same for the top panels, allowing for a direct comparison between the two states. The optical/UV points for the faint state are not fitted to the model, as the fit would otherwise be unconstrained. The residuals for the X-ray points are in the range ±5, as shown in the inset panel. |
| In the text | |
|
Fig. 8. Cartoon describing our proposed scenario to explain the broad-band spectro-photometric variability of Mrk 1018. The initial condition is an optically thick, geometrically thin disk with internal accretion (η), temperature (Td), and a magnetic field (Bd). A cloud pushed toward the center – the effect of a wet merger or cold chaotic accretion – passes nearby and starts to deposit gas at a given radius (denoted by the vertical dashed lines) at a rate of ηc (panel a). If ηc > η, the region in the disk where the gas from the cloud accretes starts to puff up. The energy produced via viscous friction is no more efficiently released and the temperature T suddenly rises (panel b). When T ≫ Td, the hot gas is accreted inward at a rate of ηl > η, triggering this instability in the adjacent inner ring (panel c). The energy starts to be released magnetically and the magnetic field (B) in this region decreases. If ηc ≫ η, this process extends to the whole inner accretion flow, making it optically thin and geometrically thick. The energy is released magnetically (Eb), likely in the form of a jet, drastically reducing the temperature of the gas and advecting the material onto the SMBH at a rate of ηa < η (panel d). |
| In the text | |
Current usage metrics show cumulative count of Article Views (full-text article views including HTML views, PDF and ePub downloads, according to the available data) and Abstracts Views on Vision4Press platform.
Data correspond to usage on the plateform after 2015. The current usage metrics is available 48-96 hours after online publication and is updated daily on week days.
Initial download of the metrics may take a while.