Fig. 2.
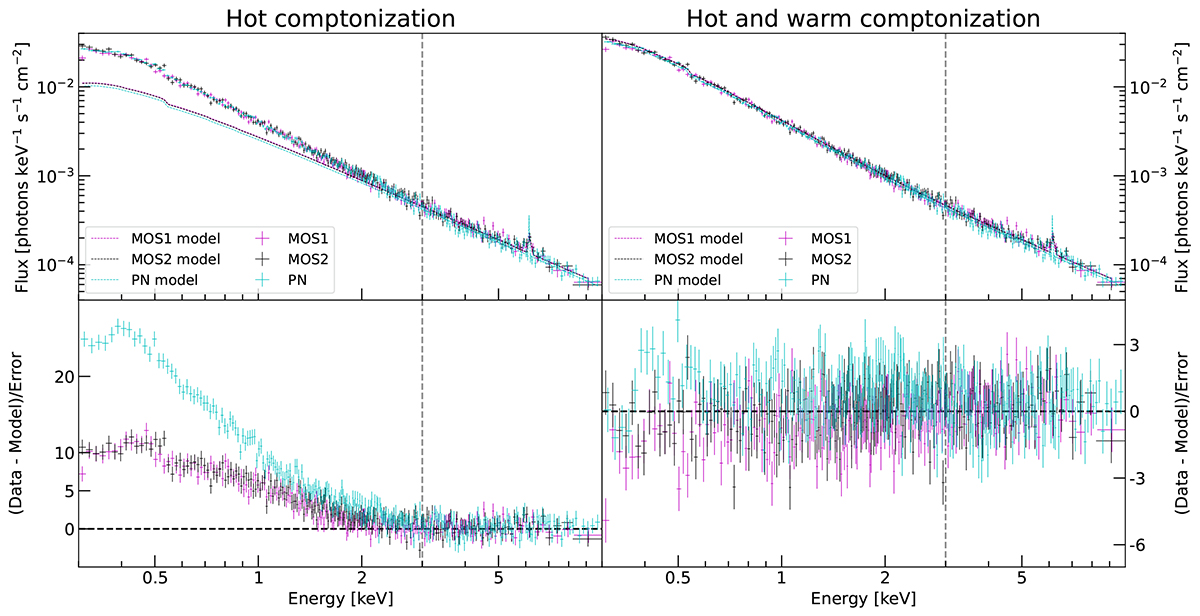
Download original image
Mrk 1018 0.3−10 keV spectrum taken from the XMM 2008 observation (ID: 0554920301). Top left panel: spectrum and the best-fit model (1) for each camera. The data of the two MOSs are plotted in magenta and in black, while pn data are represented in dark cyan. The best-fit for each camera is reported using the bold lines (of corresponding color) and refers to data at energies above 3 keV (the vertical dashed gray line). Bottom left panel: residuals, expressed in terms of (data-model)/error, for the HC model (1). The horizontal dashed black line indicates the zero-level, while the vertical dashed gray line denotes the 3 keV energy channel. Top right panel and bottom right panel: same as the left-side panels, but now the model and the residuals refer to the modeling with both the HC and WC and fitted over the whole energy range.
Current usage metrics show cumulative count of Article Views (full-text article views including HTML views, PDF and ePub downloads, according to the available data) and Abstracts Views on Vision4Press platform.
Data correspond to usage on the plateform after 2015. The current usage metrics is available 48-96 hours after online publication and is updated daily on week days.
Initial download of the metrics may take a while.