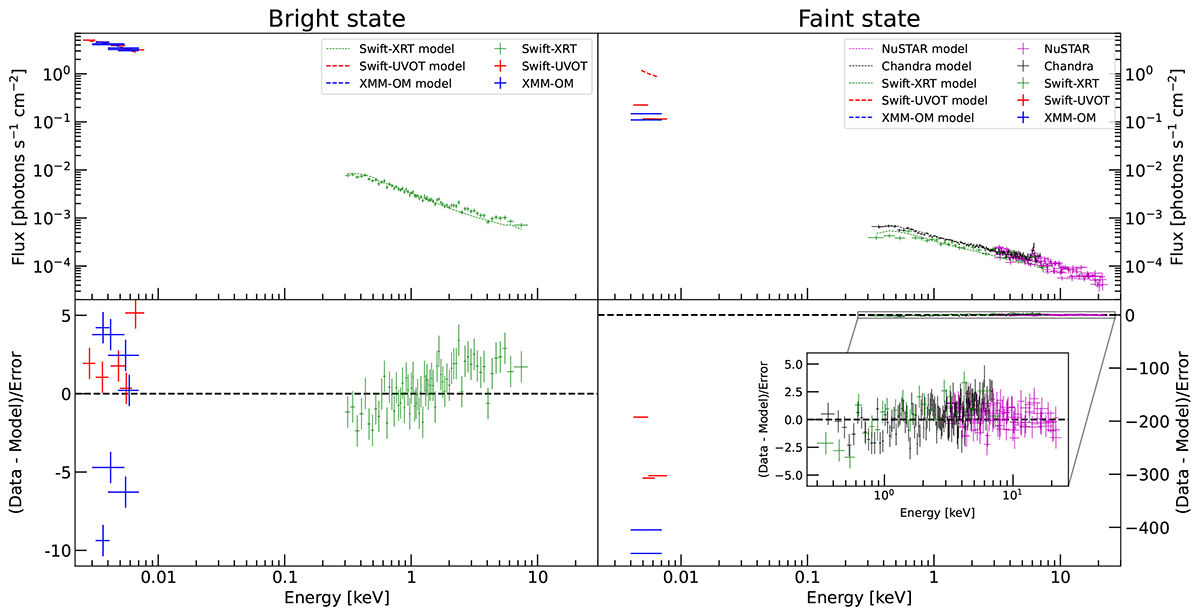
Fig. 7.
Download original image
Mrk 1018 optical-to-X-ray SED. Top left panel: SED for the bright state. Swift-XRT data are reported in green, those from Swift-UVOT in red, and XMM-OM in blue. The best-fit model for each telescope is reported using the bold lines (in corresponding colors). XMM-Newton data are not shown to avoid overcrowding. Bottom left panel: residuals, expressed in terms of (data-model)/error, for the model described in Sect. 5.1. The horizontal dashed black line indicates the 0-level. Top right panel and bottom right panel: same as in the left panel, but now the data and residuals refers to the faint state. NuSTAR points are given in magenta, while Chandra in black. Y-axis scale is the same for the top panels, allowing for a direct comparison between the two states. The optical/UV points for the faint state are not fitted to the model, as the fit would otherwise be unconstrained. The residuals for the X-ray points are in the range ±5, as shown in the inset panel.
Current usage metrics show cumulative count of Article Views (full-text article views including HTML views, PDF and ePub downloads, according to the available data) and Abstracts Views on Vision4Press platform.
Data correspond to usage on the plateform after 2015. The current usage metrics is available 48-96 hours after online publication and is updated daily on week days.
Initial download of the metrics may take a while.