Fig. 4.
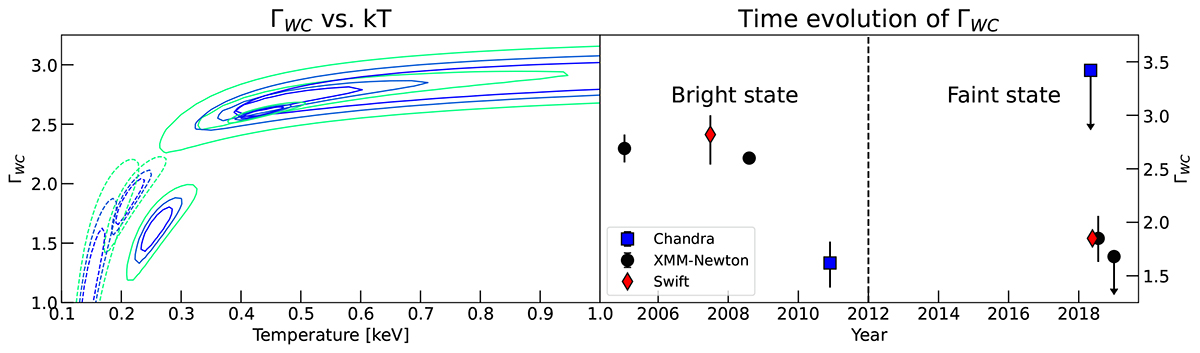
Download original image
WC properties of Mrk 1018. Left panel: confidence intervals of ΓWC vs. the warm corona temperature. Contour levels corresponds to confidence of 68%, 90%, and 99%. Dashed lines are used for the data related to the faint state, while solid lines correspond to the observations acquired during the bright state. Right panel: time evolution of ΓWC. Symbols and colors correspond to different telescopes: the blue squares are Chandra data, the black circles are XMM-Newton, the green stars are NuSTAR, and the red diamonds are Swift-XRT. The first data point of Chandra corresponds to observation 12868, which is heavily affected by pileup. The vertical dashed black line denotes the separation between the bright and the faint state.
Current usage metrics show cumulative count of Article Views (full-text article views including HTML views, PDF and ePub downloads, according to the available data) and Abstracts Views on Vision4Press platform.
Data correspond to usage on the plateform after 2015. The current usage metrics is available 48-96 hours after online publication and is updated daily on week days.
Initial download of the metrics may take a while.