Fig. 6.
Download original image
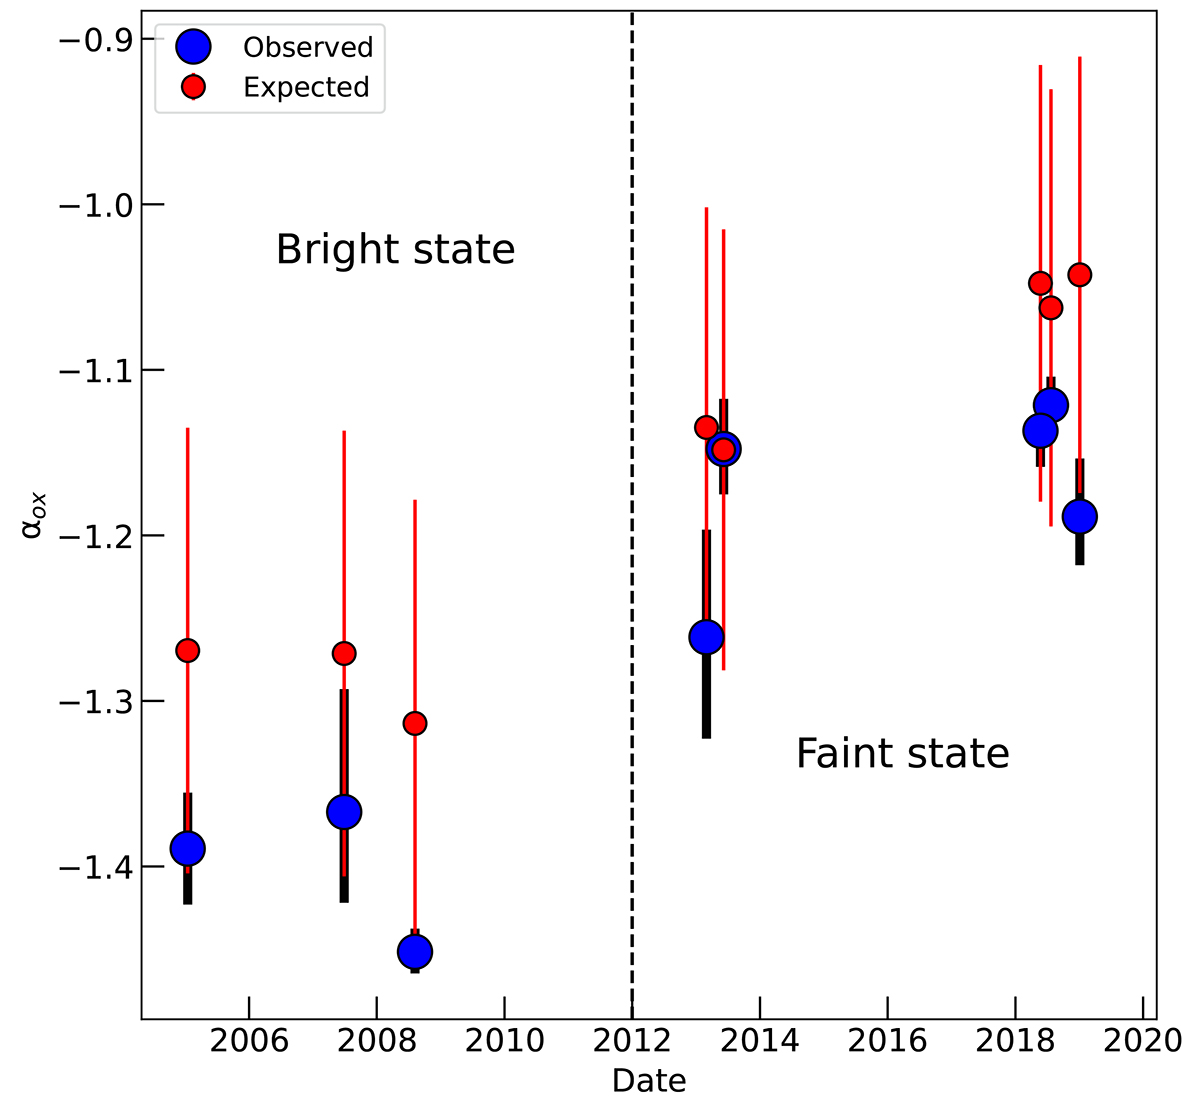
Comparison between Mrk 1018 observed (blue) and expected (red) spectral index αox over the 14 years of observations presented in this paper. The vertical black dashed line denotes the separation between the bright and the faint state. The uncertainties on the expected value of αox were calculated by applying a propagation of the uncertainties formula in Eq. (6).
Current usage metrics show cumulative count of Article Views (full-text article views including HTML views, PDF and ePub downloads, according to the available data) and Abstracts Views on Vision4Press platform.
Data correspond to usage on the plateform after 2015. The current usage metrics is available 48-96 hours after online publication and is updated daily on week days.
Initial download of the metrics may take a while.