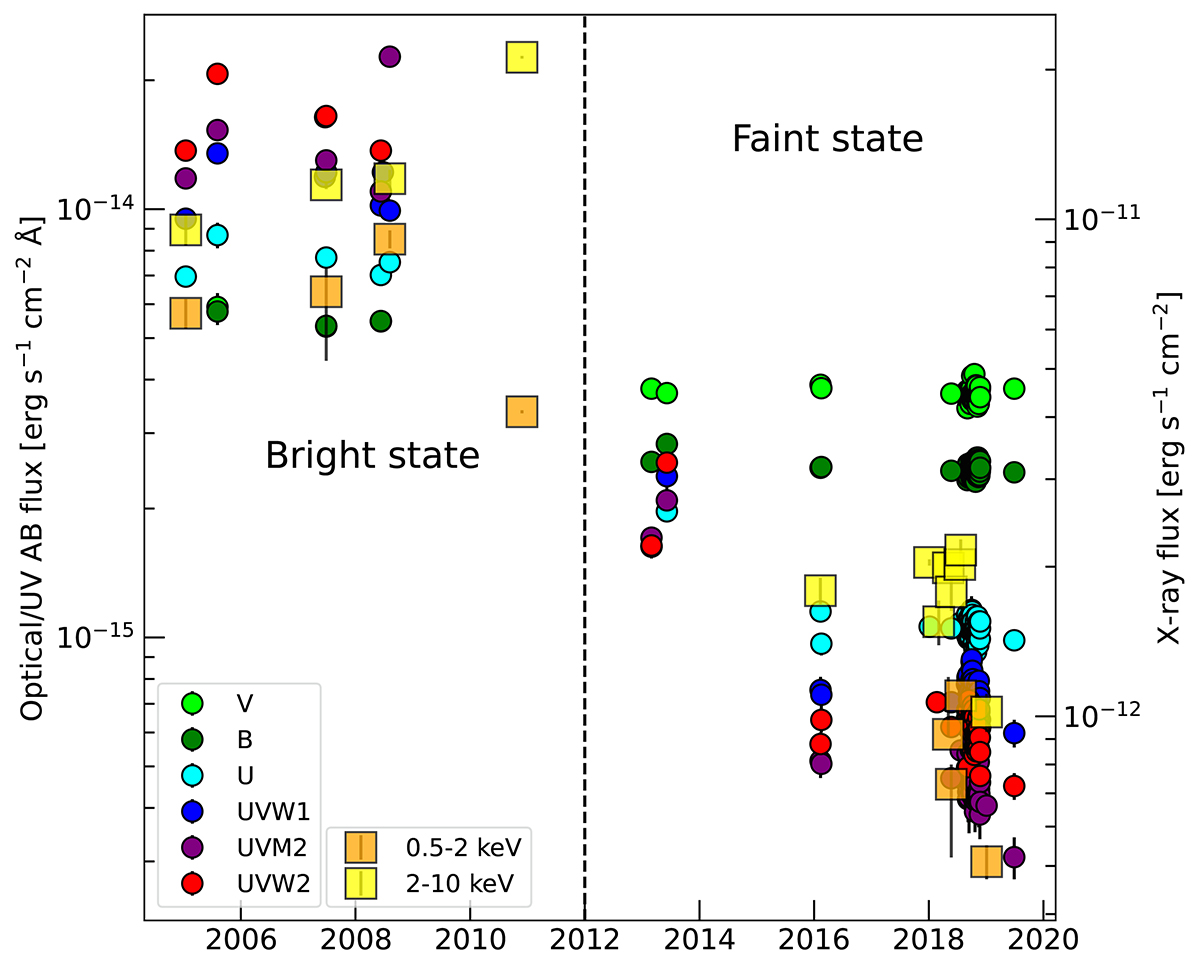
Fig. 5.
Download original image
Optical, UV, and X-ray evolution of Mrk 1018 photometry from 2005 to 2019. Values are reported in Tables 2 and 3. The scales are different: the y-scale on the left is related to the optical/UV fluxes, while the scale on the right is related to the X-ray emission. The X-ray points are labeled with orange and yellow squares for the 0.5−2 keV and 2−10 keV bands, respectively. Each optical/UV filter is marked with circles of different color: V in green, B in dark green, U in cyan, UVW1 in blue, UVM2 in purple, and UVW2 in red. The vertical black dashed line distinguishes between the bright and the faint state.
Current usage metrics show cumulative count of Article Views (full-text article views including HTML views, PDF and ePub downloads, according to the available data) and Abstracts Views on Vision4Press platform.
Data correspond to usage on the plateform after 2015. The current usage metrics is available 48-96 hours after online publication and is updated daily on week days.
Initial download of the metrics may take a while.