| Issue |
A&A
Volume 682, February 2024
|
|
|---|---|---|
| Article Number | A24 | |
| Number of page(s) | 11 | |
| Section | Extragalactic astronomy | |
| DOI | https://doi.org/10.1051/0004-6361/202347281 | |
| Published online | 31 January 2024 | |
The ALMA Reionization Era Bright Emission Line Survey: The molecular gas content of galaxies at z ~ 7
1
Instituto de Estudios Astrofísicos, Facultad de Ingeniería y Ciencias, Universidad Diego Portales,
Av. Ejército 441,
Santiago
8370191,
Chile
e-mail: This email address is being protected from spambots. You need JavaScript enabled to view it.
2
Cosmic Dawn Center (DAWN),
Rådmandsgade 64,
2200
København N,
Denmark
3
Niels Bohr Institute, University of Copenhagen,
Jagtvej 128,
2200
Copenhagen N,
Denmark
4
Department of Astronomy, University of Geneva,
Chemin Pegasi 51,
1290
Versoix,
Switzerland
5
Hiroshima Astrophysical Science Center, Hiroshima University,
1-3-1 Kagamiyama, Higashi-Hiroshima,
Hiroshima
739-8526,
Japan
6
National Astronomical Observatory of Japan,
2-21-1,
Osawa, Mitaka,
Tokyo,
Japan
7
Leiden Observatory, Leiden University,
2300 RA
Leiden,
The Netherlands
8
International Centre for Radio Astronomy Research, University of Western Australia,
35 Stirling Hwy.,
Crawley,
WA
6009,
Australia
9
Kapteyn Astronomical Institute, University of Groningen,
PO Box 800,
9700 AV
Groningen,
The Netherlands
10
Sterrenkundig Observatorium, Ghent University,
Krijgslaan 281-S9,
9000
Gent,
Belgium
11
Scuola Normale Superiore,
Piazza dei Cavalieri 7,
56126
Pisa,
Italy
12
Waseda Research Institute for Science and Engineering, Faculty of Science and Engineering, Waseda University,
3-4-1 Okubo,
Shinjuku,
Tokyo
169-8555,
Japan
13
Departmento de Astronomia, Universidad de Chile,
Casilla 36-D,
Santiago
7591245,
Chile
14
Dipartimento di Fisica, Sapienza, Università di Roma,
Piazza le Aldo Moro 5,
00185
Roma,
Italy
15
INAF – Osservatorio Astronomico di Roma,
via Frascati 33, 00078 Monte Porzio Catone,
Roma,
Italy
16
Sapienza School for Advanced Studies, Sapienza Università di Roma,
P.le Aldo Moro 2,
00185
Roma,
Italy
17
INFN, Sezione di Roma 1,
P.le Aldo Moro 2,
00185
Roma,
Italy
18
Steward Observatory, University of Arizona,
933 N Cherry Ave,
Tucson,
AZ 85721,
USA
Received:
26
June
2023
Accepted:
8
October
2023
Abstract
A key to understanding the formation of the first galaxies is to quantify the content of the molecular gas as the fuel for star formation activity through the epoch of reionization. In this paper, we use the 158µm [C II] fine-structure emission line as a tracer of the molecular gas in the interstellar medium (ISM) in a sample of 𝓏 = 6.5–7.5 galaxies recently unveiled by the Reionization Era Bright Line Emission Survey, REBELS, with the Atacama Large Millimeter/submillimeter Array. We find substantial amounts of molecular gas (~1010.5 M⊙), comparable to those found in lower-redshift galaxies for similar stellar masses (~1010 M⊙). The REBELS galaxies appear to follow the standard scaling relations of the molecular gas-to-stellar mass ratio (µmol) and the gas-depletion timescale (tdep) with distance to the star-forming main sequence expected from extrapolations of 𝓏 ~ 1–4 observations. We find median values at 𝓏 ~ 7 of μmol = 2.6−1.44.1 and tdep = 0.5−0.14+0.26 Gyr, indicating that the baryonic content of these galaxies is dominated by the gas phase and evolves little from 𝓏 ~ 7 to 4. Our measurements of the cosmic density of molecular gas, log(ρmol/(M⊙ Mpc−3)) = 6.34−0.31+0.34, indicate a steady increase by an order of magnitude from 𝓏 ~ 7 to 4.
Key words: galaxies: evolution / galaxies: high-redshift / galaxies: ISM / ISM: molecules
© The Authors 2024
 Open Access article, published by EDP Sciences, under the terms of the Creative Commons Attribution License (https://creativecommons.org/licenses/by/4.0), which permits unrestricted use, distribution, and reproduction in any medium, provided the original work is properly cited.
This article is published in open access under the Subscribe to Open model. This email address is being protected from spambots. You need JavaScript enabled to view it. to support open access publication.
1 Introduction
One of the most important advances in astrophysics in the past two decades has been the determination of the evolution of the cosmic star formation rate (SFR) density from cosmic dawn to the present time. This quantity was found to rapidly rise from 𝓏 = 10 to 𝓏 = 3 (a span of 3 Gyr of cosmic time), reaching a plateau at 𝓏 = 1–3, and then steadily declining at 𝓏 < 1 (e.g., Madau & Dickinson 2014; Péroux & Howk 2020). The cosmic SFR activity appears to be dominated by star-forming galaxies that grow secularly, forming a tight correlation in the plane of SFR versus stellar mass that is usually termed the star-forming main sequence (MS; Brinchmann et al. 2008; Daddi et al. 2007; Elbaz et al. 2007, 2011; Noeske et al. 2007; Peng et al. 2010; Rodighiero et al. 2010; Whitaker et al. 2010, 2014; Speagle et al. 2014; Schreiber et al. 2015; Iyer et al. 2018; Di Cesare et al. 2023). These galaxies will sporadically be involved in major galaxy interactions or mergers, leading to increased SFRs (e.g.; Kartaltepe et al. 2012), and they will eventually stop star formation, possibly through exhaustion of their cold gas reservoirs that sustain star formation (Peng et al. 2010; Sargent et al. 2014; Spilker et al. 2018; Belli et al. 2021; Williams et al. 2021; Bezanson et al. 2019, 2022).
This framework for galaxy growth has been built through intensive multiwavelength observational campaigns and simulations. Determination of the molecular gas content has been paramount because the cold gas represents the fuel for the star-forming activity. Because it is difficult to directly observe the H2 molecular gas, measurements of the molecular gas mass in distant galaxies have focused on the dust continuum and CO and [C I] line emission (e.g., Heintz & Watson 2020). Dedicated targeted surveys and archival searches for such dust and CO/[C I] line observations have led to thousands of galaxies with measured molecular gas masses (e.g.; Daddi et al. 2008, 2010; Tacconi et al. 2013, 2018; Dessauges-Zavadsky et al. 2015, 2017; Freundlich et al. 2019; Scoville et al. 2014, 2017; Fudamoto et al. 2017; Liu et al. 2019; Valentino et al. 2018, 2020). A complementary approach has been to perform deep systematic observations of the dust continuum and CO line emission in contiguous patches of the sky centered on cosmological deep fields (Carilli & Blain 2002; Decarli et al. 2014, 2020; Walter et al. 2014, 2016; Aravena et al. 2016b; Dunlop et al. 2017; Pavesi et al. 2018; Riechers et al. 2019; Franco et al. 2020; Hatsukade et al. 2018; González-López et al. 2019, 2020). These deep-field surveys have the advantage of avoiding preselection biases compared to targeted surveys, although they are restricted to fainter objects by design. Overall, these programs have enabled us to establish a set of scaling relations that allow us to describe the galaxy growth in terms of the galaxy stellar mass, specific SFRs, and redshift out to 𝓏 ~ 4. In particular, current studies indicate that from 𝓏 = 3 to 1, there is an increase in the molecular gas depletion timescales, a decrease in the molecular gas fractions, and a decrease in the specific SFR. In addition, the molecular gas-depletion timescales decrease with increasing specific SFR (e.g.; Tacconi et al. 2020). Of particular interest has been the determination of the cosmic density of molecular gas (ρH2) as a function of redshift from various dust-continuum and CO line surveys out to 𝓏 ~ 5 (Walter et al. 2014; Decarli et al. 2016, 2019, 2020; Riechers et al. 2019; Magnelli et al. 2020). This quantity has been measured to closely follow the evolution of the cosmic SFR density, supporting a relatively unchanged star formation efficiency on cosmic scales. Based on these results, it has also become evident that gas accretion from the inter-galactic medium (IGM) is necessary to sustain the build-up of stellar mass in galaxies, at least since 𝓏 = 1.5 (Walter et al. 2020).
As a result of cosmic dimming, the decreasing metallicities at higher redshifts, which cause the dust continuum and CO/[C I]line emission to become fainter, and as a result of the increase in the cosmic microwave background with redshift, it becomes difficult to measure the molecular gas reservoirs of galaxies at 𝓏 > 4 (e.g., Carilli & Walter 2013). Because the [C II] line is one of the brightest coolant lines in galaxies and because it is redshifted into the millimeter atmospheric windows observable from the ground at 𝓏 > 4, it has become a powerful tool for measuring the interstellar medium (ISM) properties of galaxies. Although its emission arises from various environments, including the neutral, ionized, and molecular gas phases (e.g.; Vallini et al. 2015; Pallottini et al. 2017; Lagache et al. 2018; Olsen et al. 2017), it has reliably been calibrated and used as a molecular gas tracer for massive galaxies at 𝓏 < 0.2 (Hughes et al. 2017; Madden et al. 2020) and at 𝓏 > 2 (Zanella et al. 2018; Vizgan et al. 2022). While [C II] has traditionally been used as a tracer of star formation in galaxies, the close link between star formation and molecular gas content (i.e., the Schmidt-Kennicutt relation) naturally yields a relation between [C II] and molecular gas. Current studies show that [C II] would even trace the molecular gas better than CO for low-metallicity environments in which the gas is CO-dark, as is the case for high-redshift galaxies (Madden et al. 2020; Vizgan et al. 2022).
The brightness of the [C II] line has allowed molecular gas measurements of galaxies at 𝓏 ~ 4–6 from the Atacama Large Millimeter/submillimeter Array (ALMA) Large Program to INvestigate C+ at the Early Times (ALPINE) survey (Dessauges-Zavadsky et al. 2020).
Here, we aim to extend this exploration to even higher red-shifts by using data from the Reionization Era Bright Emission Line Survey (REBELS; Bouwens et al. 2022). REBELS is an ALMA large program aimed at confirming the redshifts of a sample of 40 UV-bright star-forming galaxy candidates at 𝓏 ~ 69 using [C II] 158 µm and [O III] 88 µm emission line scans of the high-probability redshift range obtained from photometric redshift measurements. REBELS has enabled studies of the properties of these early galaxies through simultaneous studies of the dust continuum and [C II] emission line, including the determination of the dust properties (Inami et al. 2022; Sommovigo et al. 2022; Ferrara et al. 2022; Dayal et al. 2022), the infrared (IR) luminosity function (Barrufet et al. 2023) and obscured SFR density and fractions at 𝓏 ~ 7 (Algera et al. 2023), measurements of the dust temperature and [O III]/[CII] line ratios in a few systems (Algera et al. 2024), specific SFRs (Topping et al. 2022), the discovery of inconspicuous overdensities of dusty star-forming galaxies (Fudamoto et al. 2021), measurements of cosmic HI gas-mass densities (Heintz et al. 2022), [C II] sizes (Fudamoto et al. 2022), identification of Lyman-α emission and velocity offsets (Endsley et al. 2022), and a resolved study of a massive star-forming system at 𝓏 = 7.3 (Hygate et al. 2023).
In this paper, we present molecular gas-mass estimates for a sample of 28 [C II]-detected star-forming galaxies at 𝓏 ~ 6–8 drawn from REBELS (Bouwens et al. 2022) and its pilot surveys (Smit et al. 2018; Schouws et al. 2022, 2023). These measurements are thereby used to provide estimates of the evolution of the molecular gas-depletion timescales, molecular gas ratios, and cosmic molecular gas density at 𝓏 ~ 7. In Sect. 2, we present details of the REBELS survey, the available multiwavelength data, and the comparison samples that are used throughout this work. In Sect. 3, we discuss the use of the [C II]-based molecular gas calibration in the REBELS sample by comparing it with alternative estimates of the available molecular gas content. In Sect. 4, we present measurements of the molecular gas-depletion timescales, the gas fraction, and the cosmic molecular gas density, and we discuss them in the context of established scaling relations and the predicted evolution of these quantities to 𝓏 ~ 7. In Sect. 5, we provide a summary of the main results of this work. Throughout the paper, we adopt a standard ACDM cosmology1, and a Chabrier (2003) initial mass function (IMF), with stellar masses ranging from 0.1–300 M⊙.
2 Data
2.1 Observations and sample
Our study takes advantage of the [C II] line emission observations in a sample of 𝓏 ~ 6–8 galaxies obtained by the ALMA REBELS large program (PID: 2019.1.01634.L). Details of the REBELS survey are provided in Bouwens et al. (2022) and Schouws et al. (in prep.). Here, we provide a brief description of the observations.
The REBELS program used line scans to search for red-shifted [C II] 158 µm and [OIII]88µm lines from sources that had previously been selected as candidate 𝓏 > 6 galaxies based on their UV luminosity (MUV < − 21.5 mag) and photometric redshift probability distributions (6.5 < 𝓏 < 9.5), following an approach similar to that of the pilot programs (Smit et al. 2018; Schouws et al. 2022).
The REBELS survey targeted 40 galaxies selected from a total area of 7 deg2, encompassing various deep fields (Sect. 2.2). Line scans searching for the [C II] and [O III] lines were performed for 36 galaxies at 𝓏 ~ 6.5–7.5 and for 4 galaxies at 𝓏 ~ 8.0–9.5 using ALMA bands 6 and 8, respectively. For each target, the scanning range was chosen to cover 90% of the relevant frequency range following the photometric redshift probability distribution.
The ALMA observations used in this study were performed in the most compact configurations, C43-1 and C43-2, yielding synthesized beam sizes of 1.2–1.6″ in band 6. The [CII] line scans were performed to a sensitivity of 2 × 10⁸ L⊙ at 𝓏 = 7 (5σ; Bouwens et al. 2022).
Data calibration was performed using the Common Astronomy Software Application (CASA) software following the observatory-provided pipeline. Datacubes were thus created by inverting the calibrated visibilities with the tclean task and using a natural weighting scheme to maximize the sensitivity. Continuum images were obtained by collapsing the dat-acubes and excluding the frequency ranges that contained the [C II] lines (when detected) within 2 × FWHM [C II]. The [C II] line datacube and the continuum image were searched for emission at the location of the rest-frame UV source, following the procedures detailed in Schouws et al. (in prep.) and Inami et al. (2022).
We obtained 23 [C II] line and 16 dust-continuum detections from the first-year data. In this study, we thus focus on 23 galaxies with observations of [C ii] line and dust-continuum emission at 𝓏 ~ 7, plus an additional 5 galaxies with [C ii] detections (2 of which with dust detections) from the pilot studies (Smit et al. 2018; Schouws et al. 2023). We deliberately excluded [C II] non-detections from the analysis because it is unclear whether they are [C II]-faint galaxies or sources whose redshifts lie outside the ranges covered by the line scan. The redshift distribution of the 28 confirmed [C II] line emitters considered in this work is shown in Fig. 1 (left). The mean redshift of these sources is 𝓏 = 6.95, spanning a range of 𝓏 = 6.50–7.68.
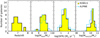 |
Fig. 1 Distribution of the properties of the REBELS galaxies (filled yellow histogram) compared to the ALPINE galaxies (empty blue histogram). From left to right, we show the distribution of redshift, stellar mass, SFR (UV+IR), and [C II]-based molecular gas masses. Stellar masses are derived from nonparametric SED fitting as described in the text (Topping et al. 2022). The histogram for the ALPINE sample was normalized to the maximum number of REBELS galaxies. No comparison of the redshift distributions is provided because the samples cover different redshift ranges by construction. |
2.2 Ancillary data
The REBELS sample was drawn from various cosmological survey fields, including the COSMOS/UltraVISTA (Scoville et al. 2007; McCracken et al. 2012), UKIDSS/UDS and VIDEO/XMM-LSS (Jarvis et al. 2013; Lawrence et al. 2007), CANDELS (Grogin et al. 2011), CLASH (Postman et al. 2012), and BoRG/HIPPIES pure-parallel (Trenti et al. 2011; Yan et al. 2011)2. The multiwavelength imaging of these surveys provided full optical to near-IR photometric coverage.
The available photometry and the [C II]-derived spectro-scopic redshifts were thus used to infer the physical properties of galaxies, including stellar masses, as described by Topping et al. (2022). Estimates of total SFRs were made through restframe UV observations from the HST (Bouwens et al. 2022) and estimates of IR luminosities from the ALMA rest-frame 158 µm continuum measurements (for details see: Inami et al. 2022).
The spectrum energy distribution (SED) fitting for the REBELS sample was performed using the PROSPECTOR code (Leja et al. 2019; Johnson et al. 2021). Two different approaches were employed: a nonparametric prescription for the galaxy star formation histories (SFHs; Johnson et al. 2021), and a constant SFH. In both methods, consistent physical assumptions were made, including subsolar metallicities (0.2 Z⊙), a Chabrier (2003) IMF for stellar masses below 300 M⊙, and a Small Magellanic Cloud (SMC) dust extinction curve (see: Topping et al. 2022).
Additionally, SED fitting for the REBELS sample was performed using the BEAGLE code (Chevallard & Charlot 2016) with a constant SFH (Stefanon et al., in prep.) and identical physical assumptions, except for the fitting code and stellar population templates. Some of the derived properties obtained through this procedure have been reported in Bouwens et al. (2022).
As elaborated in detail by Topping et al. (2022), the use of Prospector with a constant SFH yields results similar to those obtained by BEAGLE. However, it is known that adopting constant SFHs can result in younger age estimates for starbursting galaxies because the starburst can dominate the signal of older stellar populations (i.e., the outshining problem: young stellar populations outshine the old ones). In these cases, non-parametric SFHs provide greater flexibility and can help mitigate this issue (Algera et al. 2023). Nevertheless, these models tend to yield higher estimates of stellar masses, with an average increase of 0.43 dex compared to constant SFH models (Topping et al. 2022). For consistency with a related parallel study of the HI mass content of REBELS galaxies (Heintz et al. 2022), we adopted the results from Prospector with nonparametric SFHs for this work. With this approach, the majority of REBELS galaxies are consistent within the uncertainties with the standard star formation MS extrapolated to 𝓏 = 7 (Algera et al. 2023). In Sect. 4.3, we discuss potential biases and the effect on our results introduced by the use of these nonparametric models.
2.3 Comparison samples
Our primary comparison sample is based on the ALPINE survey (Le Fèvre et al. 2020; Béthermin et al. 2020; Faisst et al. 2020). This survey obtained [C ii] emission line and dust-continuum observations for a sample of 118 star-forming galaxies in the redshift range 𝓏 = 4–6 (Béthermin et al. 2020). These galaxies were selected on the basis of their rest-frame UV properties and the availability of rest-UV spectroscopic redshift measurements. The derived stellar masses in the range 108.4−1011 M⊙ and SFRs in the range 3–630 M⊙ yr−1 follow the expected trend of the star-forming MS at 𝓏 = 4–6. The ALPINE observations yielded [C II] line and dust-continuum detections for 75 and 23 sources, respectively, at a signal-to-noise ratio of 3.5. While the range of stellar masses and SFRs covered by ALPINE is similar to that of REBELS (see Fig. 1), by design, the latter did not require the existence of previous rest-UV (e.g., Ly-α) redshift determinations.
Figure 1 (middle panels) shows the distribution in stellar mass and SFR for the REBELS galaxies, compared with that of the ALPINE sample. Our current REBELS sample covers wide ranges in both parameters, with Mstars ~ 1085 −10105 M⊙ and SFR ~ 30–300 M⊙ yr−1, matching the range covered by ALPINE. Figure 2 shows the location of the REBELS sources in the SFR(UV+IR)–stellar mass plane compared to the expected location of the star-forming MS at 𝓏 ~ 5–7, based on various prescriptions (Schreiber et al. 2015; Iyer et al. 2018; Khusanova et al. 2021). For clarity, we split our sample into sources detected and nondetected in 158 µm dust continuum emission. Most galaxies in our sample of [CII] detected sources fall within the limits of the MS at these redshifts (±0.3 dex) compared to the widely used Schreiber et al. (2015) prescription for galaxies at 𝓏 = 7. However, they appear to be above the MS compared to the prescription at 𝓏 = 7 by Iyer et al. (2018), but still within ±0.5 dex.
Based on this comparison, we find that the parameter distributions of the REBELS galaxies are similar to those from the ALPINE sample. We note that the REBELS galaxies were not confirmed spectroscopically through rest-UV lines (Lyman-α), as was the ALPINE sample, although both samples were selected based on their rest-UV brightness. Furthermore, we find that most REBELS galaxies are consistent with being on the MS and thus represent examples of massive but typical star-forming galaxies at high redshift. A similar conclusion was reached by a recent study by Di Cesare et al. (2023).
At lower redshifts (𝓏 < 4), we adopted the compilation of CO line and dust-continuum measurements obtained by the IRAM Plateau de Bureau HIgh-𝓏 Blue Sequence Survey (PHIBSS; Tacconi et al. 2013, 2018; Freundlich et al. 2019).
The PHIBSS is a targeted survey that provides stellar masses, SFRs, and molecular gas masses (from dust and CO observations) for large samples of 1444 massive star-forming galaxies at 𝓏 = 0–4.
We complemented this with similar data from the ALMA Spectroscopic Survey in the Hubble UDF (ASPECS; Walter et al. 2016; Aravena et al. 2019, 2020; Boogaard et al. 2020) and other surveys (Papovich et al. 2016; Magdis et al. 2017; Gowardhan et al. 2019; Kaasinen et al. 2019; Molina et al. 2019; Bourne et al. 2019; Pavesi et al. 2018; Cassata et al. 2020). We remark that because the [CII] emission line is difficult to access at these lower redshifts, the molecular gas mass estimates in the comparison samples are based on observations of CO and dust-continuum emission.
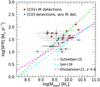 |
Fig. 2 Diagram of the SFR(UV+IR) vs. stellar mass for the REBELS sources. The blue triangles show sources detected in [C II] emission without an IR continuum detection. The red circles show sources detected in [C ii] and IR emission. The dotted and dashed lines represent models of the star-forming MS at 𝓏 = 7 (Schreiber et al. 2015; Iyer et al. 2018) and at 𝓏 ~ 5.5 (Khusanova et al. 2021). Most of the REBELS galaxies are consistent with being within ±0.3 dex of the expected MS at 𝓏 = 7 (see Topping et al. 2022). |
3 Measurements of molecular gas
Several far-IR to radio emission line and dust-continuum measurements have been used as standard tracers of the molecular gas content in galaxies (e.g., Carilli & Walter 2013; Hodge & da Cunha 2020). These include the CO line, particularly in the lowest-energy transitions, the [C i] line, and dust-continuum emission in the Rayleigh-Jeans regime. These tracers have provided molecular gas mass measurements in galaxies out to 𝓏 ~ 3–4. However, because they are faint, these tracers are more difficult to detect at high redshifts with current facilities. Furthermore, at 𝓏 > 6, the cosmic microwave background (CMB) temperature becomes comparable to the excitation temperature of most standard tracers such as CO J < 3 and dust emission in the Rayleigh–Jeans tail (da Cunha et al. 2013). The radiation from these tracers thus becomes almost impossible to detect against the CMB at these redshifts.
The [C II] 158 µm line, due to its brightness, high excitation temperature, and accessibility from the ground at the observed redshifted frequencies (due to the atmosphere transparency), has appeared as a very frequently used ISM tracer in galaxies at 𝓏 > 4. Zanella et al. (2018) found a correlation between [C II] luminosity and molecular gas mass with a mean absolute deviation of 0.3 dex and without evident systematic variations. They reported a conversion factor for the [CII] luminosity to molecular gas mass α[CII] ≃ 30 (M⊙/L⊙). As indicated by Zanella et al. (2018), the [C II]-to-H2 conversion factor, α[CII], appears to be largely independent of the molecular gas-depletion time, metallicity, and redshift for galaxies in the star formation MS. This correlation appears to hold for galaxies on and above the MS, in the redshift range 0 < 𝓏 < 6, and with metallicities 12+log(O/H) = 7.9–8.8. A larger scatter is observed for galaxies above the MS at lower metallicities.
Various alternative correlations have been proposed most recently, although with different values for the [C II]-to-H2 conversion factor. Madden et al. (2020) find α[CII] ≃ 130 (M⊙/L⊙) based on local galaxy observations with mostly low metallicites, while lower values are obtained based on simulations for high-redshift galaxies (𝓏 ~ 6), α[CII] ≃ 10–18 (M⊙/L⊙) (e.g., Pallottini et al. 2017; Vizgan et al. 2022). The discrepant α[CII] values in these studies seem to arise from competing unaccounted-for CO-dark gas and low-metallicity effects, respectively.
The literature indicating that the [C II] emission in galaxies arises from various ISM phases is vast, including ionized, neutral, and molecular gas (for a detailed discussion see: Lagache et al. 2018; Ferrara et al. 2019; Pallottini et al. 2019; Dessauges-Zavadsky et al. 2020). Numerical simulations and observations have shown evidence that >60% of the [C II] emission is dominated by molecular clouds and photon-dominated regions (PDR), with a minor contribution of 20–25% each from diffuse ionized and neutral gas (Vallini et al. 2015; Olsen et al. 2017; Katz et al. 2017, 2019; Pallottini et al. 2017, 2022; Vizgan et al. 2022). Therefore, [C II] can readily be calibrated as a tracer of these various phases, including star formation (e.g., De Looze et al. 2014), neutral gas (Heintz et al. 2021), and molecular gas (Zanella et al. 2018; Madden et al. 2020). These calibrations are likely a function of stellar mass (and/or metal-licities), evolutionary stage, and cosmic time. The main caveat in using [C II] as a molecular gas tracer is the unknown fraction of [C II] emission that arises from PDRs. However, current results indicate that [C II] is a tracer as good as others, such as CO and dust for galaxies with stellar masses ~1010 M⊙, particularly considering the need to assume an excitation ladder and a metallicity-dependent αCO conversion factor for CO measurements, and given the necessary assumption of a gas-to-dust conversion (or similar calibrations) for dust continuum-based measurements.
Based on this, we measured molecular gas masses for the REBELS galaxies in our sample using Eq. (2) from Zanella et al. (2018), and following the approach adopted for the ALPINE survey by Dessauges-Zavadsky et al. (2020),
![Mathematical equation: $\log \left( {{L_{[{\rm{CII}}]}}} \right) = ( - 1.28 \pm 0.21) + (0.98 \pm 0.02)\log \left( {{M_{{\rm{mol}}}}} \right). $](/articles/aa/full_html/2024/02/aa47281-23/aa47281-23-eq1.png) (1)
(1)
We therefore adopted α[CII] ≃ 30(M⊙/L⊙), with Mmol = α[CII] L[CII]. Figure 1 (right) shows the distribution of molecular gas masses obtained in this way. The masses range from 109–1011 M⊙, which is comparable to the range obtained for the ALPINE sample. Evidently, this is a consequence of the constant conversion factor and the same stellar mass and SFR ranges.
Before analyzing the implications of these molecular gas measurements further, we focus in the rest of this section on confirming the [C II]-based molecular gas mass estimates against other derivations provided by the available data.
3.1 IR luminosity as a proxy of molecular gas mass
One of the best-established relations in extragalactic astronomy is that between the IR luminosity (LIR) and the CO(1–0) luminosity (L′CO). This has long been known to hold for a variety of galaxies and environments, from local spirals (Leroy et al. 2008) to the most extreme starburst galaxies known through a wide range of redshifts, out to 𝓏 ~ 6 (e.g., Aravena et al. 2016c). Following Dessauges-Zavadsky et al. (2020), we converted the molecular gas masses derived from [C II](Mmol,[CII]) into the expected CO(1–0) luminosities under the assumption of typical αC0 values, with L′CO = Mmol,[CII]/αCO. The αCO is known to depend on metallicity, although with significant scatter (e.g., Bolatto et al. 2013), and therefore, a range of typical values was considered, between 1.0 and4.36 M⊙ (Kkm s−1)−1.
Figure 3 (left) shows the LIR versus L′CO diagram for the REBELS targets compared to standard curves representing the ranges occupied by star-forming galaxies for reference. This includes the universal fit to the compilation of CO observations for star-forming galaxies by Dessauges-Zavadsky et al. (2015), along with the same line with a factor ±0.3 dex added, representing the typical scatter around the fit.
We find that assuming a standard value of αCO = 4.36 M⊙ (Kkm s−1)−1, similar to what is found in the Milky Way and MS galaxies at 𝓏 ~ 2, the REBELS galaxies fall right on top of the Dessauges-Zavadsky et al. (2015) curve. Variations in αCO between 2.4-6.4 M⊙ (Kkm s−1)−1 would still produce a correlation within the 0.3 dex of the LIR versus LCO relation. In contrast, a lower αCO of 1.0 (same units), comparable to what is found in local starbursts (Downes & Solomon 1998), would lead to significantly higher CO luminosities that are inconsistent with the LIR versus L′CO relations. Values of αCO > 6.4 M⊙ (Kkm s−1)−1, as expected for subsolar metallicities for high-redshift galaxies, would also lead to L′CO values that are incompatible with the LIR versus LCO relation.
We note that the values of LIR appear to have a threshold at ~1011.5 L⊙, which is due in part to the depth of the REBELS program. However, we caution that the REBELS LIR values were computed using single dust-continuum measurements and realistic assumptions of the dust temperature (46 K). Warmer (or colder) dust temperatures will yield higher or lower LIR values.
Although a linear scaling between both quantities is expected because [C II] luminosities are known to scale with SFR, the fact that the CO values based on [C II]are consistent with the known LIR−L′CO relation supports the idea that [C II] can be used as a molecular gas tracer in the REBELS sample.
3.2 Dust masses
The dust content in galaxies is related to the molecular gas mass through the gas-to-dust ratio (δGDR). This parameter depends strongly on the galaxy metallicities and thus on the stellar mass through the mass-to-metallicity (MZ) relation.
Dust mass (Md) estimates for the REBELS galaxies have recently been obtained in two independent studies by Ferrara et al. (2022) and Sommovigo et al. (2022). It is thus interesting to determine how well the dust masses derived by these studies relate to the [C II]-based molecular gas measurements in the REBELS sample. The former constructed a semi-empirical model for dust reprocessing that uses the UV spectral slope, the observed UV continuum flux at 1500 Å and the observed FIR continuum at 158 μm as input parameters, and it considers various extinction curves and dust geometries. The latter adopted the Sommovigo et al. (2021) method to derive the dust properties of galaxies based on a combination of the [C II] line emission and the underlying 158 μm continuum, using standard functional forms with varying normalization for the star formation law (“Schmidt–Kennicutt” relation Ferrara et al. 2019; Pallottini et al. 2019) and standard assumptions for the dust properties (Sommovigo et al. 2021, 2022).
Adopting a prescription of the MZ relation (e.g., Genzel et al. 2015)3 and the broken power-law form of the δGDR-Z relation prescribed by Rémy-Ruyer et al. (2014), we find typical values of δGDR = 1000–3000 for the stellar masses and redshifts obtained for the REBELS galaxies (median ~109.7 M⊙, z ~ 7). These δGDR values are consistent with recent predictions for these stellar masses and redshifts, based on hydrodynamical simulations (DustyGadget; see Fig. 4 from Graziani et al. 2020).
Figure 3 (middle) shows the comparison of both Md estimates and Mmol,[CII] in the available galaxies. We find that both dust mass estimates are consistent and linearly related to the [C II]-based molecular gas mass estimates within the scatter (~30%), suggesting δGDR ~ 1500. Although it is not surprising that our molecular gas estimates correlate well with the dust mass estimates from Sommovigo et al. (2022) because both use the [CII] line information, the comparison suggests general consistency among the different methods and measurements, including the independent method used by Ferrara et al. (2022).
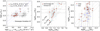 |
Fig. 3 Calibration of molecular gas masses from [CII] line measurements. Left: LIR vs. |

3.3 Estimates from dynamical mass
An alternative way to compute the molecular gas mass is provided by considering the mass budget in each galaxy. The dynamical mass within the half-light radius is given by Mdyn(< re) = 0.5(Mstars + Mgas) + MDM(< re) (e.g., Daddi et al. 2010). Assuming that the mass budget within re is dominated by baryons, thus that the dark matter fraction is negligible and that the ISM is dominated by the molecular gas (Mgas ≃ Mmol), we can use the dynamical and stellar masses to obtain Mmol,dyn.
Unfortunately, our [C II] observations can spatially resolve some of the sources only slightly, and therefore, we do not have information about their resolved [C II] kinematics.
For simplicity, we estimated the dynamical masses of the REBELS sources using Eqs. (10) and (11) in Bothwell et al. (2013). In the first case, the gas is distributed in a virialized spherical system, such as a compact starburst, with Mdyn = 1.56 × 10⁶σ2R, where σ is the velocity dispersion (σ = ∆vFWHM/2.35), and R is the source radius. In the second case, the gas is distributed in a disk with  , where i is the inclination angle of the disk. In both cases, we estimated the source radius from the circularized estimate
  where amaj and amin are the semi-major and semi-minor axes, respectively. We restricted the estimates on R by considering only sources that have been resolved at least marginally on a given axis with a significance of 2, or a/δa > 2. In unresolved cases, we considered the source to be small and simply fixed its radius to 2 kpc, based on previous size measurements in galaxies at similar redshifts (Fujimoto et al. 2020; Herrera-Camus et al. 2021) and for the REBELS sample (Fudamoto et al. 2022). This translates into 0.36″ at z = 7 (or a source diameter of ~0.7″), corresponding to ~25% of the observed beam size (1.6″). In the disk case, we adopted a mean inclination angle sin(i) = π/4 ≃ 0.79. The virialized spherical geometry dynamical mass estimator yields a mass 4.4 times higher than the mass obtained by assuming a disk-like gas distribution for the same source size, line width, and average inclination parameter.
Figure 3 (right) shows the comparison between the [C II]-based molecular gas mass (Mmol,[CII]) and the one estimated from the dynamical and stellar masses (Mmol,dyn–stars). Figure 1 shows that the stellar masses are systematically lower than the derived molecular gas masses and thus affect this comparison only weakly. Despite the number of assumptions and uncertainties in the parameters, we find overall agreement between both molecular gas estimates in the case of the disk geometry, with most of the galaxies falling within ±0.3 dex from a linear relation. In the case of a virialized geometry, we find a systematic offset between the [C II] and dynamical estimates and large scatter. The reason for this large scatter is likely the simple geometry assumption for very complex star-forming systems at these red-shifts, at which most of them are not necessarily expected to be either rotating disks or fully spherical systems.
In summary, we find that all independent checks obtained by comparing the estimates of molecular gas masses based on [C II]with the IR luminosity, the dust masses and the dynamical masses are consistent and support the application of the Zanella et al. (2018) calibration to estimate the molecular gas mass, assuming that the molecular gas phase dominates the baryon budget at z > 6 (which might not be the case; Heintz et al. 2022; Vizgan et al. 2022).
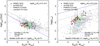 |
Fig. 4 ISM scaling relations for the REBELS galaxies compared to the literature. Left: molecular gas-depletion timescale (tdep) as a function of offset to the MS (∆MS). Right: ratio of molecular gas to stellar mass (μmol) as a function of the offset to the MS (∆MS). In both panels, filled orange circles show the REBELS galaxies z = 6–8 with molecular gas masses derived from [CII] measurements. The green triangles show [C II] measurements in ALPINE galaxies at z = 4–6 (Béthermin et al. 2020). The gray squares and blue crosses show the CO and dust measurements from PHIBSS at z < 3 (Tacconi et al. 2018) and additional sources from the literature (see text), respectively. All samples have been restricted to galaxies with Mstars = 108.5−10 5 M⊙ to match the range spanned by REBELS galaxies. The solid blue, dashed magenta, and dot-dashed black lines represent the prescriptions for the scaling relations computed for the median mass of the REBELS sample, Mstars = 109 75 M⊙ and z = 7, from Scoville et al. (2017), Tacconi et al. (2018) and Liu et al. (2019), respectively. |
4 Analysis and discussion
The relation between the SFR and Mmol in galaxies is usually termed the global Schmidt–Kennicutt (SK) relation or star formation law. This relation probes how the star formation activity is linked to the molecular gas supply. The ratio of the two quantities is usually called the molecular gas-depletion timescale, tdep = Mmol/SFR, which is seen as the time that is left before the galaxy runs out of molecular gas at the current rate of star formation. By definition, this quantity does not account for possible feedback processes in the galaxy (outflows) and interaction with the IGM (inflows). The fraction of baryonic mass in the galaxy that is in the form of molecular gas is usually described by the molecular gas fraction, fmol = Mmol/(Mmol + Mstars) or as the molecular gas-to-stellar mass ratio, μmol = Mmol/Mstars.
Several studies in the past decade have found that these quantities are intrinsically linked to other galaxy properties such as their stellar mass, specific SFR (sSFR), and/or their distance to the star-forming MS at a given redshift, ∆MS = sSFR/sSFRMS(Z), yielding the differentiation of different modes of star formation as a function of ∆MS (e.g., Sargent et al. 2014). Furthermore, tdep and μmol were found to evolve with redshift (and stellar mass). While mild evolution is observed for the average tdep for galaxies at z < 3, strong evolution is seen for the average μmol (e.g., Tacconi et al. 2018; Liu et al. 2019). Recent determinations of the molecular gas mass in galaxies from the ALPINE survey permitted extending these results to the redshift range 4–6, indicating little evolution in the average values of both tdep and μmol from z ~ 4–6 to z ~ 3 (Dessauges-Zavadsky et al. 2020). It is therefore interesting to determine whether similar results are found in an independent sample and at higher redshift.
In the following, we analyze and place in context the ISM properties of the REBELS galaxies compared to previous observations of distant galaxies. The comparison samples we used are briefly described in Sect. 2.3 and in the following analysis were restricted to the stellar mass range of the REBELS sample. This filter is important for the lower-redshift samples, which contain a significant number of more massive galaxies.
4.1 Scaling relations
Figure 4 shows the relations that are formed by tdep and μmol with ∆MS for the REBELS sources compared to the samples and prescriptions in the literature for the expected scaling relations at z = 7 (Tacconi et al. 2018; Liu et al. 2019; Scoville et al. 2017), computed at the median stellar mass of the REBELS sample, 109 5M⊙ at z = 7. We note that the Scoville et al. (2017) measurements provide the total ISM masses (HI and H2), and by construction therefore yield higher masses than the molecular gas fractions alone. For the MS, we used the prescription from Schreiber et al. (2015). We note that these prescriptions for μmol, ∆MS and the MS correspond to extrapolations based largely on CO and dust observations of galaxy samples z < 4 because no similar observations are available for galaxies at z > 6.
The REBELS sample does not show a strong dependence of tdep on ∆MS compared to lower-redshift samples and expectations from scaling relations. This could be due in part to the IR luminosity limits (see Fig. 3).
We find that all galaxies are consistent within the scatter with the expected low values for tdep at these redshifts. A similar trend is followed by the ALPINE sample, indicating that this trend is not associated with sample selection. Thus, the lack of a dependence on ∆MS is likely related to the fact that most sources fall in the MS (∆MS ~ 0) and to the scatter in this relation expected at high redshift. Furthermore, the location of both REBELS and ALPINE samples in the tdep versus ∆MS plane agrees well with the expectation from the Tacconi et al. (2018) and Scoville et al. (2017) relations at these redshifts.
A significant difference in the dependence of μmol on ∆MS is seen between the high- and low-redshift samples and among the various prescriptions for the scaling relations. We find that for the REBELS and ALPINE samples, μmol consistently increases with distance from the MS, as expected (i.e., galaxies with a higher SFR per unit stellar mass have a higher Mmol per unit stellar mass). Furthermore, μmol values are systematically higher for the REBELS and ALPINE samples than for galaxies at z ~ 1–3 (i.e., galaxies at higher redshifts are richer in molecular gas) for a given stellar mass. However, a significant difference is observed when the various extrapolations for scaling relations at these red-shifts are compared, and the Tacconi et al. (2018) prescription predicts values closer to our measurements. This is similar to previous findings from Dessauges-Zavadsky et al. (2020).
Overall, the REBELS (and ALPINE) galaxies mimic the scaling relation trends expected based on lower-redshift samples. However, we find large discrepancies among the various models at these redshifts. This is particularly evident for the dependence of μmol on ∆MS, where the model predictions differ by nearly two orders of magnitude for MS galaxies. As mentioned above, an important source of uncertainty that affects the values of ∆MS and μmol is the lack of sensitive constraints on the rest-frame optical SED. This will affect the stellar mass estimates and their derived uncertainties.
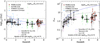 |
Fig. 5 Evolution of the molecular ISM out to z = 7.5. Left: molecular gas-depletion timescale (tdep) as a function of redshift. Right: molecular gas-to-stellar mass ratio (μmol) as a function of redshift. The symbols are the same as in Fig. 4. Similarly, literature comparison samples are trimmed to fit the stellar mass range of the REBELS galaxies, Mstars = 108.5–10 5 M⊙. The open black squares represent the averages in each relevant redshift range. |
4.2 Evolution of tdep and μmol
Figure 5 shows the measured dependence of tdep and μmol on redshift for the REBELS sources compared with the literature samples and prescriptions for the expected scaling relations (Tacconi et al. 2018; Liu et al. 2019; Scoville et al. 2017) for MS galaxies with a stellar mass of 109 75 M⊙. To determine evolutionary trends, we divided the sample into ranges of redshift, grouping the ALPINE and REBELS samples into two bins each (4.3 < z < 4.7 and 5.0 < z < 6.0 for ALPINE; 6.4 < z < 7.0 and 7.0 < z < 7.8 for REBELS) and dividing the literature galaxy samples at lower redshifts into six bins. With this, we computed the median among all galaxies in each bin. The uncertainties in each median point taken were obtained by computing the quartile values for the subsamples in each bin. These values were found to be in excellent agreement with the weighted-average values for the subsamples in each bin and with previously reported values for these mass ranges (e.g., Tacconi et al. 2018; Dessauges-Zavadsky et al. 2020).
We find that the REBELS galaxies exhibit a mild (or no) evolution of tdep from z = 7 to z ~ 4–6 (and at most redshifts), as expected from previous observations and models, yielding a median  Gyr at z = 7, where the uncertainty corresponds to the interquartile range. Little scatter is seen among the REBELS sample, and there is overall consistency with the Tacconi et al. (2018) and Scoville et al. (2017) prescriptions. The short tdep values found here require that there is additional gas accretion for the next 3 Gyr to sustain the high star formation activity until z ~ 2.
Similarly, we find a median  , equivalent to a molecular gas fraction
  . The scatter seen here is mostly due to the wide range of stellar masses of galaxies per redshift bin because the dependence of μmol on Mstars is strong (see Fig. 8 bottom panel from Dessauges-Zavadsky et al. 2020). This scatter could also be caused by the fact that the REBELS galaxies are likely younger than lower-redshift objects at matched stellar mass and are thus caught at earlier stages in their assembly process, or simply because of the uncertainties in stellar mass measurements, given the lack of rest-frame optical photometry.
In this case, the scaling relation model prescriptions diverge by one order of magnitude, and the Tacconi et al. (2018) model agrees best with the data. Because the Scoville et al. (2017) measurements yield the total ISM masses (HI and H2), they yield higher gas fractions than the molecular gas fractions alone.
4.3 Potential effects of the stellar masses
As discussed in Sect. 2.2, we adopted stellar masses obtained through SED fitting using nonparametric SFHs because this approach helps overcome the outshining problem and for consistency with a parallel study (Heintz et al. 2022). For the sample considered in this study, these nonparametric stellar mass estimates are higher by ~0.35 dex on average than those computed using parametric constant SFHs.
This selection only has a minor effect on the main conclusions drawn in this and in the previous section. The choice of nonparametric stellar masses makes the REBELS galaxies mostly consistent with the star-forming MS, whereas using constant SFHs yields a slightly higher fraction of starburst galaxies, or above 0.5 dex from the expected star-forming MS at z ~ 7. We find that only two sources are above this threshold for nonparametric stellar masses, compared to nine sources for parametric masses.
The choice of nonparametric stellar masses has little effect on the computed ∆MS. The median ∆MS for nonparametric SFHs is lower by only 0.1 dex than that computed with parametric constant SFHs. Similarly, our choice of stellar mass measurements does not affect the tdep estimates; however, it has a more important effect on μmol. The median μmol obtained for nonparametric stellar masses is lower by a factor 2.4 than that obtained with parametric masses. The parametric stellar masses would still place the REBELS galaxies within the expected scaling relations in the log(μmol) versus ∆MS plot (Fig. 4). However, they would now be more consistent with the Liu et al. (2019) prescription for μmol at z = 7. This would contradict the consistently low value of tdep at z ~ 7, which is consistent with the prescription of Tacconi et al. (2020).
4.4 Cosmic density of molecular gas
Great observational efforts have been made in recent years to measure the CO luminosity function (LF) at different redshifts and, thereby, the cosmic density of molecular gas ρmol. Initial attempts to measure the CO LF at high redshift were made with the Very Large Array (VLA) in an overdense field at z ~ 1.5 (Aravena et al. 2012). However, the first dedicated survey for this purpose used the IRAM Plateau de Bureau Interferometer (PdBI) to perform a spectral scan over frequency and thus conduct a blind search for CO line emission in the Hubble Deep Field North (<1 arcmin2; Walter et al. 2014; Decarli et al. 2014). Later on, CO line and dust continuum surveys with ALMA were performed to this end in the Hubble UDF, including the ASPECS pilot (~1 arcmin2; Walter et al. 2016; Aravena et al. 2016a,b; Decarli et al. 2016) and large programs (~5 arcmin2; Decarli et al. 2019, 2020; González-López et al. 2020; Aravena et al. 2019, 2020; Boogaard et al. 2020). Similar efforts were made with the VLA through the CO Luminosity Density at High-Redshift (COLDz) survey (Riechers et al. 2019) by covering larger areas at shallower depths for lower-J CO transitions. A parallel approach has taken advantage of targeted CO and dust continuum surveys because each independently observed pointing would essentially yield a portion of a cosmological deep field, and combining it with statistical methods to assess the completeness and compute the cosmological volumes covered. This yielded estimates for the CO LF from the PHIBSS (Lenkić et al. 2020), the A3COSMOS (Liu et al. 2019), and the ALMACAL surveys (Klitsch et al. 2019). Similar estimates have been obtained from dust continuum observations (Scoville et al. 2017; Magnelli et al. 2020), and most recently, using the ALPINE [C II] survey (Yan et al. 2020).
It is interesting to compare these measurements with the value of ρmol at z = 6.5–7.5 from the REBELS survey. Following previous studies (Yan et al. 2020; Heintz et al. 2021, 2022), we computed ρmol from the [C II] luminosity density, ℒ, obtained for galaxies at z ≈ 7 from the REBELS survey by Oesch et al. (in prep.). in this study, the [C II] luminosity density is found by integrating the [C II] luminosity function down to a limit of log(L[CII],lim) = 7.5, as ![Mathematical equation: ${\cal L} = \int_{[{\rm{CIII}}],\lim }^\infty {{L_{[{\rm{CII}}]}}} \phi \left( {{L_{[{\rm{CII}}]}}} \right){\rm{d}}L$](/articles/aa/full_html/2024/02/aa47281-23/aa47281-23-eq8.png) , where ϕ(L[CII]) is the [C II] LF. The latter is obtained from the UV LF (Bouwens et al. 2021), using an empirical L[CII]–LUV relation derived for galaxies at the same redshift (for details, see Oesch et al., in prep.; and also Barrufet et al. 2023). With this, we obtain a [C II] luminosity density
, where ϕ(L[CII]) is the [C II] LF. The latter is obtained from the UV LF (Bouwens et al. 2021), using an empirical L[CII]–LUV relation derived for galaxies at the same redshift (for details, see Oesch et al., in prep.; and also Barrufet et al. 2023). With this, we obtain a [C II] luminosity density ![Mathematical equation: $\log \left( {{\cal L}/\left[ {{L_ \odot }{\rm{Mp}}{{\rm{c}}^{ - 3}}} \right]} \right) = 4.85_{ - 0.20}^{ + 0.25}$](/articles/aa/full_html/2024/02/aa47281-23/aa47281-23-eq9.png) for the REBELS sample. Now, this can be converted into a molecular gas-mass density using the calibration described above,
for the REBELS sample. Now, this can be converted into a molecular gas-mass density using the calibration described above, ![Mathematical equation: ${\alpha _{\left[ {{\rm{CII}}} \right]}}\,\, \approx \,\,30\,{M_ \odot }L_ \odot ^{ - 1}$](/articles/aa/full_html/2024/02/aa47281-23/aa47281-23-eq10.png) (from Zanella et al. 2018), yielding
(from Zanella et al. 2018), yielding  . This result includes the uncertainties associated with the α[CII] calibration (Zanella et al. 2018). For the ALPINE data, we used the updated calculations of the [C II] luminosity density from Heintz et al. (2022).
Figure 6 shows the result of this comparison. The measurements obtained from the different methods and tracers agree that ρmol resembles the evolution of the cosmic SFR density (scaled by a typical molecular gas depletion timescale of 0.5 Gyr, shown by the solid green line in Fig. 6; e.g., Decarli et al. 2020), although the studies by A3COSMOS (Liu et al. 2019) and Scoville et al. (2017) find different normalizations.
However, the few measurements obtained at z ~ 4–6, including CO-based estimates from PHIBSS (Lenkić et al. 2020) and COLDz (Riechers et al. 2019), and ALPINE [C II] estimates (Yan et al. 2020; Heintz et al. 2022), appear to agree, indicating a continuous decline of ρmol at increasing redshifts. The REBELS measurements agree with the declining trend of ρmol at higher redshifts. These results indicate that ρmol increases by an order of magnitude from z ~ 7 to z ~ 4, and that beyond z = 6, the values of ρmol reach levels similar to and below the current ρmol (at z = 0) of log(ρmol/(M⊙ Mpc−3)) ~ 7.
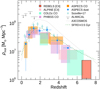 |
Fig. 6 Cosmic density of molecular gas (ρmol) from REBELS at z = 6.5–7.5 compared to measurements from the literature. The filled red box region represents the [C II]-based measurement of this work. Literature data points come from various CO, dust, and [C II] surveys, including ASPECS CO (Decarli et al. 2020) and dust measurements (Magnelli et al. 2020), COLDz (Riechers et al. 2019), PHIBSS (Lenkić et al. 2020), ALMACAL (Klitsch et al. 2019), A3COSMOS (Liu et al. 2019), and dust measurements from Scoville et al. (2017) and ALPINE (Yan et al. 2020). The dotted green curve shows the cosmic SFR density (Madau & Dickinson 2014), scaled by a typical molecular gas-depletion timescale of 0.5 Gyr (Tacconi et al. 2020). REBELS measurements, which extend to z ~ 7, indicate a sustained decline of ρmol at earlier epochs. |
5 Conclusions
We presented molecular gas-mass estimates and properties for the sample of galaxies at z ~ 7 unveiled by the REBELS large-program survey using the [C II] line emission as a proxy for the molecular ISM. The main conclusions of this study are as follows:
- 1.
Comparison of the [C II]-based molecular gas-mass estimates with independent estimates and proxies, including the IR luminosity (as a proxy for the molecular gas mass through the
 relation), dust masses, and dynamical mass estimates yield reasonable agreement when applied to the REBELS sample at z ~ 7. Furthermore, the matched stellar mass and SFR distributions of the REBELS and ALPINE surveys suggest that the calibrations to obtain Mmol from L[CII] apply for massive MS galaxies at z ~ 7 and z ~ 4–6;
 - 2.
The molecular gas-to-stellar mass ratios (μmol) and molecular gas-depletion timescales (tdep) appear to follow the standard scaling relations with distance to the MS ∆MS for REBELS galaxies at z ~ 7. While μmol increases toward larger ∆MS, tdep is observed to remain relatively constant. The location of the REBELS galaxies at z ~ 7 in these plots agrees with the regions occupied by ALPINE galaxies and the distant end of lower-redshift samples at matched stellar masses;
- 3.
The median tdep and μmol remain almost constant in the range z ~ 2–7 for galaxies with stellar masses 108.5−10.5 M⊙;
- 4.
We measure a value of the cosmic density of molecular gas at z = 6.5–7.5 of
 , indicating an increase of an order of magnitude from z ~ 7 to z ~ 4.
The advent of IR facilities such as the James Webb Space Telescope (JWST) and the Roman Telescope will allow us to explore samples of hundreds to thousands of galaxies at z > 6, enabling the study of the formation processes of galaxies through the end of the epoch of reionization. Investigating the cold ISM of these early galaxies will require observations with submil-limeter facilities such as ALMA. However, due to the dimming of traditional ISM tracers, such as the CO line and dust continuum emission due to cosmological distances, lower metallicities, and increasingly low contrast to the cosmic microwave background at higher redshift (da Cunha et al. 2013), measurements of the ISM gas content (a key ingredient in studying the galaxy assembly) will be increasingly difficult. The [C II] line emission has therefore come to save the day, enabling relatively accurate measurements of Mmol for massive systems in the early Universe. Calibration of the [C II] line for larger samples of galaxies, as well as other fine-structure lines, will be essential for future galaxy formation studies.
Acknowledgements
We thank the anonymous referee for their constructive feedback to improve this article. We thank Roberto Decarli for the useful discussions and for providing the cosmic density literature measurements. This paper uses the following ALMA data. ADS/JAO.ALMA#2019.1.01634.L. ALMA is a partnership of ESO (representing its member states), NSF (USA) and NINS (Japan), together with NRC (Canada), MOST and ASIAA (Taiwan), and KASI (Republic of Korea), in cooperation with the Republic of Chile. The Joint ALMA Observatory is operated by ESO, AUI/NRAO and NAOJ. M.A. acknowledges support from FONDECYT grant 1211951, ANID+PCI+INSTITUTO Max Planck de Astronomia MPG 190030, ANID+PCI+REDES 190194 and ANID BASAL project FB210003. H.I. and H.S.B.A. acknowledge support from the NAOJ ALMA Scientific Research Grant Code 2021-19A. P.D. acknowledges support from the NWO grant 016.VIDI.189.162 (“ODIN”) and from the European Commission’s and University of Groningen’s CO-FUND Rosalind Franklin program. P.D. also warmly thanks the Institute for Advanced Study (IAS) Princeton, where a part of this work was carried out, for their generous hospitality and support through the Bershadsky Fund.
References
- Algera, H. S. B., Inami, H., Oesch, P. A., et al. 2023, MNRAS, 518, 6142 [Google Scholar]
- Algera, H., Inami, H., Sommovigo, L., et al. 2024, MNRAS, 527, 6867 [Google Scholar]
- Aravena, M., Carilli, C. L., Salvato, M., et al. 2012, MNRAS, 426, 258 [NASA ADS] [CrossRef] [Google Scholar]
- Aravena, M., Decarli, R., Walter, F., et al. 2016a, ApJ, 833, 71 [NASA ADS] [CrossRef] [Google Scholar]
- Aravena, M., Decarli, R., Walter, F., et al. 2016b, ApJ, 833, 68 [Google Scholar]
- Aravena, M., Spilker, J. S., Bethermin, M., et al. 2016c, MNRAS, 457, 4406 [Google Scholar]
- Aravena, M., Decarli, R., Gónzalez-López, J., et al. 2019, ApJ, 882, 136 [Google Scholar]
- Aravena, M., Boogaard, L., Gónzalez-López, J., et al. 2020, ApJ, 901, 79 [NASA ADS] [CrossRef] [Google Scholar]
- Barrufet, L., Oesch, P. A., Bouwens, R., et al. 2023, MNRAS, 522, 3926 [NASA ADS] [CrossRef] [Google Scholar]
- Belli, S., Contursi, A., Genzel, R., et al. 2021, ApJ, 909, L11 [NASA ADS] [CrossRef] [Google Scholar]
- Béthermin, M., Fudamoto, Y., Ginolfi, M., et al. 2020, A&A, 643, A2 [Google Scholar]
- Bezanson, R., Spilker, J., Williams, C. C., et al. 2019, ApJ, 873, L19 [NASA ADS] [CrossRef] [Google Scholar]
- Bezanson, R., Spilker, J. S., Suess, K. A., et al. 2022, ApJ, 925, 153 [NASA ADS] [CrossRef] [Google Scholar]
- Bolatto, A. D., Wolfire, M., & Leroy, A. K. 2013, ARA&A, 51, 207 [CrossRef] [Google Scholar]
- Boogaard, L. A., van der Werf, P., Weiss, A., et al. 2020, ApJ, 902, 109 [NASA ADS] [CrossRef] [Google Scholar]
- Bothwell, M. S., Smail, I., Chapman, S. C., et al. 2013, MNRAS, 429, 3047 [Google Scholar]
- Bourne, N., Dunlop, J. S., Simpson, J. M., et al. 2019, MNRAS, 482, 3135 [Google Scholar]
- Bouwens, R. J., Oesch, P. A., Stefanon, M., et al. 2021, AJ, 162, 47 [NASA ADS] [CrossRef] [Google Scholar]
- Bouwens, R. J., Smit, R., Schouws, S., et al. 2022, ApJ, 931, 160 [NASA ADS] [CrossRef] [Google Scholar]
- Brinchmann, J., Pettini, M., & Charlot, S. 2008, MNRAS, 385, 769 [NASA ADS] [CrossRef] [Google Scholar]
- Carilli, C. L., & Blain, A. W. 2002, ApJ, 569, 605 [NASA ADS] [CrossRef] [Google Scholar]
- Carilli, C. L., & Walter, F. 2013, ARA&A, 51, 105 [NASA ADS] [CrossRef] [Google Scholar]
- Cassata, P., Liu, D., Groves, B., et al. 2020, ApJ, 891, 83 [Google Scholar]
- Chabrier, G. 2003, PASP, 115, 763 [Google Scholar]
- Chevallard, J., & Charlot, S. 2016, MNRAS, 462, 1415 [NASA ADS] [CrossRef] [Google Scholar]
- da Cunha, E., Groves, B., Walter, F., et al. 2013, ApJ, 766, 13 [Google Scholar]
- Daddi, E., Dickinson, M., Morrison, G., et al. 2007, ApJ, 670, 156 [NASA ADS] [CrossRef] [Google Scholar]
- Daddi, E., Dannerbauer, H., Elbaz, D., et al. 2008, ApJ, 673, L21 [NASA ADS] [CrossRef] [Google Scholar]
- Daddi, E., Bournaud, F., Walter, F., et al. 2010, ApJ, 713, 686 [NASA ADS] [CrossRef] [Google Scholar]
- Dayal, P., Ferrara, A., Sommovigo, L., et al. 2022, MNRAS, 512, 989 [NASA ADS] [CrossRef] [Google Scholar]
- Decarli, R., Walter, F., Carilli, C., et al. 2014, ApJ, 782, 78 [NASA ADS] [CrossRef] [Google Scholar]
- Decarli, R., Walter, F., Aravena, M., et al. 2016, ApJ, 833, 69 [Google Scholar]
- Decarli, R., Walter, F., Gónzalez-López, J., et al. 2019, ApJ, 882, 138 [Google Scholar]
- Decarli, R., Aravena, M., Boogaard, L., et al. 2020, ApJ, 902, 110 [Google Scholar]
- De Looze, I., Cormier, D., Lebouteiller, V., et al. 2014, A&A, 568, A62 [NASA ADS] [CrossRef] [EDP Sciences] [Google Scholar]
- Dessauges-Zavadsky, M., Zamojski, M., Schaerer, D., et al. 2015, A&A, 577, A50 [NASA ADS] [CrossRef] [EDP Sciences] [Google Scholar]
- Dessauges-Zavadsky, M., Zamojski, M., Rujopakarn, W., et al. 2017, A&A, 605, A81 [NASA ADS] [CrossRef] [EDP Sciences] [Google Scholar]
- Dessauges-Zavadsky, M., Ginolfi, M., Pozzi, F., et al. 2020, A&A, 643, A5 [NASA ADS] [CrossRef] [EDP Sciences] [Google Scholar]
- Di Cesare, C., Graziani, L., Schneider, R., et al. 2023, MNRAS, 519, 4632 [Google Scholar]
- Downes, D., & Solomon, P. M. 1998, ApJ, 507, 615 [NASA ADS] [CrossRef] [Google Scholar]
- Dunlop, J. S., McLure, R. J., Biggs, A. D., et al. 2017, MNRAS, 466, 861 [Google Scholar]
- Elbaz, D., Daddi, E., Le Borgne, D., et al. 2007, A&A, 468, 33 [NASA ADS] [CrossRef] [EDP Sciences] [Google Scholar]
- Elbaz, D., Dickinson, M., Hwang, H. S., et al. 2011, A&A, 533, A119 [NASA ADS] [CrossRef] [EDP Sciences] [Google Scholar]
- Endsley, R., Stark, D. P., Bouwens, R. J., et al. 2022, MNRAS, 517, 5642 [NASA ADS] [CrossRef] [Google Scholar]
- Faisst, A. L., Schaerer, D., Lemaux, B. C., et al. 2020, ApJS, 247, 61 [NASA ADS] [CrossRef] [Google Scholar]
- Ferrara, A., Vallini, L., Pallottini, A., et al. 2019, MNRAS, 489, 1 [Google Scholar]
- Ferrara, A., Sommovigo, L., Dayal, P., et al. 2022, MNRAS, 512, 58 [NASA ADS] [CrossRef] [Google Scholar]
- Franco, M., Elbaz, D., Zhou, L., et al. 2020, A&A, 643, A30 [NASA ADS] [CrossRef] [EDP Sciences] [Google Scholar]
- Freundlich, J., Combes, F., Tacconi, L. J., et al. 2019, A&A, 622, A105 [NASA ADS] [CrossRef] [EDP Sciences] [Google Scholar]
- Fudamoto, Y., Ivison, R. J., Oteo, I., et al. 2017, MNRAS, 472, 2028 [NASA ADS] [CrossRef] [Google Scholar]
- Fudamoto, Y., Oesch, P. A., Schouws, S., et al. 2021, Nature, 597, 489 [CrossRef] [Google Scholar]
- Fudamoto, Y., Smit, R., Bowler, R. A. A., et al. 2022, ApJ, 934, 144 [NASA ADS] [CrossRef] [Google Scholar]
- Fujimoto, S., Silverman, J. D., Bethermin, M., et al. 2020, ApJ, 900, 1 [Google Scholar]
- Genzel, R., Tacconi, L. J., Lutz, D., et al. 2015, ApJ, 800, 20 [Google Scholar]
- González-López, J., Decarli, R., Pavesi, R., et al. 2019, ApJ, 882, 139 [Google Scholar]
- González-López, J., Novak, M., Decarli, R., et al. 2020, ApJ, 897, 91 [Google Scholar]
- Gowardhan, A., Riechers, D., Pavesi, R., et al. 2019, ApJ, 875, 6 [NASA ADS] [CrossRef] [Google Scholar]
- Graziani, L., Schneider, R., Ginolfi, M., et al. 2020, MNRAS, 494, 1071 [NASA ADS] [CrossRef] [Google Scholar]
- Grogin, N. A., Kocevski, D. D., Faber, S. M., et al. 2011, ApJS, 197, 35 [NASA ADS] [CrossRef] [Google Scholar]
- Hatsukade, B., Kohno, K., Yamaguchi, Y., et al. 2018, PASJ, 70, 105 [Google Scholar]
- Heintz, K. E., & Watson, D. 2020, ApJ, 889, L7 [Google Scholar]
- Heintz, K. E., Watson, D., Oesch, P. A., Narayanan, D., & Madden, S. C. 2021, ApJ, 922, 147 [NASA ADS] [CrossRef] [Google Scholar]
- Heintz, K. E., Oesch, P. A., Aravena, M., et al. 2022, ApJ, 934, L27 [NASA ADS] [CrossRef] [Google Scholar]
- Herrera-Camus, R., Förster Schreiber, N., Genzel, R., et al. 2021, A&A, 649, A31 [NASA ADS] [CrossRef] [EDP Sciences] [Google Scholar]
- Hodge, J. A., & da Cunha, E. 2020, Roy. Soc. Open Sci., 7, 200556 [NASA ADS] [CrossRef] [Google Scholar]
- Hughes, T. M., Ibar, E., Villanueva, V., et al. 2017, A&A, 602, A49 [NASA ADS] [CrossRef] [EDP Sciences] [Google Scholar]
- Hygate, A. P. S., Hodge, J. A., da Cunha, E., et al. 2023, MNRAS, 524, 1775 [NASA ADS] [CrossRef] [Google Scholar]
- Inami, H., Algera, H. S. B., Schouws, S., et al. 2022, MNRAS, 515, 3126 [NASA ADS] [CrossRef] [Google Scholar]
- Iyer, K., Gawiser, E., Davé, R., et al. 2018, ApJ, 866, 120 [Google Scholar]
- Jarvis, M. J., Bonfield, D. G., Bruce, V. A., et al. 2013, MNRAS, 428, 1281 [Google Scholar]
- Johnson, B. D., Leja, J., Conroy, C., & Speagle, J. S. 2021, ApJS, 254, 22 [NASA ADS] [CrossRef] [Google Scholar]
- Kaasinen, M., Scoville, N., Walter, F., et al. 2019, ApJ, 880, 15 [NASA ADS] [CrossRef] [Google Scholar]
- Kartaltepe, J. S., Dickinson, M., Alexander, D. M., et al. 2012, ApJ, 757, 23 [CrossRef] [Google Scholar]
- Katz, H., Kimm, T., Sijacki, D., & Haehnelt, M. G. 2017, MNRAS, 468, 4831 [Google Scholar]
- Katz, H., Galligan, T. P., Kimm, T., et al. 2019, MNRAS, 487, 5902 [NASA ADS] [CrossRef] [Google Scholar]
- Khusanova, Y., Bethermin, M., Le Fèvre, O., et al. 2021, A&A, 649, A152 [NASA ADS] [CrossRef] [EDP Sciences] [Google Scholar]
- Klitsch, A., Péroux, C., Zwaan, M. A., et al. 2019, MNRAS, 490, 1220 [NASA ADS] [CrossRef] [Google Scholar]
- Lagache, G., Cousin, M., & Chatzikos, M. 2018, A&A, 609, A130 [NASA ADS] [CrossRef] [EDP Sciences] [Google Scholar]
- Lawrence, A., Warren, S. J., Almaini, O., et al. 2007, MNRAS, 379, 1599 [Google Scholar]
- Le Fèvre, O., Béthermin, M., Faisst, A., et al. 2020, A&A, 643, A1 [Google Scholar]
- Leja, J., Carnall, A. C., Johnson, B. D., Conroy, C., & Speagle, J. S. 2019, ApJ, 876, 3 [Google Scholar]
- Lenkić, L., Bolatto, A. D., Förster Schreiber, N. M., et al. 2020, AJ, 159, 190 [CrossRef] [Google Scholar]
- Leroy, A. K., Walter, F., Brinks, E., et al. 2008, AJ, 136, 2782 [Google Scholar]
- Liu, D., Schinnerer, E., Groves, B., et al. 2019, ApJ, 887, 235 [Google Scholar]
- Madau, P., & Dickinson, M. 2014, ARA&A, 52, 415 [Google Scholar]
- Madden, S. C., Cormier, D., Hony, S., et al. 2020, A&A, 643, A141 [NASA ADS] [CrossRef] [EDP Sciences] [Google Scholar]
- Magdis, G. E., Rigopoulou, D., Daddi, E., et al. 2017, A&A, 603, A93 [NASA ADS] [CrossRef] [EDP Sciences] [Google Scholar]
- Magnelli, B., Boogaard, L., Decarli, R., et al. 2020, ApJ, 892, 66 [NASA ADS] [CrossRef] [Google Scholar]
- McCracken, H. J., Milvang-Jensen, B., Dunlop, J., et al. 2012, A&A, 544, A156 [NASA ADS] [CrossRef] [EDP Sciences] [Google Scholar]
- Molina, J., Ibar, E., Smail, I., et al. 2019, MNRAS, 487, 4856 [NASA ADS] [CrossRef] [Google Scholar]
- Noeske, K. G., Weiner, B. J., Faber, S. M., et al. 2007, ApJ, 660, L43 [CrossRef] [Google Scholar]
- Olsen, K., Greve, T. R., Narayanan, D., et al. 2017, ApJ, 846, 105 [Google Scholar]
- Pallottini, A., Ferrara, A., Bovino, S., et al. 2017, MNRAS, 471, 4128 [NASA ADS] [CrossRef] [Google Scholar]
- Pallottini, A., Ferrara, A., Decataldo, D., et al. 2019, MNRAS, 487, 1689 [Google Scholar]
- Pallottini, A., Ferrara, A., Gallerani, S., et al. 2022, MNRAS, 513, 5621 [NASA ADS] [Google Scholar]
- Papovich, C., Labbé, I., Glazebrook, K., et al. 2016, Nat. Astron., 1, 0003 [Google Scholar]
- Pavesi, R., Sharon, C. E., Riechers, D. A., et al. 2018, ApJ, 864, 49 [Google Scholar]
- Peng, Y.-j., Lilly, S. J., Kovac, K., et al. 2010, ApJ, 721, 193 [NASA ADS] [CrossRef] [Google Scholar]
- Péroux, C., & Howk, J. C. 2020, ARA&A, 58, 363 [CrossRef] [Google Scholar]
- Postman, M., Coe, D., Benítez, N., et al. 2012, ApJS, 199, 25 [Google Scholar]
- Rémy-Ruyer, A., Madden, S. C., Galliano, F., et al. 2014, A&, 563, A31 [CrossRef] [EDP Sciences] [Google Scholar]
- Riechers, D. A., Pavesi, R., Sharon, C. E., et al. 2019, ApJ, 872, 7 [Google Scholar]
- Rodighiero, G., Cimatti, A., Gruppioni, C., et al. 2010, A&A, 518, A25 [Google Scholar]
- Sargent, M. T., Daddi, E., Béthermin, M., et al. 2014, ApJ, 793, 19 [NASA ADS] [CrossRef] [Google Scholar]
- Schouws, S., Stefanon, M., Bouwens, R., et al. 2022, ApJ, 954, 103 [Google Scholar]
- Schouws, S., Bouwens, R., Smit, R., et al. 2023, ApJ, 954, 103 [NASA ADS] [CrossRef] [Google Scholar]
- Schreiber, C., Pannella, M., Elbaz, D., et al. 2015, A&A, 575, A74 [NASA ADS] [CrossRef] [EDP Sciences] [Google Scholar]
- Scoville, N., Abraham, R. G., Aussel, H., et al. 2007, ApJS, 172, 38 [NASA ADS] [CrossRef] [Google Scholar]
- Scoville, N., Aussel, H., Sheth, K., et al. 2014, ApJ, 783, 84 [CrossRef] [Google Scholar]
- Scoville, N., Lee, N., Vanden Bout, P., et al. 2017, ApJ, 837, 150 [Google Scholar]
- Smit, R., Bouwens, R. J., Carniani, S., et al. 2018, Nature, 553, 178 [Google Scholar]
- Sommovigo, L., Ferrara, A., Carniani, S., et al. 2021, MNRAS, 503, 4878 [NASA ADS] [CrossRef] [Google Scholar]
- Sommovigo, L., Ferrara, A., Pallottini, A., et al. 2022, MNRAS, 513, 3122 [NASA ADS] [CrossRef] [Google Scholar]
- Speagle, J. S., Steinhardt, C. L., Capak, P. L., & Silverman, J. D. 2014, ApJS, 214, 15 [Google Scholar]
- Spilker, J., Bezanson, R., Barisic, I., et al. 2018, ApJ, 860, 103 [NASA ADS] [CrossRef] [Google Scholar]
- Tacconi, L. J., Neri, R., Genzel, R., et al. 2013, ApJ, 768, 74 [NASA ADS] [CrossRef] [Google Scholar]
- Tacconi, L. J., Genzel, R., Saintonge, A., et al. 2018, ApJ, 853, 179 [Google Scholar]
- Tacconi, L. J., Genzel, R., & Sternberg, A. 2020, ARA&A, 58, 157 [NASA ADS] [CrossRef] [Google Scholar]
- Topping, M. W., Stark, D. P., Endsley, R., et al. 2022, MNRAS, 516, 975 [NASA ADS] [CrossRef] [Google Scholar]
- Trenti, M., Bradley, L. D., Stiavelli, M., et al. 2011, ApJ, 727, L39 [NASA ADS] [CrossRef] [Google Scholar]
- Valentino, F., Magdis, G. E., Daddi, E., et al. 2018, ApJ, 869, 27 [Google Scholar]
- Valentino, F., Magdis, G. E., Daddi, E., et al. 2020, ApJ, 890, 24 [Google Scholar]
- Vallini, L., Gallerani, S., Ferrara, A., Pallottini, A., & Yue, B. 2015, ApJ, 813, 36 [NASA ADS] [CrossRef] [Google Scholar]
- Vizgan, D., Greve, T. R., Olsen, K. P., et al. 2022, ApJ, 929, 92 [NASA ADS] [CrossRef] [Google Scholar]
- Walter, F., Decarli, R., Sargent, M., et al. 2014, ApJ, 782, 79 [NASA ADS] [CrossRef] [Google Scholar]
- Walter, F., Decarli, R., Aravena, M., et al. 2016, ApJ, 833, 67 [Google Scholar]
- Walter, F., Carilli, C., Neeleman, M., et al. 2020, ApJ, 902, 111 [Google Scholar]
- Whitaker, K. E., van Dokkum, P. G., Brammer, G., et al. 2010, ApJ, 719, 1715 [Google Scholar]
- Whitaker, K. E., Franx, M., Leja, J., et al. 2014, ApJ, 795, 104 [NASA ADS] [CrossRef] [Google Scholar]
- Williams, C. C., Spilker, J. S., Whitaker, K. E., et al. 2021, ApJ, 908, 54 [NASA ADS] [CrossRef] [Google Scholar]
- Yan, H., Yan, L., Zamojski, M. A., et al. 2011, ApJ, 728, L22 [NASA ADS] [CrossRef] [Google Scholar]
- Yan, L., Sajina, A., Loiacono, F., et al. 2020, ApJ, 905, 147 [Google Scholar]
- Zanella, A., Daddi, E., Magdis, G., et al. 2018, MNRAS, 481, 1976 [Google Scholar]
H0 = 70 km s−1 Mpc−1, ΩM = 0.3 and ΩΛ = 0.7.
Survey definitions: COSMOS/UltraVISTA corresponds to the Ultra deep survey with the Visible and Infrared Survey Telescope for Astronomy (VISTA) telescope in the Cosmic Evolution Survey (COSMOS) field. The UKIDSS Ultra Deep Survey (UDS) corresponds to the deepest component of the United Kingdom IR Telescope (UKIRT) IR Deep Sky Survey (UKIDSS). VIDEO stands for the VISTA Deep Extra-galactic Observations survey, targeting the XMM Large Scale Structure (LSS) field. CANDELS corresponds to the Cosmic Assembly Near-infrared Deep Extragalactic Legacy Survey. CLASH denotes the Cluster Lensing And Supernova survey with Hubble. Finally, BoRG corresponds to the Brightest of Reionizing Galaxies observations obtained with the Hubble Space Telescope, which assimilates data from the similar Hubble Infrared Pure Parallel Imaging Extragalactic Survey, HIPPIES.
We adopt this prescription as it is widely used in similar studies at high redshift, as in Tacconi et al. (2018).
All Figures
|
Fig. 1 Distribution of the properties of the REBELS galaxies (filled yellow histogram) compared to the ALPINE galaxies (empty blue histogram). From left to right, we show the distribution of redshift, stellar mass, SFR (UV+IR), and [C II]-based molecular gas masses. Stellar masses are derived from nonparametric SED fitting as described in the text (Topping et al. 2022). The histogram for the ALPINE sample was normalized to the maximum number of REBELS galaxies. No comparison of the redshift distributions is provided because the samples cover different redshift ranges by construction. |
| In the text | |
|
Fig. 2 Diagram of the SFR(UV+IR) vs. stellar mass for the REBELS sources. The blue triangles show sources detected in [C II] emission without an IR continuum detection. The red circles show sources detected in [C ii] and IR emission. The dotted and dashed lines represent models of the star-forming MS at 𝓏 = 7 (Schreiber et al. 2015; Iyer et al. 2018) and at 𝓏 ~ 5.5 (Khusanova et al. 2021). Most of the REBELS galaxies are consistent with being within ±0.3 dex of the expected MS at 𝓏 = 7 (see Topping et al. 2022). |
| In the text | |
|
Fig. 3 Calibration of molecular gas masses from [CII] line measurements. Left: LIR vs. |
| In the text | |
|
Fig. 4 ISM scaling relations for the REBELS galaxies compared to the literature. Left: molecular gas-depletion timescale (tdep) as a function of offset to the MS (∆MS). Right: ratio of molecular gas to stellar mass (μmol) as a function of the offset to the MS (∆MS). In both panels, filled orange circles show the REBELS galaxies z = 6–8 with molecular gas masses derived from [CII] measurements. The green triangles show [C II] measurements in ALPINE galaxies at z = 4–6 (Béthermin et al. 2020). The gray squares and blue crosses show the CO and dust measurements from PHIBSS at z < 3 (Tacconi et al. 2018) and additional sources from the literature (see text), respectively. All samples have been restricted to galaxies with Mstars = 108.5−10 5 M⊙ to match the range spanned by REBELS galaxies. The solid blue, dashed magenta, and dot-dashed black lines represent the prescriptions for the scaling relations computed for the median mass of the REBELS sample, Mstars = 109 75 M⊙ and z = 7, from Scoville et al. (2017), Tacconi et al. (2018) and Liu et al. (2019), respectively. |
| In the text | |
|
Fig. 5 Evolution of the molecular ISM out to z = 7.5. Left: molecular gas-depletion timescale (tdep) as a function of redshift. Right: molecular gas-to-stellar mass ratio (μmol) as a function of redshift. The symbols are the same as in Fig. 4. Similarly, literature comparison samples are trimmed to fit the stellar mass range of the REBELS galaxies, Mstars = 108.5–10 5 M⊙. The open black squares represent the averages in each relevant redshift range. |
| In the text | |
|
Fig. 6 Cosmic density of molecular gas (ρmol) from REBELS at z = 6.5–7.5 compared to measurements from the literature. The filled red box region represents the [C II]-based measurement of this work. Literature data points come from various CO, dust, and [C II] surveys, including ASPECS CO (Decarli et al. 2020) and dust measurements (Magnelli et al. 2020), COLDz (Riechers et al. 2019), PHIBSS (Lenkić et al. 2020), ALMACAL (Klitsch et al. 2019), A3COSMOS (Liu et al. 2019), and dust measurements from Scoville et al. (2017) and ALPINE (Yan et al. 2020). The dotted green curve shows the cosmic SFR density (Madau & Dickinson 2014), scaled by a typical molecular gas-depletion timescale of 0.5 Gyr (Tacconi et al. 2020). REBELS measurements, which extend to z ~ 7, indicate a sustained decline of ρmol at earlier epochs. |
| In the text | |
Current usage metrics show cumulative count of Article Views (full-text article views including HTML views, PDF and ePub downloads, according to the available data) and Abstracts Views on Vision4Press platform.
Data correspond to usage on the plateform after 2015. The current usage metrics is available 48-96 hours after online publication and is updated daily on week days.
Initial download of the metrics may take a while.