Fig. 5
Download original image
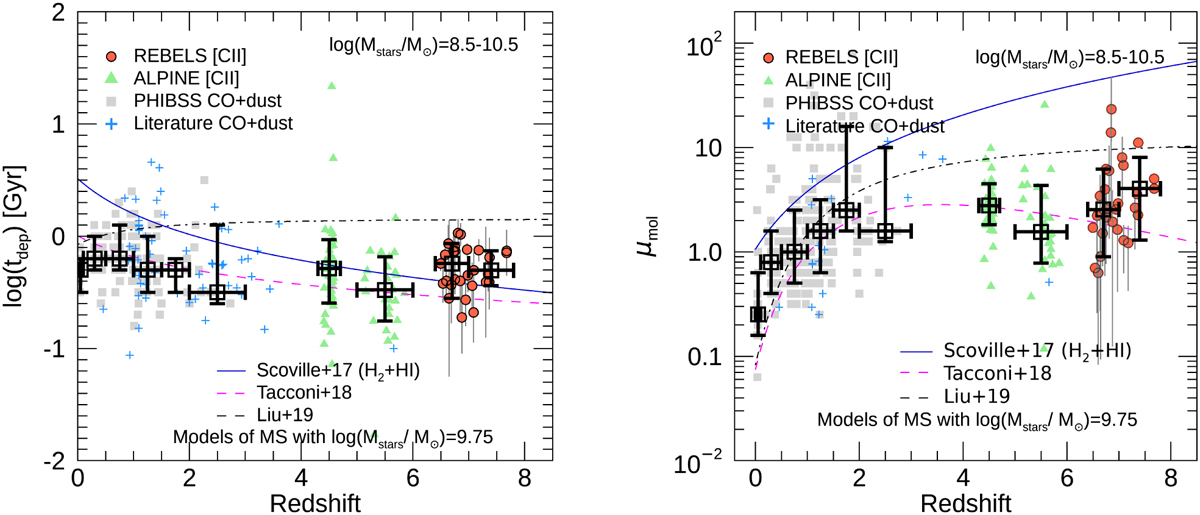
Evolution of the molecular ISM out to z = 7.5. Left: molecular gas-depletion timescale (tdep) as a function of redshift. Right: molecular gas-to-stellar mass ratio (μmol) as a function of redshift. The symbols are the same as in Fig. 4. Similarly, literature comparison samples are trimmed to fit the stellar mass range of the REBELS galaxies, Mstars = 108.5–10 5 M⊙. The open black squares represent the averages in each relevant redshift range.
Current usage metrics show cumulative count of Article Views (full-text article views including HTML views, PDF and ePub downloads, according to the available data) and Abstracts Views on Vision4Press platform.
Data correspond to usage on the plateform after 2015. The current usage metrics is available 48-96 hours after online publication and is updated daily on week days.
Initial download of the metrics may take a while.