Fig. 4
Download original image
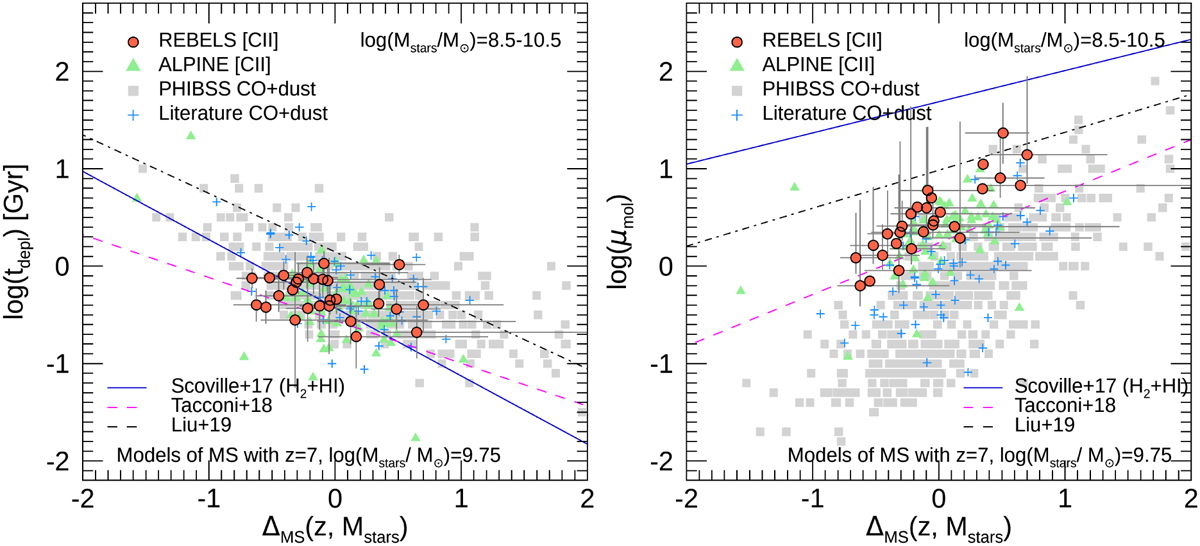
ISM scaling relations for the REBELS galaxies compared to the literature. Left: molecular gas-depletion timescale (tdep) as a function of offset to the MS (∆MS). Right: ratio of molecular gas to stellar mass (μmol) as a function of the offset to the MS (∆MS). In both panels, filled orange circles show the REBELS galaxies z = 6–8 with molecular gas masses derived from [CII] measurements. The green triangles show [C II] measurements in ALPINE galaxies at z = 4–6 (Béthermin et al. 2020). The gray squares and blue crosses show the CO and dust measurements from PHIBSS at z < 3 (Tacconi et al. 2018) and additional sources from the literature (see text), respectively. All samples have been restricted to galaxies with Mstars = 108.5−10 5 M⊙ to match the range spanned by REBELS galaxies. The solid blue, dashed magenta, and dot-dashed black lines represent the prescriptions for the scaling relations computed for the median mass of the REBELS sample, Mstars = 109 75 M⊙ and z = 7, from Scoville et al. (2017), Tacconi et al. (2018) and Liu et al. (2019), respectively.
Current usage metrics show cumulative count of Article Views (full-text article views including HTML views, PDF and ePub downloads, according to the available data) and Abstracts Views on Vision4Press platform.
Data correspond to usage on the plateform after 2015. The current usage metrics is available 48-96 hours after online publication and is updated daily on week days.
Initial download of the metrics may take a while.