Fig. 2
Download original image
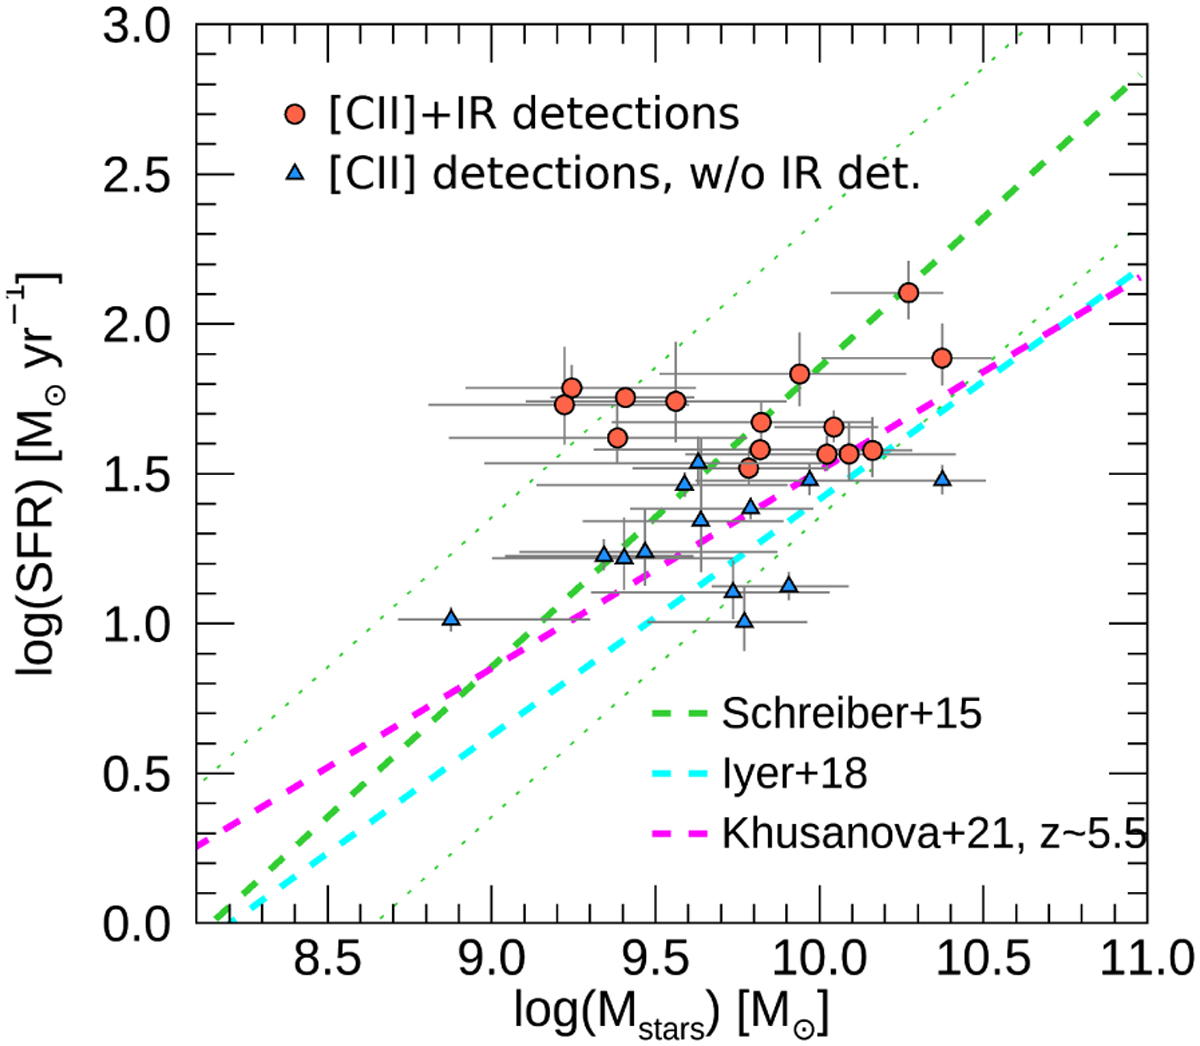
Diagram of the SFR(UV+IR) vs. stellar mass for the REBELS sources. The blue triangles show sources detected in [C II] emission without an IR continuum detection. The red circles show sources detected in [C ii] and IR emission. The dotted and dashed lines represent models of the star-forming MS at 𝓏 = 7 (Schreiber et al. 2015; Iyer et al. 2018) and at 𝓏 ~ 5.5 (Khusanova et al. 2021). Most of the REBELS galaxies are consistent with being within ±0.3 dex of the expected MS at 𝓏 = 7 (see Topping et al. 2022).
Current usage metrics show cumulative count of Article Views (full-text article views including HTML views, PDF and ePub downloads, according to the available data) and Abstracts Views on Vision4Press platform.
Data correspond to usage on the plateform after 2015. The current usage metrics is available 48-96 hours after online publication and is updated daily on week days.
Initial download of the metrics may take a while.