Fig. 3
Download original image
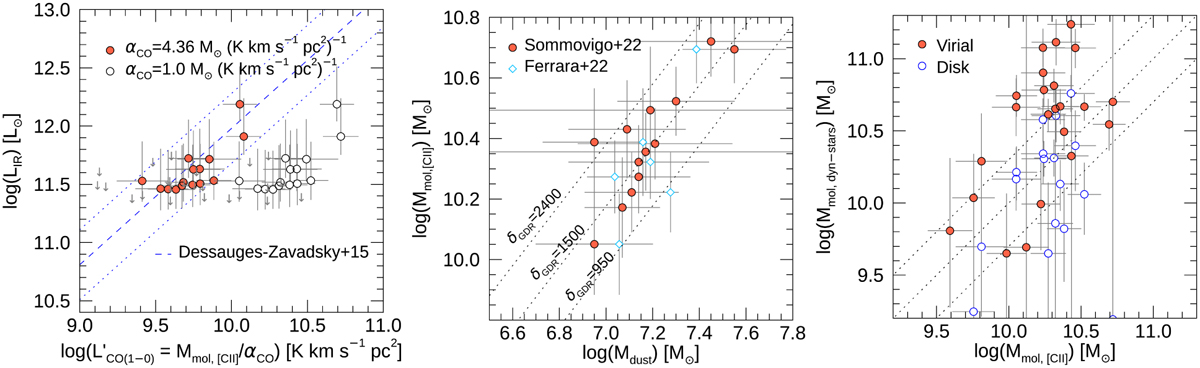
Calibration of molecular gas masses from [CII] line measurements. Left: LIR vs. ![]() for the REBELS galaxies. The filled orange circles show the result of assuming a Milky Way conversion factor, αCO = 4.6, and the open circles show the case of αCO = 1.0. The linear fit to CO(1–0) observations of local spiral and disk galaxies at high redshift compiled by Dessauges-Zavadsky et al. (2015) is shown as a dashed blue line (Daddi et al. 2010; Aravena et al. 2016c). The dotted line shows the same line, with a factor of ±0.3 dex, representing the typical scatter. Middle: comparison of the [C II]-based molecular gas masses for the REBELS galaxies with the dust mass estimates from the models from Ferrara et al. (2022) and Sommovigo et al. (2022), shown as blue diamonds and orange circles, respectively. The dotted lines highlight curves of constant gas-to-dust ratios. Right: comparison of the [C II]-based molecular gas masses (Mmol,[CII]) with estimates obtained from the dynamical and stellar masses (Mmol,dyn–stars). Derivations of the dynamical mass based on an assumed spherical (virial) and disk geometries are shown as filled and empty orange circles, respectively. The dotted lines represent the 1:1 relation and the range ±0.3 dex.
for the REBELS galaxies. The filled orange circles show the result of assuming a Milky Way conversion factor, αCO = 4.6, and the open circles show the case of αCO = 1.0. The linear fit to CO(1–0) observations of local spiral and disk galaxies at high redshift compiled by Dessauges-Zavadsky et al. (2015) is shown as a dashed blue line (Daddi et al. 2010; Aravena et al. 2016c). The dotted line shows the same line, with a factor of ±0.3 dex, representing the typical scatter. Middle: comparison of the [C II]-based molecular gas masses for the REBELS galaxies with the dust mass estimates from the models from Ferrara et al. (2022) and Sommovigo et al. (2022), shown as blue diamonds and orange circles, respectively. The dotted lines highlight curves of constant gas-to-dust ratios. Right: comparison of the [C II]-based molecular gas masses (Mmol,[CII]) with estimates obtained from the dynamical and stellar masses (Mmol,dyn–stars). Derivations of the dynamical mass based on an assumed spherical (virial) and disk geometries are shown as filled and empty orange circles, respectively. The dotted lines represent the 1:1 relation and the range ±0.3 dex.
Current usage metrics show cumulative count of Article Views (full-text article views including HTML views, PDF and ePub downloads, according to the available data) and Abstracts Views on Vision4Press platform.
Data correspond to usage on the plateform after 2015. The current usage metrics is available 48-96 hours after online publication and is updated daily on week days.
Initial download of the metrics may take a while.