Fig. 1
Download original image
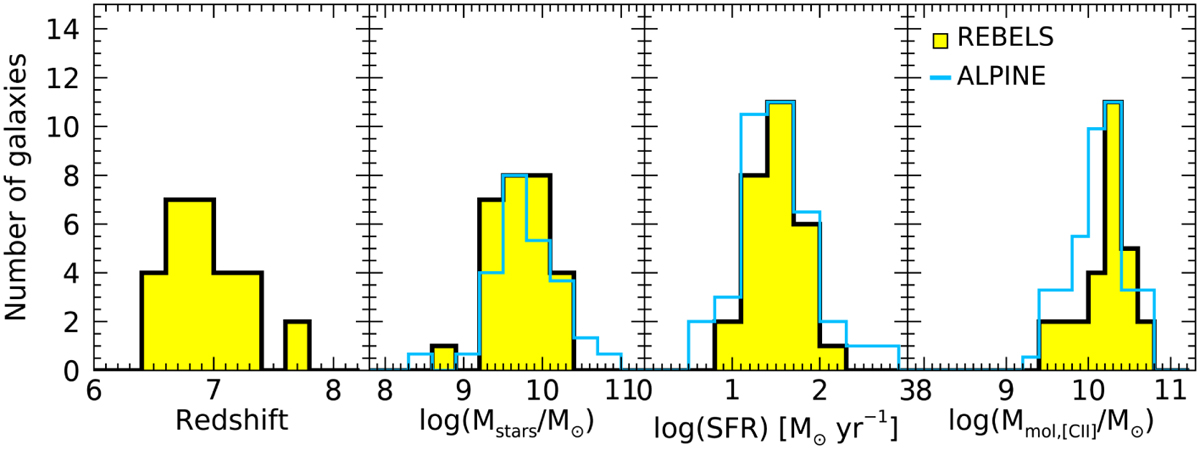
Distribution of the properties of the REBELS galaxies (filled yellow histogram) compared to the ALPINE galaxies (empty blue histogram). From left to right, we show the distribution of redshift, stellar mass, SFR (UV+IR), and [C II]-based molecular gas masses. Stellar masses are derived from nonparametric SED fitting as described in the text (Topping et al. 2022). The histogram for the ALPINE sample was normalized to the maximum number of REBELS galaxies. No comparison of the redshift distributions is provided because the samples cover different redshift ranges by construction.
Current usage metrics show cumulative count of Article Views (full-text article views including HTML views, PDF and ePub downloads, according to the available data) and Abstracts Views on Vision4Press platform.
Data correspond to usage on the plateform after 2015. The current usage metrics is available 48-96 hours after online publication and is updated daily on week days.
Initial download of the metrics may take a while.