| Issue |
A&A
Volume 682, February 2024
|
|
|---|---|---|
| Article Number | A163 | |
| Number of page(s) | 11 | |
| Section | Atomic, molecular, and nuclear data | |
| DOI | https://doi.org/10.1051/0004-6361/202245775 | |
| Published online | 19 February 2024 | |
Experimental study of the binding energy of NH3 on different types of ice and its impact on the snow line of NH3 and H2O
1
LERMA, CY Cergy Paris University,
5 mail Gay Lussac,
95000
Neuville-sur-Oise,
France
2
Max Planck Institute for Extraterrestrial Physics,
Giessenbachstraße 1,
85748
Garching,
Germany
e-mail: This email address is being protected from spambots. You need JavaScript enabled to view it.
Received:
23
December
2022
Accepted:
27
November
2023
Abstract
Context. Nitrogen-bearing molecules (such as N2H+ and NH3) are excellent tracers of high-density and low-temperature regions, such as dense cloud cores. Notably, they could help advance the understanding of snow lines in protoplanetary discs and the chemical evolution of comets. However, much remains unknown about the chemistry of N-bearing molecules on grain surfaces, which could play an important role in their formation and evolution.
Aims. In this work, we experimentally study the behaviour of NH3 on surfaces that mimic grain surfaces under interstellar conditions in the presence of some other major components of interstellar ices (i.e. H2O, CO2, CO). We measure the binding energy distributions of NH3 from different H2O ice substrates and also investigate how it could affect the NH3 snow line in protoplanetary discs.
Methods. We performed laboratory experiments using the ultra-high vacuum (UHV) set-up VENUS (VErs des NoUvelles Syntheses). We co-deposited NH3 along with other adsorbates (H2O, 13CO, and CO2) and performed temperature programmed desorption (TPD) and temperature programmed-during exposure desorption (TP-DED) experiments. The experiments were monitored using a quadrupole mass spectrometer and a Fourier transform reflection absorption infrared spectrometer (FT-RAIRS). We obtained the binding energy distribution of NH3 on crystalline ice (CI) and compact amorphous solid water ice by analysing the TPD profiles of NH3 obtained after depositions on these substrates.
Results. In the co-deposition experiments, we observed a significant delay in the desorption and a decrease of the desorption rate of NH3 when H2O is introduced into the co-deposited mixture of NH3–13CO or NH3–CO2, which is not the case in the absence of H2O. Secondly, we noticed that H2O traps roughly 5–9% of the co-deposited NH3, which is released during the phase change of water from amorphous to crystalline. Thirdly, we obtained a distribution of binding energy values of NH3 on both ice substrates instead of an individual value, as assumed in previous works. For CI, we obtained an energy distribution between 3780 K and 4080 K, and in the case of amorphous ice, the binding energy values were distributed between 3630 K and 5280 K; in both cases we used a pre-exponential factor of A = 1.94 × 10¹⁵ s−1.
Conclusions. From our experiments, we conclude that the behaviour of NH3 is significantly influenced by the presence of water, owing to the formation of hydrogen bonds with water, in line with quantum calculations. This interaction, in turn, preserves NH3 on the grain surfaces longer and up to higher temperatures, making it available closer to the central protostar in protoplanetary discs than previously thought. It explains well why the NH3 freeze-out in pre-stellar cores is efficient. When present along with H2O, CO2 also appears to impact the behaviour of NH3, retaining it at temperatures similar to those of water. This may impact the overall composition of comets, particularly the desorption of molecules from their surface as they approach the Sun.
Key words: astrochemistry / molecular processes / methods: laboratory: solid state / comets: general / protoplanetary disks / ISM: molecules
© The Authors 2024
 Open Access article, published by EDP Sciences, under the terms of the Creative Commons Attribution License (https://creativecommons.org/licenses/by/4.0), which permits unrestricted use, distribution, and reproduction in any medium, provided the original work is properly cited.
This article is published in open access under the Subscribe to Open model.
Open Access funding provided by Max Planck Society.
1 Introduction
Ammonia is one of the six major molecules found in the solid phase in interstellar ices (Boogert et al. 2015). It has been observed in a variety of environments in the universe, including comets (e.g. Poch et al. 2020), star-forming regions (e.g. Fehér et al. 2022), external galaxies (e.g. Gorski et al. 2018), the centre of our Galaxy (e.g. Sandqvist et al. 2017), and in the Solar System planets. It was first detected in the interstellar medium towards the Galactic centre by Cheung et al. (1968) through its J = 1, K = 1 inversion transition. In dense starless clouds, where temperatures can be as low as 6 K (Crapsi et al. 2007; Pagani et al. 2007) and number densities between 104 and 106 cm−3 (Keto & Caselli 2010), molecular gas tracers such as CO and CS are depleted from the gas phase and mainly reside on the surface of dust grains upon freeze-out (Caselli et al. 1999; Tafalla et al. 2002). A similar scenario (large degree of C-bearing molecular freeze-out) is expected in the mid-plane of protoplanetary discs, where number densities are orders of magnitude larger than the central regions of dense starless cores (Dutrey et al. 1997; Henning & Semenov 2013; Qi et al. 2013). However, N-bearing molecules, in particular, NH3 and N2H+ and their deuterated forms, appear to be more resilient to freeze-out (e.g. Caselli et al. 2002, Tafalla et al. 2002, 2004, Crapsi et al. 2007). For this reason, they are considered to be excellent tracers of dense and cold interstellar regions. More recent work using multi-transition studies done with the IRAM 30m antenna and high sensitivity interferometric observations with ALMA and JVLA has shown that these molecules freeze out within the central region of pre-stellar cores (e.g. Redaelli et al. 2019; Caselli et al. 2022; Pineda et al. 2022), although at higher densities than CO. Gas-grain astrochemical models are now able to reproduce the observations (Caselli et al. 2022; Pineda et al. 2022). Still, they are limited by uncertainties in such factors as the binding energies of NH3 and knowledge of its surface chemistry. Following the work of Collings et al. (2004), Penteado et al. (2017) derived binding energies for several species, including NH3. Similarly, Collings et al. (2004), He et al. (2016), and Suhasaria et al. (2015) have studied the desorption properties of NH3 from various substrates. However, the binding energies of NH3, the importance of surface chemistry for its formation, and its chemical desorption efficiency (Caselli et al. 2017; Sipilä et al. 2019) can still be better constrained.
Kruczkiewicz et al. (2021) has shown that ammonia can be efficiently stored in the form of ammonium salts, which at higher temperatures decompose to release ammonia into the gas phase irrespective of the presence or absence of water. This release into the gas phase occurs at a temperature higher than that of the desorption of water ice (T ~ 154 K) but lower than room temperature. This implies that ammonia could be found closer to a young stellar object than the water snow line. The majority of NH3 in molecular mantles should therefore be free to interact with the major components of interstellar or cometary ices such as water, CO2, or CO. Similarly, Poch et al. (2020) have demonstrated that ammonium salts are a dominant nitrogen reservoir on cometary surfaces, explaining the low measured cometary nitrogen-to-carbon ratio as compared to that of the Sun. Finally, as ammonia ice is one of the major nitrogen reservoirs in star-forming regions (Öberg et al. 2011), knowledge of the ammonia snow line is crucial when considering the formation and evolution of more complex N-bearing species in planetary systems.
The aim of this work is to study the behaviour of ammonia in the presence of different components of molecular ice mantles, such as H2O, CO, and CO2. We therefore performed studies to obtain the binding energy of ammonia on different water ice substrates, namely, compact amorphous solid water ice (c-ASW) and crystalline ice (CI). Additionally, we conducted experiments to determine the snow line of ammonia. The article is organised as follows: Sect. 2 describes the experimental set-up; Sect. 3 details the experiments and the results; Sect. 4 discusses the conclusion.
2 Experimental set-up
The experiments were performed on the VENUS (VErs de NoUvelles Syntheses) set-up, which allowed us to reproduce the conditions in cold, dark clouds (Congiu et al. 2020). The VENUS set-up consists of an ultra-high vacuum (UHV) chamber that can attain a base pressure of 1 × 10⁻¹⁰ hPa (1 hPa = 1 mbar) and five independent beams (which can be used simultaneously to inject the desired species). A quadrupole mass spectrometer (QMS) and the beam of a Fourier transform reflection absorption infrared spectrometer (FT-RAIRS) were also present in the UHV chamber (hereafter referred to as the main chamber) and could be used to make qualitative and quantitative measurements during the experiments. Depositions were made on a polycrystalline gold substrate enclosed within the main chamber. The substrate is chemically inert and acted as a proxy surface to dust grains for species adsorption and desorption for reactions. This surface was attached to the cold head of a closed-cycle He cryostat, which allowed the surface temperature to be varied between 10 K and 400 K. Four of the five beams were separated from the main chamber via two intermediary chambers. These intermediary chambers were responsible for regulating the pressure of the injected species between the four beams (p ~ 10−5−10−4 mbar) and the main chamber via differential pumping. The four beams were labelled as follows: top beam, central beam, right beam, and bottom beam. For the experiments in this paper, only the first three beams were used. The fifth beam was attached to the main chamber and could be used to inject species directly into the chamber (also known as ‘background deposition’).
3 Results
3.1 Co-deposition experiments
Our initial set of experiments were aimed at understanding the interaction of ammonia with the major components found on grain mantles. Our work considers three major molecules: H2O, CO, and CO2. However, for our experiments, we used 13CO (mass = 29 amu) instead of 12CO (mass = 28 amu) to allow for a clear distinction from atmospheric N2 (mass = 28 amu) by the QMS. Similarly, the major mass channels for water and NH3 are 18 amu and 17 amu, respectively. Water also has fragments of mass equal to 17 amu, and NH3 fragments into mass of 16 amu. To distinguish between these overlapping fragments of H2O and NH3, we performed experiments using each species separately, determined the ratio (percentage) of fragmentation into each mass by the QMS, and calibrated the quantities for each mass proportionately. Initially, we co-deposited ammonia with each of these components separately. We injected the species onto the gold substrate, which was maintained at a temperature of 10 K during the deposition. Each of these species was dosed using separate beams. A laser beam was used to ensure that every beamline overlapped on the same spot on the deposition substrate. The details of the alignment process can be found in Congiu et al. (2020) and have been omitted here for brevity. The pressure of the NH3, 13CO, and CO2 at the first stage of the beam was a few 10−5 mbar (corresponding to a flux: 0.1 sccm1), while that of H2O was roughly 4.8 × 10⁻⁵ mbar. We defined a monolayer as 1 × 10¹⁵ molecules cm−2. The reproducibility between two depositions is within a few percent, and the accuracy in the absolute determination of an ML is around 20%, as it is more precise for some molecules and less for other species (such as NH3). Table 1 lists the experiments used for the co-deposition experiments along with the ratios and monolayers of each species used. The raw data (mass spectra as well as IR spectra) are accessible online via a dedicated database2. We also carried out and analysed other sets of experiments under similar conditions. These experiments are listed in Appendix A and should be accessible online. For this article, we selected the experiments that best demonstrate our findings.
The inset in Fig. 1 represents the TPD of 1 ML NH3 on a gold substrate maintained at 10 K and was used to calibrate all the experiments. In the calibration experiment, to determine the dose for 1 ML, we performed a series of TPDs with various doses of NH3 on a gold substrate held at 10 K and a flux of 0.1 sccm in the injection chamber. We found that 1 ML of NH3 is deposited after approximately 9 min of deposition. The ramp for all the experiments was 0.2 K s−1. The details of the calibration can be found in Appendix B.
Figure 1 shows the TPD curves of the NH3−H2O codeposition experiments. In the calibration experiment, we observed a sudden rise in the NH3 desorption around 80 K, which falls off slowly once peak desorption has been completed. Contrarily, during the co-deposition with water, we observed a significant decrease of the NH3 desorption rate, and peak desorption shifted to higher temperatures. We found that about 6% of the deposited NH3 with regard to H2O was trapped by water and then released during the phase change of water from an amorphous to crystalline form. This trapped fraction was estimated by calculating the area under the TPD profile of the desired species (in this case NH3). In reality, water deposited at such a low temperature is fairly porous and, hence, has a larger surface area wherein the NH3 molecules can lodge themselves. As the temperature was raised, water underwent a phase change from amorphous to crystalline form, which can be observed through the plateau or “shoulder” at around 155 K in the desorption curve of water (Fig. 1; see also Speedy et al. 1996) as well as a change in the IR spectra (not shown here). During this phase change, water molecules began to re-arrange to form a crystalline structure, during which any NH3 in its bulk was pushed out. Furthermore, the higher the H2O/NH3 ratio, the more the desorption of ammonia was delayed – as expected. Indeed, when the NH3 concentration was very high, there were more NH3−NH3 interactions that could substitute for NH3−H2O interactions.
During the TPD of the co-deposition experiments of NH3−13CO mixture (Fig. 2), NH3 desorbs independently (top row Fig. 2a and b) of 13CO, irrespective of the ratio between the two. All of the NH3 was desorbed between 80 K and 132 K. The desorption is in good agreement with a fit to the desorption rate equation A × exp(−E/kbT), where E/kb is the binding energy (in Kelvins), T is the temperature (in Kelvins), and A is the pre-exponential factor (s−1). Since our experiments are in the multilayer regime (zero order kinetics), we chose E/kb = 2965 K and the A = 2.1 × 10¹² s−1 following Martín-Doménech et al. (2014) and assuming that 1 ML = 1015 molecules cm−2. The offset from the fit seen in Fig. 2b is due to the low quantities of NH3 used for the experiments. Higher quantities would ensure a good fit, as in the previous case.
When present with NH3 in equal quantities, 85.8% of the deposited 13CO is desorbed between 20 K and 50 K (Fig. 2c, middle row, orange curve). At the same time, 13CO exhibits a volcano effect due to NH3. A volcano effect is the sudden desorption of a volatile species trapped under a less volatile species, such as H2O, when the latter begins to desorb (Smith et al. 1997; Viti et al. 2004; Collings et al. 2003). This volcano effect can be observed through the peak between 68 K and 80 K, and it accounts for approximately 9% of the total desorbed 13CO. This trapping is not observed when NH3 is present in trace quantities, as expected (Fig. 2d). The 13CO peak between 90 K and 110 K is the CO desorbing with NH3. This is probably the CO being adsorbed on the substrate during the initial moments of the co-deposition and thereby becoming buried under the later layers of NH3 and 13CO. The right panels of Fig. 2 contain the experiments in proportions that are more astronomically relevant. Hence, there, NH3 is deposited in trace amounts (1 ML or sub-monolayer quantities) as compared to 13CO and H2O. Once again, for NH3, we observed a similar desorption trend as in the case of the experiments presented in Fig. 1.
In the presence of H2O, the trend in the desorption of NH3 and 13CO is different, as a significant delay in the desorption of NH3 was observed. When present in quantities roughly equal to water, the NH3 desorption rate is slower, and the desorption is delayed compared to its desorption in the absence of water. In the multi-layer (Fig. 2a) and the sub-monolayer (Fig. 2b) scenarios, the NH3 desorption is shifted to higher temperatures. In the former, NH3 desorption is delayed, possibly because it needs to diffuse through the bulk of the ice before desorption can take place. In the latter, at low concentrations, there is a higher probability for greater NH3−H2O interaction and lower NH3−NH3 interaction via hydrogen bonds, resulting in water holding on to NH3 for a little longer than when NH3 is present in larger quantities. We find it is worth noting that in both cases, an NH3 volcano peak was observed due to the crystallisation of water. Roughly 5% of NH3 with regard to water is trapped by water when co-deposited in equal quantities, and around 8.5% is trapped by water in the more astronomically relevant scenario (Expt 6 in Table 1) where it is released, as observed in previous experiments, during the H2O change of phase from amorphous to crystalline.
The co-deposition experiments of NH3 with CO2 also exhibited a similar behaviour as experiments with CO. The NH3 desorption appears to be unaffected by the presence of CO2 (Figs. 3a and b), as NH3 desorbed in the same temperature range as previously observed for experiments with 13CO. Its desorption fits well with the curve of the desorption rate equation mentioned earlier with the values taken from Martín-Doménech et al. (2014). When NH3 and CO2 are in equal quantities (Fig. 3b), the bulk of CO2 desorbs between 70 K and 92 K. Of the deposited CO2, 2% desorbs during the desorption of NH3. This could be due to mechanical trapping by NH3, and hence the former may be able to desorb only after all the NH3 has desorbed. The shift in peak desorption temperature of NH3 towards higher values as observed in Fig. 3b when compared to Fig. 3a is due to the fact that in the former, we had multiple layers of NH3. Additionally, in the sub-ML experiments (Figs. 3a, c and e), we used very low quantities of NH3, and therefore, the interaction between NH3 and the gold in the substrate became significant. Once again, the presence of H2O seems to significantly alter the desorption of both NH3 (Figs. 3a and b) and CO2 (Figs. 3c and d). The NH3 desorbed in a similar manner to the previous experiments with 13CO. Its desorption was not only delayed, but the rate was also slower. Roughly 9% of it was trapped and then later released during the phase change of H2O. The CO2 desorption, on the other hand, does not appear delayed. However, roughly 2% of it was trapped by water and then released along with NH3 during the phase change of H2O. In previous experimental works, Bossa et al. (2008) and Noble et al. (2014) have shown that carbamic acid (NH2COOH) can be formed as early as 80 K by thermal reaction of CO2 and NH3. We did not observe this reaction in our experiments, which were performed in much thinner layers, probably because this reaction only occurs if the reactants are solvated. Similarly, Potapov et al. (2019) reported the formation of  , which we did not observe in our experiments either.
Co-deposition experiments.
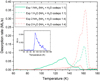 |
Fig. 1 NH3−H2O co-deposition experiments. All experiments were performed on a gold substrate. The TPDs had a ramp of 0.2 K s−1. The solid lines represent the desorption of NH3, while the dashed-dotted lines represent the desorption of water. Lines of the same colour belong to the same set of experiments. Inset: TPD of NH3 from a gold surface used to calibrate all the subsequent experiments. |
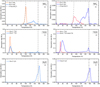 |
Fig. 2 NH3−13CO (and H2O) co-deposition experiments. The mass channels used for H2O, NH3, and 13CO are 18 amu, 17 amu, and 29 amu, respectively, also accounting for fragments of mass = 17 amu (for H2O) and 16 amu (for NH3). All experiments were performed on a gold substrate. The TPDs have a ramp of 0.2 K s−1. Lines of the same colour belong to the same set of experiments. The dash-dot vertical line at 155 K corresponds to the temperature of the phase change of water from amorphous to crystalline. |
3.2 Desorption of NH3 from different types of ices
A second set of experiments was performed to understand the desorption dynamics and determine the distribution of binding energies. The method used has been discussed in more detail in De Jong & Niemantsverdriet (1990), He et al. (2011), and Amiaud (2006). Subsequent depositions of roughly 1 ML of NH3 were made on each type of ice substrate followed by a TPD. Two kinds of ice substrates were used for this purpose: CI and c-ASW. The CI substrate was formed by depositing water onto the deposition surface held at 110 K followed by flash heating up to 150 K. To create a c-ASW substrate, water was deposited onto the gold substrate at 110 K and an incident angle of θ = 0° with respect to the normal angle of the gold substrate. A normal angle of incidence leads to a denser ice substrate, as shown by Kimmel et al. (2001a,b). Several studies have shown a key role between the deposition temperature and its effect on the ice substrate. Scott Smith et al. (2006) found that water deposited at ≤ 110 K is amorphous but already begins to pre-crystallise at ≥ 120 K since this state is thermodynamically favoured. He et al. (2019) and Bossa et al. (2012) observed a significant reduction in the porosity of the substrate beyond 100 K. These studies were performed on samples that are ~200 MLs and ~3000 MLs, respectively, while our present study focuses on thin ices (~tens of monolayers). Hence, it is safe to assume that the amorphous substrate formed in our case is indeed compact.
To prepare the raw data for analysis, an initial adjacent averaging smoothing process employing 35 data points was applied using Origin software. This initial smoothing was carried out to reduce background noise, which becomes significant at low dosages and high temperatures. Subsequently, the smoothed data was fed into a custom software developed at LERMA, which fits a set of 19 independent TPD curves distributed evenly over a range of 19 binding energies spanning from 3030 K to 5730 K. For a more comprehensive explanation of this method, we refer to Chaabouni et al. (2018). In our analysis, we used a pre-exponential factor, A, with a value of 1.94 × 10¹⁵ s−1, as per the findings in Table 2 of Minissale et al. (2022). The results are presented in the form of blue curves, representing the mass spectrometer data, and orange curves, representing the fit to the experiments conducted using software developed within our laboratory.
As Fig. 4 shows, NH3 on CI desorbs in a manner similar to NH3 on the gold substrate just as in the calibration experiments. There is a sharp increase in the desorption rate at 75 K. Most of the desorption occurs between 78 K and 140 K. On CI, we observed two peaks. The first one (between 76 K and 98 K) is the multi-layer desorption of NH3 due to its interaction with itself rather than with the surface, and it does not necessarily need full layers of NH3 to be present to appear. The second is between 98 K and 112 K, and we observed an increase in the height of this peak with each deposition. This implies that the surface evolves with each cycle of dosing the crystalline surface with NH3. In other words, NH3 is able to amorphise the surface structure of the ice by introducing defects onto its surface. This modification seems, however, to be a surface phenomenon and alters only the top layers of the surface. Even when the quantity of NH3 is increased, NH3 prefers to bind to H2O than with itself, as evidenced by the observed increase in peak height in Fig. 4. Nevertheless, this modification does not affect the desorption of either H2O or NH3, as the latter is eventually pushed out of the surface of CI during the desorption of water. This, in turn, renders it harder to calculate one single value of binding energy for NH3 on CI.
He et al. (2016) conducted a similar investigation in which they deposited NH3 onto a CI substrate to determine the binding energy of NH3 desorption. Our study exhibits considerable resemblance with their research, particularly with respect to their TPD curve obtained for a deposition of 2 ML. Noticeably, a major proportion of the desorption events in both studies occur within the temperature range of 80 K to 145 K. However, a discrepancy arises in the temperature at which the multilayer desorption peak is observed. He et al. reported this peak as occurring at a slightly elevated temperature, approximately 100 K. This difference could potentially be attributed to their use of a higher heating ramp rate, estimated to be around 0.5 Ks−1, during their TPD experiments. Another distinguishing feature between the two studies pertains to the temperature of complete desorption of the ices. In our investigation, we observed that the ices are nearly completely desorbed by 140 K, whereas He et al. (2015) noted the presence of desorption signals persisting beyond 140 K. Unfortunately, a more comprehensive comparison is hindered by a lack of specified units for the desorption rate in the pertinent figure within their study. But the difference in heating speed is certainly the main difference since the slower the heating, the earlier the desorption for an equivalent quantity. In terms of the determination of binding energies, He et al. (2015), adopting the direct inversion method, reported binding energy values falling within the range of approximately 2900 K to 4100 K. Notably, these binding energy values are lower than the values obtained in our study. This variance in binding energy values may be attributed to the use of a lower pre-exponential factor, specifically 1012 s−1, in their methodology as compared to the one employed in our study where we use the conversion formula proposed in Chaabouni et al. (2018) and reported in the review of Minissale et al. (2022).
In contrast, the desorption of NH3 on c-ASW (Fig. 5) occurs at higher temperatures. This delay could be associated with the structure of c-ASW, that is, due to the presence of concavities at the molecular level on its surface where NH3 can lodge itself and be surrounded by many water molecules and hence form more hydrogen bonds than in the case of CI. We observed a single broad peak, which is in contrast to what we observed with CI. A bulk of this desorption occurred between 95 K and 140 K. On CI, we obtained the binding energy between two mono-layers of ammonia in the range of 3180–3630 K and between ammonia and the surface of the water substrate in the range of 3780–4080 K. On c-ASW, we obtained binding energy values between 3630 K and 5280 K. Our binding energy values are in very good agreement with the values obtained for ASW ice via theoretical calculations by Tinacci et al. (2022), who also used the same value of the pre-exponential factor. We also note that in experiments as well as calculations, binding energy distributions are important and have a very good match with Germain et al. (2022). A more detailed discussion between the comparison of experiments and calculations derived values can be found in Ferrero et al. (2022).
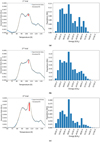 |
Fig. 4 Binding energy fits of the TPDs (left column) and the corresponding binding energy distribution histograms (right column) of three separate, subsequent depositions of 1 ML of NH3 on the surface of CI. Each deposition is followed by a TPD to remove the ammonia deposited on the ice substrate before the subsequent deposition was made. The preference of ammonia to bind to water instead of itself can be seen through the progressive increase in peak height (indicated by the red arrow) with each trial. |
3.3 Temperature programmed-during exposure desorption experiments
Figure 6 shows the basic schematics of a TP-DED experiment using the example of pure NH3 deposition. For this set of experiments, the desired species is deposited onto the gold substrate (Fig. 6a) while the latter is simultaneously heated or cooled at a constant ramp of 0.5 K min−1. During the heating process, as the deposition progresses, the species continues to accumulate or adsorb on the substrate (Fig. 6b) until the desorption temperature range of the former is reached. At this point, the species begins to slowly desorb from the substrate, and any incoming molecule of the species desorbs immediately (Fig. 6c) until no more incoming molecules can adsorb due to the temperature of the surface being higher than the desorption temperature (Fig. 6d). The reverse occurs during the cooling process. The experiment was monitored using the FT-RAIRS during the deposition and was usually followed by a TPD at the end. The details of each experiment are given in Table 2. The aim of this rather rarely used type of experiment was to mimic snow line regions where both accretion and depletion on grains (i.e. sticking and desorption) take place simultaneously. A snow line is defined in a region with a thermal gradient that applies on the grains (i.e. hotter towards the star and cooler in the outer regions) such that there exists a frontier zone (the snow line) where the accretion compensates for the desorption. Towards the colder side, the accretion dominates and the molecules condense onto the grains, whereas on the hotter side, the concerned species are in a gas phase. We emphasise that our goal was to investigate the snow line of NH3. The results of the experiments can be found in Fig. 7.
Our study plots the area under the IR peak at 3383 cm−1 of NH3 against temperature. The areas were calculated using the vibrational spectroscopy software OPUS by the company BRUKER. We applied a baseline correction where necessary. We find it important to mention that in experiments two and three, due to heavy baseline distortion and the fact that the IR peaks of NH3 were superimposed with that of H2O, we were obliged to make gross assumptions in order to obtain the IR area of NH3. Hence, the area we report on is the area of NH3 subtracted from the combined areas of NH3 and H2O.
All three experiments (see Figs. 7a–c) show distinct zones during the TP-DED. In the first experiment (Fig. 7a), Zone A corresponds to the accretion of NH3 in the amorphous form. Given the time to form 1 ML on the gold substrate, the signal before 60 K corresponds to NH3 on the substrate. Beyond this temperature, the observed signal is of NH3 on this NH3 layer.
Since the surface was continuously exposed to gaseous NH3 and the desorption was negligible for these temperatures, ammonia accumulated on the surface, and we observed a linear increase in the IR absorbance signal. The same trend would be observed for a constant surface temperature desorption. As the temperature rose, NH3 began to change its structure from amorphous to crystalline, denoted as Zone B and identifiable by a change in the slope. This was not due to a change in the flux of accretion, which is stable during every experiment, but is due to an increase in the absorption band strength after the phase transition. This phenomenon was also observed in Cazaux et al. (2022), where a similar change was found during the heating of H2S.
Around 81.5 K, we noticed a slowing down of the rise followed by a plateau (Fig. 7a, Zone C). Even though the desorption rate of NH3 increases exponentially, it was in competition with the accretion rate. As a result, a part of the adsorbed molecules was then desorbing, and thus the net accumulation slowed down to almost null at the snow line, which is the turning point of the curve at around 88 K. Above 90 K, we noticed a sudden drop in the NH3 desorption (Zone D). Here, despite the accretion, desorption still dominates. This occurred since there is no more measurable NH3 on the surface, as the adsorbed ammonia was desorbed quickly after adsorption, which is even faster in a laboratory measurement time frame.
We then performed a co-deposition of NH3 with H2O (see Fig.7b) under similar conditions. The first striking observation was the absence of the region of phase change of NH3 from amorphous to crystalline. This could be due to the aforementioned preference of NH3 to form hydrogen bonds with H2O than with itself. Hence, Zone E could be considered as the region that contains NH3 within the H2O structure. The turn-off point between Zone E and Zone C is less pronounced than in the previous case, and it marks the desorption of NH3 in interaction with itself and probably not the water ice. After roughly 105 K, there was a decrease in the quantity of NH3 due to the substrate reaching a higher desorption flux of NH3. However, an interesting point to note here is that there was still a significant quantity of NH3 left on the surface. This can be verified by the plateau (Zone F), which is an indicator of NH3 in H2O. This was due to the trapping phenomena observed earlier by H2O, and it was further strengthened by the NH3–H2O interaction. The slow decrease in the slope in Zone D corresponds to the release of NH3 due to the desorption of H2O as the latter approached its crystallisation temperature.
In the next set of experiments (Fig. 7c), we added CO2 to this mixture. During the experiment, we perceived a similar trend to that of the previous experiment with H2O at the beginning of the desorption process, that is, the sudden change in the curve for NH3 is very subtle, if at all present (Zone E). The accretion continued until the mixture reached around 97 K. At this temperature, we began to recognise some similarities with the previous two experiments. Firstly, the signal of the solid NH3 is characterised by a plateau (Zone C) due to the competition between NH3 accretion and desorption. This plateau was followed by a sudden yet short drop in the quantity of NH3, owing to the high temperature. Zone F marks the narrow plateau due to the NH3-H2O-CO2 interaction. We find it interesting to note that the quantity of NH3 (in other words, the IR area) in this zone is significantly higher than in the two previous cases. This could point to an additional interaction of NH3 with CO2 that retains NH3 until a higher temperature. However, the most interesting point to note between all three experiments is the progressive shift in the peak desorption temperature of NH3 as we added each new species to pure NH3, especially in the presence of H2O, and even more so with the addition of CO2. There is still some NH3 in the solid phase at unexpectedly high temperatures. In the case of the NH3-CO2-H2O mixture, the snow line (the turning point of NH3) coincides with the beginning of the des-orption of water, almost superimposing over their snow lines. This also raises a question about the potential role of CO2 in the desorption of NH3. These experiments directly demonstrate that NH3 lacks a snow line of its own when combined with H2O (and potentially CO2), which consequently retains the NH3 molecules on the grain up to higher temperatures than previously expected and, therefore, in a different spatial zone (the same as water).
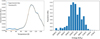 |
Fig. 5 Binding energy fit (left panel) for 1 ML deposition of NH3 on c-ASW ice and the corresponding binding energy histogram (right panel). |
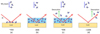 |
Fig. 6 Schematic explaining the sequence of events in the TP-DED experiment. Here, we used the example of an NH3 beam, but the same procedure follows for all three TP-DED experiments performed in this work. The temperatures in each sub-figure in the schematic are merely indicative due to the flux dependence of the adsorbate and do not represent the unique temperature at which the events take place. |
TP-DED experiments.
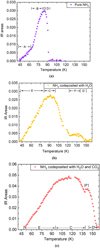 |
Fig. 7 Figure depicting the quantity of NH3 deposited with respect to temperature (K) during the TP-DED experiments, measured using a FT-RAIRS. For details on the zones A, B, C, D, D′, E, F, and F′, see main text, Sect. 3.3. |
4 Conclusions
Nitrogen-based molecules have been found in the densest parts of the interstellar medium, such as pre-stellar cores, where they freeze out at densities higher than those found for CO and other C-bearing molecules. Therefore, N-bearing molecules are excellent tracers of these dense regions that are otherwise difficult to observe. In this present work, we studied the interactions of NH3 on grain surfaces - which are still poorly understood -in the presence of other species found on grain surfaces, including H2O, CO2, and 13CO. We performed various types of experiments with the four species under conditions that mimicked those found in pre-stellar cores and protoplanetary discs, paying close attention to the behaviour of NH3 in each case. We also calculated the binding energy of NH3 on two different types of water substrates: compact amorphous solid water ice (c-ASW) and crystalline ice (CI). The main findings of our study are as follows:
- 1.
During the co-deposition of NH3 with H2O, we observed a delay in the desorption and a lowering of the NH3 des-orption rate. Additionally, H2O trapped around 6% of NH3, which was then released during the water phase change from amorphous to crystalline. However, when NH3 was co-deposited with either 13CO or CO2, we observed no such behaviour. This behaviour was observed once again when we added H2O to the NH3–13CO or NH3–CO2 mixture. In the NH3–13CO–H2O and the NH3–CO2–H2O experiments, we observed roughly 5–9% of trapped NH3 with respect to water, which was then released during the phase change of water from amorphous to crystalline;
- 2.
We note that NH3 has a range of binding energy values instead of a unique value, in agreement with recent theoretical calculations. For CI, we obtained NH3–H2O binding energy values in the range of 3780–4080 K. We observed that NH3 is able to amorphise the substrate surface by disrupting the structural order of the surface of the ice via hydrogen bonding with H2O. In the case of c-ASW, we obtained binding energies in the range of 3630-5280 K (for a pre-exponential factor set to A = 1.94 × 10¹⁵ s−1 in both cases);
- 3.
During the TP-DED experiments, the crystallisation of NH3 is noticeably impacted in the presence of H2O and CO2. Furthermore, the desorption temperature of NH3 increases significantly in their presence, and it desorbs over a longer range of temperatures. There is also some trapping of NH3 observed during the experiments. This indicates that NH3 has no definite snow line and seems to be strongly influenced by these species. The trapping enables it to be stored on the dust grains and is thereby available at later times and/or able to be transported to higher temperatures (e.g. closer to the central protostar or towards the inner disc of more evolved young stellar objects) in order to form more complex molecules.
In conclusion, our investigation sheds light on the intricate interactions of NH3 on grain surfaces, especially in the presence of key species such as H2O, CO2, and 13CO. The observed delays in desorption, various binding energies, and the influence of these species on NH3 crystallization underline the sensitivity of NH3 to the surrounding molecular environment. These findings contribute valuable insights into the understanding of nitrogen-bearing molecules in dense interstellar regions and their role in the chemical evolution in these regions.
Acknowledgements
This work was funded by CY Initiative of Ex-cellence (grant “Investissements d’Avenir” ANR-16-IDEX-0008), Agence Nationale de la recherche (ANR) SIRC project (Grant ANR-SPV202448 2020-2024), by the Programme National “Physique et Chimie du Milieu Interstellaire” (PCMI) of CNRS/INSU with INC/INP co-funded by CEA and CNES, and by the DIM-ACAV+, a funding programme of the Region Ile de France.
Appendix A:
Additional experiments carried out to study the behaviour of ammonia with H2O,13CO, and CO2 but not included in the main text.
Appendix B:
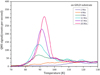 |
Fig. B.1 Experiments to calibrate for 1ML of NH3. TPD curves of NH3 were deposited on a gold substrate for various dosages in order to calibrate for 1 ML. We used a constant flux of 4.67 × 10⁻⁵ mbar and varied the duration of injection to vary the dosage. |
Figure B.1 shows the experiments performed to calibrate for 1 ML of NH3. Varying doses of NH3 were deposited onto the gold substrate at 10K followed by a TPD. During deposition, adsorption sites with the highest binding energy were occupied first followed by sites of lower binding energy until all the sites on the substrate were occupied. Hence, a species adsorbed on a site with a higher binding energy desorbs at a higher temperature, as opposed to desorption at lower temperatures for a site with a lower binding energy. Following this principle, at low dosages (< 1ML), peak desorption occurs at higher temperatures. As the dosage increases, this peak shifts to lower temperatures. Once every adsorption site on the substrate is occupied, the peak stops shifting to lower temperatures. At this stage, any other incoming NH3 binds to another NH3 already adsorbed on the surface, and the desorption then follows zeroth order kinetics. This can be seen as the increase in peak height (12 min curve and above in the figure) and the subsequent shifting of the curve towards higher temperatures. Our experiments obtained 1 ML for an exposure time higher than 8 minutes but lower than 12 minutes. Hence, we chose a time of 9 minutes, similar to the time we obtained for 13CO and N2 under similar beam conditions.
References
- Amiaud, L. 2006, PhD thesis, Cergy-Pontoise, France [Google Scholar]
- Boogert, A. A., Gerakines, P. A., & Whittet, D. C. 2015, ARA&A, 53, 541 [NASA ADS] [CrossRef] [Google Scholar]
- Bossa, B., Theulé, P., Duvernay, F., Borget, F., & Chiavassa, T. 2008, A&A, 492, 719 [NASA ADS] [CrossRef] [EDP Sciences] [Google Scholar]
- Bossa, J.-B., Isokoski, K., De Valois, M., & Linnartz, H. 2012, A&A, 545, A82 [NASA ADS] [CrossRef] [EDP Sciences] [Google Scholar]
- Caselli, P., Walmsley, C., Tafalla, M., Dore, L., & Myers, P. 1999, ApJ, 523, L165 [NASA ADS] [CrossRef] [Google Scholar]
- Caselli, P., Benson, P. J., Myers, P. C., & Tafalla, M. 2002, ApJ, 572, 238 [Google Scholar]
- Caselli, P., Bizzocchi, L., Keto, E., et al. 2017, A&A, 603, A1 [NASA ADS] [CrossRef] [EDP Sciences] [Google Scholar]
- Caselli, P., Pineda, J. E., Sipilä, O., et al. 2022, ApJ, 929, 13 [NASA ADS] [CrossRef] [Google Scholar]
- Cazaux, S., Carrascosa, H., Caro, G., et al. 2022, A&A, 657, A100 [NASA ADS] [CrossRef] [EDP Sciences] [Google Scholar]
- Chaabouni, H., Diana, S., Nguyen, T., & Dulieu, F. 2018, A&A, 612, A47 [NASA ADS] [CrossRef] [EDP Sciences] [Google Scholar]
- Cheung, A. C., Rank, D. M., Townes, C. H., Thornton, D. D., & Welch, W. J. 1968, Phys. Rev. Lett., 21, 1701 [NASA ADS] [CrossRef] [Google Scholar]
- Collings, M. P., Dever, J. W., Fraser, H. J., McCoustra, M. R., & Williams, D. A. 2003, ApJ, 583, 1058 [NASA ADS] [CrossRef] [Google Scholar]
- Collings, M. P., Anderson, M. A., Chen, R., et al. 2004, MNRAS, 354, 1133 [NASA ADS] [CrossRef] [Google Scholar]
- Congiu, E., Sow, A., Nguyen, T., Baouche, S., & Dulieu, F. 2020, Rev. Sci. Instrum., 91, 124504 [NASA ADS] [CrossRef] [Google Scholar]
- Crapsi, A., Caselli, P., Walmsley, M. C., & Tafalla, M. 2007, A&A, 470, 221 [NASA ADS] [CrossRef] [EDP Sciences] [Google Scholar]
- De Jong, A., & Niemantsverdriet, J. 1990, Surf. Sci., 233, 355 [CrossRef] [Google Scholar]
- Dutrey, A., Guilloteau, S., & Guelin, M. 1997, A&A, 317, L55 [NASA ADS] [Google Scholar]
- Fehér, O., Tóth, L. V., Kraus, A., et al. 2022, ApJS, 258, 17 [CrossRef] [Google Scholar]
- Ferrero, S., Grieco, F., Ibrahim Mohamed, A.-S., et al. 2022, MNRAS, 516, 2586 [CrossRef] [Google Scholar]
- Germain, A., Tinacci, L., Pantaleone, S., Ceccarelli, C., & Ugliengo, P. 2022, ACS Earth Space Chem. [Google Scholar]
- Gorski, M., Ott, J., Rand, R., et al. 2018, ApJ, 856, 134 [NASA ADS] [CrossRef] [Google Scholar]
- He, J., Frank, P., & Vidali, G. 2011, Phys. Chem. Chem. Phys., 13, 15803 [NASA ADS] [CrossRef] [Google Scholar]
- He, J., Shi, J., Hopkins, T., et al. 2015, ApJ, 801, 120 [NASA ADS] [CrossRef] [Google Scholar]
- He, J., Acharyya, K., & Vidali, G. 2016, ApJ, 825, 89 [Google Scholar]
- He, J., Clements, A. R., Emtiaz, S., et al. 2019, ApJ, 878, 94 [NASA ADS] [CrossRef] [Google Scholar]
- Henning, T., & Semenov, D. 2013, Chem. Rev., 113, 9016 [Google Scholar]
- Keto, E., & Caselli, P. 2010, MNRAS, 402, 1625 [Google Scholar]
- Kimmel, G. A., Dohnálek, Z., Stevenson, K. P., Smith, R. S., & Kay, B. D. 2001a, J. Chem. Phys., 114, 5295 [NASA ADS] [CrossRef] [Google Scholar]
- Kimmel, G. A., Stevenson, K. P., Dohnalek, Z., Smith, R. S., & Kay, B. D. 2001b, J. Chem. Phys., 114, 5284 [NASA ADS] [CrossRef] [Google Scholar]
- Kruczkiewicz, F., Vitorino, J., Congiu, E., Theulé, P., & Dulieu, F. 2021, A&A 652, A29 [NASA ADS] [CrossRef] [EDP Sciences] [Google Scholar]
- Martín-Doménech, R., Caro, G. M., Bueno, J., & Goesmann, F. 2014, A&A, 564, A8 [NASA ADS] [CrossRef] [EDP Sciences] [Google Scholar]
- Minissale, M., Aikawa, Y., Bergin, E., et al. 2022, ACS Earth Space Chem., 6, 597 [NASA ADS] [CrossRef] [Google Scholar]
- Noble, J., Theule, P., Duvernay, F., et al. 2014, Phys. Chem. Chem. Phys., 16, 23604 [NASA ADS] [CrossRef] [Google Scholar]
- Öberg, K. I., Boogert, A. C. A., Pontoppidan, K. M., et al. 2011, ApJ, 740, 109 [Google Scholar]
- Pagani, L., Bacmann, A., Cabrit, S., & Vastel, C. 2007, A&A, 467, 179 [NASA ADS] [CrossRef] [EDP Sciences] [Google Scholar]
- Penteado, E., Walsh, C., & Cuppen, H. 2017, ApJ, 844, 71 [NASA ADS] [CrossRef] [Google Scholar]
- Pineda, J. E., Harju, J., Caselli, P., et al. 2022, AJ, 163, 294 [NASA ADS] [CrossRef] [Google Scholar]
- Poch, O., Istiqomah, I., Quirico, E., et al. 2020, Science, 367, aaw7462 [NASA ADS] [CrossRef] [Google Scholar]
- Potapov, A., Theulé, P., Jäger, C., & Henning, T. 2019, ApJ, 878, L20 [NASA ADS] [CrossRef] [Google Scholar]
- Qi, C., Öberg, K. I., Wilner, D. J., et al. 2013, Science, 341, 630 [Google Scholar]
- Redaelli, E., Bizzocchi, L., Caselli, P., et al. 2019, A&A, 629, A15 [NASA ADS] [CrossRef] [EDP Sciences] [Google Scholar]
- Sandqvist, A., Hjalmarson, Å., Frisk, U., et al. 2017, A&A, 599, A135 [NASA ADS] [CrossRef] [EDP Sciences] [Google Scholar]
- Scott Smith, R., Zubkov, T., & Kay, B. D. 2006, J. Chem. Phys., 124, 114710 [NASA ADS] [CrossRef] [Google Scholar]
- Sipilä, O., Caselli, P., Redaelli, E., Juvela, M., & Bizzocchi, L. 2019, MNRAS, 487, 1269 [Google Scholar]
- Smith, R. S., Huang, C., Wong, E., & Kay, B. D. 1997, Phys. Rev. Lett., 79, 909 [NASA ADS] [CrossRef] [Google Scholar]
- Speedy, R. J., Debenedetti, P. G., Smith, R. S., Huang, C., & Kay, B. D. 1996, J. Chem. Phys., 105, 240 [NASA ADS] [CrossRef] [Google Scholar]
- Suhasaria, T., Thrower, J., & Zacharias, H. 2015, MNRAS, 454, 3317 [NASA ADS] [CrossRef] [Google Scholar]
- Tafalla, M., Myers, P., Caselli, P., Walmsley, C., & Comito, C. 2002, ApJ, 569, 815 [CrossRef] [Google Scholar]
- Tafalla, M., Myers, P., Caselli, P., & Walmsley, C. 2004, A&A, 416, 191 [NASA ADS] [CrossRef] [EDP Sciences] [Google Scholar]
- Tinacci, L., Germain, A., Pantaleone, S., et al. 2022, ACS Earth Space Chem., 6, 1514 [NASA ADS] [CrossRef] [Google Scholar]
- Viti, S., Collings, M. P., Dever, J. W., McCoustra, M. R., & Williams, D. A. 2004, MNRAS, 354, 1141 [NASA ADS] [CrossRef] [Google Scholar]
sccm = standard cubic centimetre.
All Tables
Additional experiments carried out to study the behaviour of ammonia with H2O,13CO, and CO2 but not included in the main text.
All Figures
|
Fig. 1 NH3−H2O co-deposition experiments. All experiments were performed on a gold substrate. The TPDs had a ramp of 0.2 K s−1. The solid lines represent the desorption of NH3, while the dashed-dotted lines represent the desorption of water. Lines of the same colour belong to the same set of experiments. Inset: TPD of NH3 from a gold surface used to calibrate all the subsequent experiments. |
| In the text | |
|
Fig. 2 NH3−13CO (and H2O) co-deposition experiments. The mass channels used for H2O, NH3, and 13CO are 18 amu, 17 amu, and 29 amu, respectively, also accounting for fragments of mass = 17 amu (for H2O) and 16 amu (for NH3). All experiments were performed on a gold substrate. The TPDs have a ramp of 0.2 K s−1. Lines of the same colour belong to the same set of experiments. The dash-dot vertical line at 155 K corresponds to the temperature of the phase change of water from amorphous to crystalline. |
| In the text | |
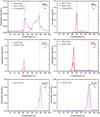 |
Fig. 3 Same as Fig. 2 but using CO2 instead of 13CO. The mass channel used for CO2 is 44 amu. |
| In the text | |
|
Fig. 4 Binding energy fits of the TPDs (left column) and the corresponding binding energy distribution histograms (right column) of three separate, subsequent depositions of 1 ML of NH3 on the surface of CI. Each deposition is followed by a TPD to remove the ammonia deposited on the ice substrate before the subsequent deposition was made. The preference of ammonia to bind to water instead of itself can be seen through the progressive increase in peak height (indicated by the red arrow) with each trial. |
| In the text | |
|
Fig. 5 Binding energy fit (left panel) for 1 ML deposition of NH3 on c-ASW ice and the corresponding binding energy histogram (right panel). |
| In the text | |
|
Fig. 6 Schematic explaining the sequence of events in the TP-DED experiment. Here, we used the example of an NH3 beam, but the same procedure follows for all three TP-DED experiments performed in this work. The temperatures in each sub-figure in the schematic are merely indicative due to the flux dependence of the adsorbate and do not represent the unique temperature at which the events take place. |
| In the text | |
|
Fig. 7 Figure depicting the quantity of NH3 deposited with respect to temperature (K) during the TP-DED experiments, measured using a FT-RAIRS. For details on the zones A, B, C, D, D′, E, F, and F′, see main text, Sect. 3.3. |
| In the text | |
|
Fig. B.1 Experiments to calibrate for 1ML of NH3. TPD curves of NH3 were deposited on a gold substrate for various dosages in order to calibrate for 1 ML. We used a constant flux of 4.67 × 10⁻⁵ mbar and varied the duration of injection to vary the dosage. |
| In the text | |
Current usage metrics show cumulative count of Article Views (full-text article views including HTML views, PDF and ePub downloads, according to the available data) and Abstracts Views on Vision4Press platform.
Data correspond to usage on the plateform after 2015. The current usage metrics is available 48-96 hours after online publication and is updated daily on week days.
Initial download of the metrics may take a while.