Fig. 1
Download original image
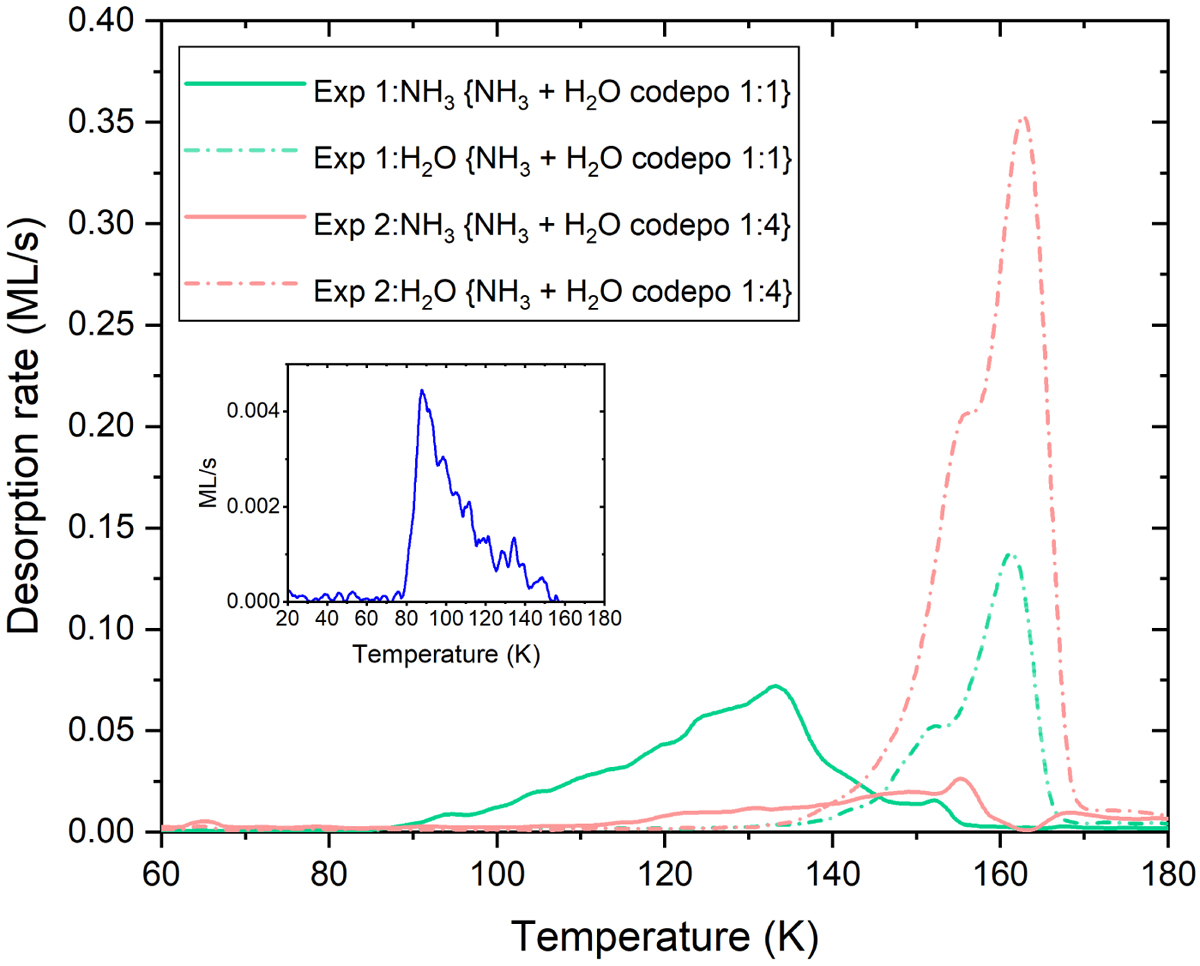
NH3−H2O co-deposition experiments. All experiments were performed on a gold substrate. The TPDs had a ramp of 0.2 K s−1. The solid lines represent the desorption of NH3, while the dashed-dotted lines represent the desorption of water. Lines of the same colour belong to the same set of experiments. Inset: TPD of NH3 from a gold surface used to calibrate all the subsequent experiments.
Current usage metrics show cumulative count of Article Views (full-text article views including HTML views, PDF and ePub downloads, according to the available data) and Abstracts Views on Vision4Press platform.
Data correspond to usage on the plateform after 2015. The current usage metrics is available 48-96 hours after online publication and is updated daily on week days.
Initial download of the metrics may take a while.