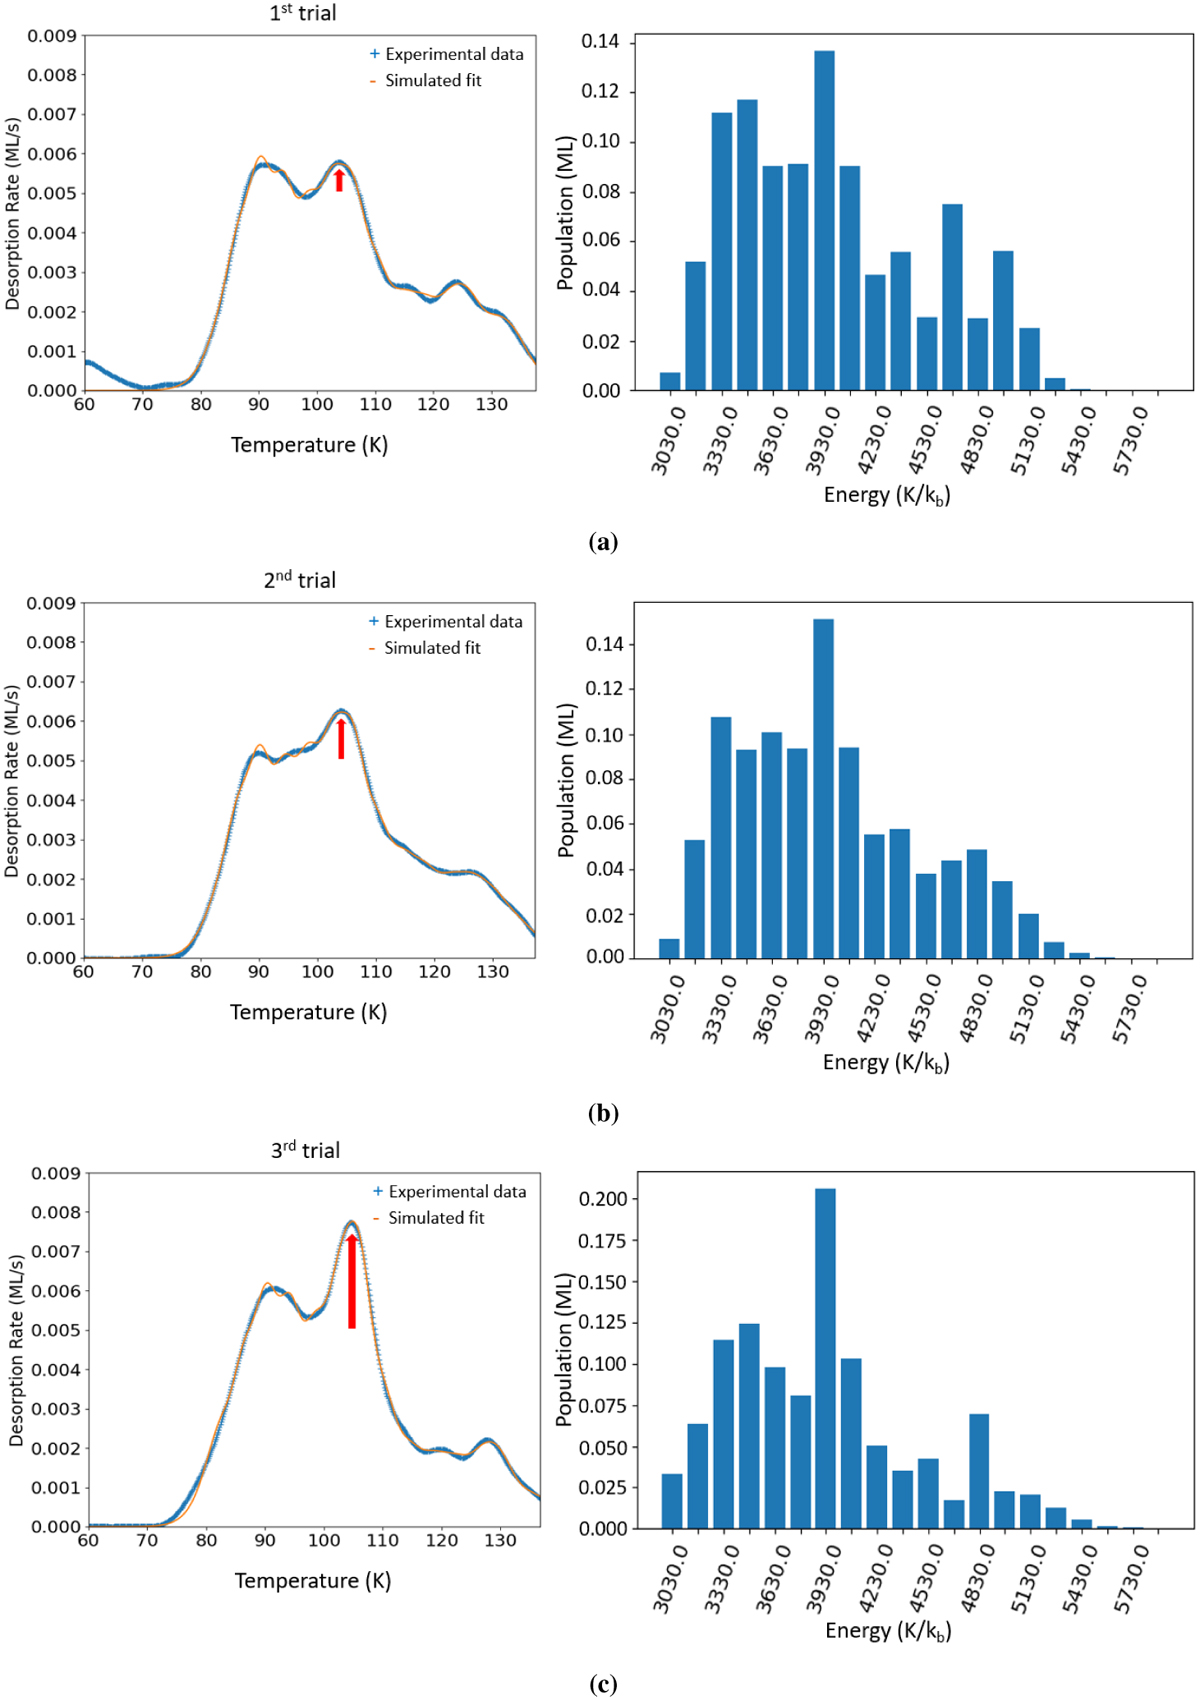
Fig. 4
Download original image
Binding energy fits of the TPDs (left column) and the corresponding binding energy distribution histograms (right column) of three separate, subsequent depositions of 1 ML of NH3 on the surface of CI. Each deposition is followed by a TPD to remove the ammonia deposited on the ice substrate before the subsequent deposition was made. The preference of ammonia to bind to water instead of itself can be seen through the progressive increase in peak height (indicated by the red arrow) with each trial.
Current usage metrics show cumulative count of Article Views (full-text article views including HTML views, PDF and ePub downloads, according to the available data) and Abstracts Views on Vision4Press platform.
Data correspond to usage on the plateform after 2015. The current usage metrics is available 48-96 hours after online publication and is updated daily on week days.
Initial download of the metrics may take a while.