Fig. 6
Download original image
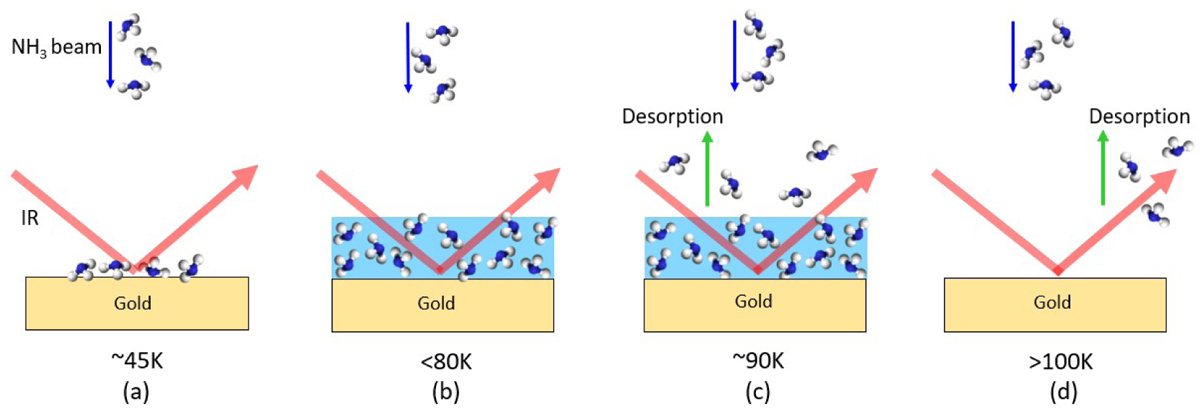
Schematic explaining the sequence of events in the TP-DED experiment. Here, we used the example of an NH3 beam, but the same procedure follows for all three TP-DED experiments performed in this work. The temperatures in each sub-figure in the schematic are merely indicative due to the flux dependence of the adsorbate and do not represent the unique temperature at which the events take place.
Current usage metrics show cumulative count of Article Views (full-text article views including HTML views, PDF and ePub downloads, according to the available data) and Abstracts Views on Vision4Press platform.
Data correspond to usage on the plateform after 2015. The current usage metrics is available 48-96 hours after online publication and is updated daily on week days.
Initial download of the metrics may take a while.