| Issue |
A&A
Volume 680, December 2023
|
|
|---|---|---|
| Article Number | A98 | |
| Number of page(s) | 21 | |
| Section | Extragalactic astronomy | |
| DOI | https://doi.org/10.1051/0004-6361/202346471 | |
| Published online | 15 December 2023 | |
A LOFAR sample of luminous compact sources coincident with nearby dwarf galaxies⋆
1
Anton Pannekoek Institute for Astronomy, University of Amsterdam, PO Box 94249, 1090 GE Amsterdam, The Netherlands
e-mail: This email address is being protected from spambots. You need JavaScript enabled to view it.
2
ASTRON, Netherlands Institute for Radio Astronomy, Oude Hoogeveensedijk 4, Dwingeloo 7991 PD, The Netherlands
3
Kapteyn Astronomical Institute, University of Groningen, PO Box 72, 97200 AB Groningen, The Netherlands
4
Caltech/IPAC, 1200 E. California Boulevard, Pasadena, CA 91125, USA
5
Center for Gravitation, Cosmology, and Astrophysics, Department of Physics, University of Wisconsin-Milwaukee, PO Box 413, Milwaukee, WI 53201, USA
6
Leiden Observatory, Leiden University, PO Box 9513, 2300 RA Leiden, The Netherlands
Received:
17
March
2023
Accepted:
3
October
2023
Abstract
The vast majority of extragalactic compact continuum radio sources are associated with star formation or jets from (super)massive black holes and, as such, are more likely to be found in association with starburst galaxies or early-type galaxies. Two new populations of radio sources were recently identified: (a) compact and persistent sources (PRSs) associated with fast radio bursts (FRBs) in dwarf galaxies and (b) compact sources in dwarf galaxies that could belong to the long-sought population of intermediate-mass black holes. Despite the interesting aspects of these newly found sources, the current sample size is small, limiting scrutiny of the underlying population. Here, we present a search for compact radio sources coincident with dwarf galaxies. We search the LOFAR Two-meter Sky Survey (LoTSS), the most sensitive low-frequency (144 MHz central frequency) large-area survey for optically thin synchrotron emission to date. Exploiting the high spatial resolution (6″) and low astrometric uncertainty (∼0.″2) of the LoTSS, we match its compact sources to the compiled sample of dwarf galaxies in the Census of the Local Universe, an Hα survey with the Palomar Observatory 48 inch Samuel Oschin Telescope. We identify 29 over-luminous compact radio sources, evaluate the probability of chance alignment within the sample, investigate the potential nature of these sources, and evaluate their volumetric density and volumetric rate. While optical line-ratio diagnostics on the nebular lines from the host galaxies support a star-formation origin rather than an AGN origin, future high-angular-resolution radio data are necessary to ascertain the origin of the radio sources. We discuss planned strategies to differentiate between candidate FRB hosts and intermediate-mass black holes.
Key words: stars: neutron / stars: black holes / galaxies: dwarf / radio continuum: general
Tables 1 and 3 are available at the CDS via anonymous ftp to cdsarc.cds.unistra.fr (130.79.128.5) or via https://cdsarc.cds.unistra.fr/viz-bin/cat/J/A+A/680/A98
© The Authors 2023
 Open Access article, published by EDP Sciences, under the terms of the Creative Commons Attribution License (https://creativecommons.org/licenses/by/4.0), which permits unrestricted use, distribution, and reproduction in any medium, provided the original work is properly cited.
This article is published in open access under the Subscribe to Open model. This email address is being protected from spambots. You need JavaScript enabled to view it. to support open access publication.
1. Introduction
FRB 20121102A was the first fast radio burst (FRB) source found to repeat (Spitler et al. 2016). Its repetitive nature rules out progenitor models related to cataclysmic explosions for at least a fraction of all FRBs. FRB 20121102A was also the first FRB source to be precisely localized to a host galaxy (Chatterjee et al. 2017) from a coordinated observing campaign between the Karl G. Jansky Very Large Array (VLA) and the 305 m William E. Gordon Telescope at the Arecibo Observatory. The host galaxy is a low-mass, low-metallicity dwarf at a redshift of z = 0.19273 ± 0.0008 (Tendulkar et al. 2017), and as such has the characteristics of a typical host to long gamma-ray bursts and super-luminous supernovae. These simple facts suggest that the mechanism driving FRBs may be linked to these latter phenomena. Moreover, FRB 20121102A was the first FRB found to be co-located with a persistent radio source (PRS; Chatterjee et al. 2017), with a luminosity of Lradio ∼ 1039 erg s−1, which is more 50 times what would be expected from star formation activity alone.
Very long baseline interferometry (VLBI) observations with the European VLBI Network (EVN) showed that the FRB and the PRS are located within ≲40 pc (transverse distance) of one another (Marcote et al. 2017), strongly connecting the two. Optical and far-infrared observations using the Hubble Space Telescope revealed that the FRB/PRS location is slightly offset from the centroid of a star formation knot within the host (Bassa et al. 2017). The PRS has a flat spectral index, that is, Sν ∝ να, with α ∼ −0.07 ± 0.03 below 10 GHz (Resmi et al. 2021), and with a possible turnover at lower frequencies, estimated as α ∼ 0.3 between 433 MHz and 1.4 GHz by Mondal et al. (2020). The spectral energy distribution (SED) derived from multiwavelength measurements and upper limits matches that of the Crab nebula, though with orders-of-magnitude higher luminosity. Finally, bursts from FRB 20121102A have a high and variable Faraday rotation measure (RM; Michilli et al. 2018), and the dispersion measure (DM) also shows secular changes (Hessels et al. 2019; Platts et al. 2021).
These measurements combined make a plausible case for an FRB engine that is a young, highly magnetized neutron star embedded in an expanding supernova remnant and powering a pulsar wind nebula (PWN; Murase et al. 2016; Margalit & Metzger 2018) or magnetar wind nebula (MWN; Margalit & Metzger 2018, Zhao & Wang 2021). Another plausible explanation is that the FRB engine is within the vicinity of a massive black hole, which in turn creates the PRS. In this context, the FRB source may be a neutron star near a black hole, or may even be a black hole jet. Other authors have suggested that an accreting compact object engine (e.g., ultra-luminous X-ray sources accreting at highly super-Eddington rates) could explain the PRS (Chen et al. 2022; Sridhar & Metzger 2022). There is only one other known repeating FRB co-localized to a PRS (Niu et al. 2022). Like FRB 20121102A, FRB 20190520B is hosted in a star-forming dwarf galaxy, with a large DMhost contribution, a high repetition rate, and its associated PRS has a shallow spectral index (α = −0.41 ± 0.04).
Given these two cases of FRB/PRS connection, it seems that PRSs represent an important aspect of some FRBs, even if their nature remains mysterious. If PRSs are wind nebulae, a limited lifespan during which they can be detected (∼few centuries; Gaensler & Slane 2006) could explain why only a subset of FRBs have a PRS counterpart. Considering a sample of 15 localized FRBs with radio sensitivity limits that could allow the detection of a PRS (including six repeating FRBs), Law et al. (2022) estimated that PRS occurrence could be as high as 20% for repeating FRBs given that 2 out of the 6 repeating FRBs in their sample are associated to a PRS. Furthermore, given that most FRBs with meaningful PRS limits would also limit PRS emission out to z ≈ 0.4, a distance that includes a similar number of repeating and nonrepeating FRBs – supporting the argument that PRS emission from repeaters and nonrepeaters is equally well-constrained – these authors estimate that PRS detectability in repeating FRBs is not strongly biased by distance.
Separately, Reines et al. (2020) identified a sample of compact radio sources associated with dwarf galaxies and suggested that they may be the long-sought population of intermediate-mass black holes (IMBHs, ∼102 − 105 M⊙; Greene et al. 2020) predicted to reside in dwarf galaxies (e.g., McConnell & Ma 2013; Reines & Volonteri 2015). Furthermore, the compact radio sample presented by Reines et al. (2020) has been shown to share many similarities with the PRS associated with FRB 20121102A, with radio luminosities, SEDs, light curves, ratios of radio-to-optical flux, and spatial offsets between the radio source and the host optical center being consistent with arising from the same population (Eftekhari et al. 2020).
Follow-up observations of the 13 dwarf galaxies with likely accreting IMBHs from Reines et al. (2020) with the Very Long Baseline Array (VLBA) led to four source detections at milliarcsecond (mas) resolution. These four sources have the largest offset from their host centroid in the sample, which suggests that they are all likely background AGNs (Sargent et al. 2022). Two sources among the VLBA nondetections are associated with spectroscopically confirmed AGNs that are consistent with being located at their galaxy photocenter. Sargent et al. (2022) also re-examined the radio–star formation relationship and found that a star-formation origin cannot be ruled out for approximately 5 out of the 9 VLBA nondetections. These authors conclude that these sources are either the posited wandering accreting massive black hole scenario, or simply background AGN.
While the existence of wandering black holes has yet to be definitively proven (IMBHs in dwarf galaxies have a much shallower gravitational potential than in more massive galaxies that could in theory allow for off-nuclear location), the well-documented case of FRB 20121102A nevertheless highlights that such off-nuclear compact radio emission can occur, even within a star forming region within the host galaxy. Although the connection between IMBHs, PRSs, and FRBs remains unclear – most FRB models prefer a magnetar progenitor (e.g., see discussion in Eftekhari et al. 2020) – over-luminous compact radio sources (OCRs) in dwarf galaxies are an interesting radio source population in their own right.
To improve our understanding of PRSs and their potential connection to the FRB and/or IMBH phenomena (e.g., constrain FRB progenitor models), it is imperative to increase the known sample size (Vohl et al. 2023). Here, we present a targeted search for compact radio sources coincident with dwarf galaxies using the LOFAR Two-Meter Sky Survey (LoTSS) second data release (DR2; Shimwell et al. 2022) – the most sensitive large-area survey for optically thin synchrotron emission to date – as our radio reference catalogue, and the Palomar Observatory 48 inch Samuel Oschin Telescope “Census of the Local Universe” (CLU; Cook et al. 2019) as our optical reference catalogue.
The article is organized as follows: in Sect. 2 we describe our candidate selection methodology and discuss chance alignment probability. In Sect. 3 we discuss the selected candidates, and complement the information available for our sample with ancillary survey data at various wavelengths. In Sect. 4 we discuss the potential nature of these sources and our plans for future work, and in Sect. 5 we close with a summary.
2. Candidate selection
2.1. Sample description
LoTSS DR2 comprizes 4 396 228 radio sources spanning over 5600 deg2 of the northern sky. LoTSS operates at a central frequency of 144 MHz with 48 MHz of bandwidth (120 − 168 MHz). The survey has a  angular resolution and a median root mean square (rms) sensitivity of about 80 μJy beam−1. Furthermore, with a
  astrometric uncertainty1 for sources brighter than 20 mJy – which is comparable to optical surveys – and a 90% point source completeness for sources ≥0.8 mJy beam−1, LoTSS DR2 represents an excellent catalogue for our study.
We cross-match LoTSS DR2 to the CLU-compiledcatalogue, a compilation of all known galaxies out to 200 Mpc (Cook et al. 2019). CLU-compiledis an extension to the CLU photometric survey carried out with four narrow-band Hα filters corresponding to redshifts up to z = 0.0471. CLU-compiledis a compilation from existing galaxy databases (NASA/IPAC Extragalactic Database (NED2), Hyperleda3, Extragalactic Distance Database4, the Sloan Digital Sky Survey DR12, the 2dF Galaxy Redshift Survey, and The Arecibo Legacy Fast ALFA (ALFALFA)) and is designed to provide the most complete list of galaxies with measured distances in the LIGO sensitivity volume. The compiled catalogue comprizes 271 867 sources, of which 95 047 fall within the LoTSS DR2 footprint. For brevity, we use the terms CLU and CLU-compiledinterchangeably throughout the paper. Distances based on Tully-Fischer methods were favored over kinematic (i.e., redshift) distances; however, the majority of the distances are based on redshift information. For cases where neither Tully-Fischer nor redshift was available, a distance based on the Hα filters is provided.
In addition to distances, CLU-compiledalso contains compiled photometric information. In particular, sources have been cross-matched to within 4″ with: (i) Sloan Digital Sky Survey (SDSS) data release 12 (Alam et al. 2015) for optical fluxes; (ii) GALEX all-sky (Martin et al. 2005; Bianchi et al. 2014) for far- and near-ultraviolet (FUV, NUV) Kron fluxes (Kron 1980); and (iii) Wide-field Infrared Survey Explorer (WISE; Wright et al. 2010) for mid-infrared fluxes. Additionally, CLU-compiledaggregates these ancillary data to cull contaminants (i.e., bright stars, high-redshift sources with emission lines shifted to within the CLU Hα bands) and measure several physical properties of galaxies such as their stellar mass and star formation rate (SFR).
We select sources in the mass range corresponding to dwarf galaxies (107 ≤ M*/M⊙ ≤ 3 × 10⁹), leaving 31 190 sources. We finally keep only galaxies with a valid SFR measurement, leaving 18 159 galaxies that form our parent sample. With regards to the LoTSS DR2 catalogue, we select sources with a peak brightness of ≥0.8 mJy beam−1, for a total of 2 622 903 sources. Furthermore, we constrain the matched sample to reject extended sources using the R99.9 compactness criterion (see Shimwell et al. 2022, Eq. (2)), where the ratio of the natural logarithm of the integrated flux density (SI) to peak brightness (SP) is less than or equal to the envelope that encompasses the 99.9 percentile of the SI/SP distribution, leaving 2 275 400 sources. Finally, we limit our source selection to those fitted with a single Gaussian component by the source finder pyBDSF (Mohan & Rafferty 2015), which was used to produce the LoTSS source catalogue, leaving 2 051 534 sources.
2.2. Cross-matching and filtering
We aim to identify OCRs dwelling in dwarf galaxies with luminosity exceeding the contribution expected from star formation alone. To find these, we cross-matched our subset of LoTSS and CLU sources (Sect. 2.1) using a radius of (6 + ϵ)″ (the angular resolution of LoTSS, with ϵ being the astrometric uncertainty for a given source), yielding 708 matches. We then rejected all sources that lie within three standard deviations of the radio luminosity versus star formation rate (L–SFR) relationship presented by Gürkan et al. (2018)5. This yields just 32 sources. It is worth noting that Smith et al. (2021) highlighted a dependence of the L–SFR relation on stellar mass, with galaxies at ∼109.5 M*/M⊙ following the relation from Gürkan et al. (2018), while those at lower masses tend to have a lower luminosity for a fixed SFR. Therefore, given the L-SFR mass dependence and that the stellar mass–metallicity relation indicates a trend where galaxy metallicity increases with increasing stellar mass (e.g., Curti et al. 2020), our sample selected above the 3σ threshold should be considered as a lower limit, and outliers are not simply due to low metallicity in their host galaxies.
We verify that redshift values listed in CLU match those of other measurements listed in the NED, because redshifted emission lines other than Hα could fall within the CLU filter and masquerade as Hα. Indeed, objects with incorrectly attributed redshifts will be over-represented in our sample, which is selected based on nonadherence to the L–SFR relationship. Among the 32 sources, we find that three objects have redshifts that are inconsistent with the median redshift from the NED. We therefore remove these from our sample, leaving 29 candidates. From these, 11 out of the 29 sources have spectra available in the NED. Next, we check IR magnitudes for any obvious AGNs by evaluating sources whose WISE colors fall within the AGN region prescribed by Jarrett et al. (2011, Eq. (1)), represented in Fig. 1. Two candidates fall within this AGN region, leaving 27 sources to be further scrutinized.
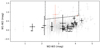 |
Fig. 1. WISE color–color plot. Photometric ratios in magnitude (mag) between three IR bands (W13.4 μm, W24.6 μm, W312 μm, with W1–W2, W2–W3). Black markers correspond to dwarf galaxies matched to a compact radio source with luminosity exceeding 3σ in the L–SFR relation. Gray-filled markers indicate dwarf galaxies matched to a radio source. We demarcate the two sources falling within the AGN region (Jarrett et al. 2011) marked by dashed lines within our sample as being classified. |
We depict the candidate selection on the L–SFR plane in Fig. 2. We discuss the distribution of matched galaxies (including all galaxy masses) along the L–SFR plane in Appendix A. Candidates are summarized in Table 1, and are investigated further in the following sections. Astrometric uncertainties provided by LoTSS were taken into account during cross-matching. Therefore, while a projected offset of 7″ is listed for ILT J125944.53+275800.9, the lower limit on its offset taking into account the radio astrometric uncertainties on right ascension and declination is  .
.
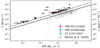 |
Fig. 2. Candidate selection via the L–SFR relation. Gray-filled markers indicate compact radio sources matched to dwarf galaxies matched. Black filled circles correspond to our final selection of OCRs matched to a dwarf galaxy with luminosity exceeding 3σ (dashed line) on the L–SFR relation by Gürkan et al. (2018, and the solid line) shows those with validated redshift. The uncertainty on luminosity is below the marker size. Orange markers are sources within the AGN region in Fig. 1. As a reference, we show PRS luminosity and the SFR of the host for both FRB 20121102A (Tendulkar et al. 2021; Law et al. 2022) and FRB 20190520B (Niu et al. 2022), with luminosity measurements scaled to 144 MHz using α from Resmi et al. (2021, evaluated between 2 MHz and 10 GHz,) and from Niu et al. (2022, evaluated between 1.5 and 5.5 GHz), respectively. We also show the transient source VT 1137+0337 using values from Dong & Hallinan (2023). Finally, we show Reines et al. (2020) galaxies (J0909+5655, J1136+2643, J1220+3020) matched in CLU for which SFR information is available, with luminosity scaled to 144 MHz using α values fitted between 1.4 GHz and 9 GHz by Eftekhari et al. (2020). The large scatter in luminosity is discussed in Sect. 2.3 and Appendix A. |
Properties of selected candidates.
2.3. Chance alignment probability
We begin by evaluating the likelihood of matching a galaxy and a background radio source by coincidence due to chance alignment following the two methods described by Reines et al. (2020). Firstly, we estimate the cumulative number of compact radio source counts per steradian N(Smin) with 144 MHz flux densities greater than Smin = 0.8 mJy, taking into account only compact sources based on pyBDSF single-component cases and the R99.9 compactness criterion. Multiplying N(Smin) ≈ 2051534 steradian−1 by the area confined in a 6″ radius circle gives Nbk, gal = 0.0032, the expected number of background sources for a given galaxy. Across our entire parent sample of 18 159 dwarf galaxies, we expect  background sources (where the error is computed for Poisson statistics). We therefore expect Nbk, samp to be present in our original 708 matches, or about 0.8%. Performing a similar analysis using a cross-matching radius of 2″ leads to Nbk, samp ≈ 6 ± 2 background sources (with an original number of matches of 573 using a 2″ cut), or about 1%. Considering that outliers caused by a false association should be evenly distributed above and below the L–SFR relation (Fig. 2), it is likely that nearly all candidates below the (2 + ϵ)″ mark and about half of the candidates above this threshold are true associations.
Secondly, we perform an empirical estimate of the expected number of false associations using the data. We cross-match each source in the CLU subsample to its nearest neighbor in LoTSS, up to a maximal matching radius of 40″. Figure 3 shows the observed offset distribution. The offset probability histogram for chance associations should be equal to zero at an offset of zero and rise linearly for small offsets (blue solid line in Fig. 3). The observed distribution is minimal at a matching radius of 6″, beyond which the number of sources per offset, N(doff), increases linearly as N(doff) = 3.1 doff, with offset doff in units of arcsec. The total estimated number of background sources with offsets of less than 6″ is found by integrating N(doff) from N(doff) = 0″ to 5″, which gives Nbk, samp ≈ 64 ± 8 sources. This is consistent with our calculation above using known radio source counts. Here again, putting a cut at 2″ (pink vertical line) leads to Nbk, samp ≈ 9 ± 3, which is also consistent within errors with the analytical method.
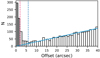 |
Fig. 3. Observed offset distribution after cross-matching CLU and LoTSS surveys, using a match radius of 40″. We select our target galaxies to have offsets of 2″ (pink vertical dashed line) and 6″ (blue vertical dashed line). The blue solid line shows the expected number of chance alignments with background sources as a function of offset. |
From these two analyses, it is unclear whether outliers on the L–SFR relation found in Sect. 2 are caused by chance alignment, where two unrelated sources lead to an incorrect luminosity calculation (e.g., a radio source is assigned an incorrect redshift). To resolve this issue, we performed Monte Carlo simulations. We repeated all cross-matching and outlier selection steps (as described in Sects. 2.1 and 2.2) after randomly shifting spatial coordinates for all sources within the LoTSS set in each Monte-Carlo run. For both cases, using 2″ and 6″ as the cross-matching radius limit, we performed 1000 realizations of the process, selecting spatial shifts from a uniform distribution of [ − 10, 10] arcmin, keeping track of the number of outliers at each realization.
Cumulative distributions summarising each Monte Carlo simulation are shown in Fig. 4. At 6″, for the entire sample of CLU, on average, it is common to find 10 matches (median) above the 3σ mark of the L–SFR relation by chance, and is unlikely to find 27 by chance (p ≪ 10−4). At a 2″ cutoff, it is common to get two matches by chance, and highly unlikely to find 16. Given our 16 matches selected below (2 + ϵ)″, we expect a false-positive fraction of 0.125. The remaining 11 sources with offsets between (2 + ϵ)−(6 + ϵ)″ may be chance alignments.
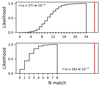 |
Fig. 4. Cumulative distributions from 1000 Monte Carlo realizations of matches exceeding 3σ on the L–SFR relation from Gürkan et al. (2018). Top panel: 6″ matching radius; bottom panel: 2″ matching radius. |
While this does not mean that candidates with a projected offset of greater than 2″ are necessarily chance alignments – for example, a small transverse distance may indicate a true association–, assessing whether or not they are real associations remains difficult with the currently available data. For this reason, we demarcate candidates below and above (2 + ϵ)″ in Table 1 and the following sections with a black line. Nevertheless, we show in the following section that nearly all candidates–both below and above this demarcation–fall within the optical footprint of their respective matched galaxies.
Finally, the redshift distribution of the selected candidates listed in Table 1 is vastly different from that of all dwarf galaxies from CLU in the LoTSS field (Fig. 5). A two-sample Kolmogorov–Smirnov (KS) test between these two distributions lends a p-value of 1.08 × 10⁻⁵, indicating the selected candidates do not simply track the redshift distribution of the whole CLU dwarf galaxy sample.
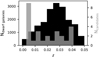 |
Fig. 5. Redshift distributions of selected candidates listed in Table 1 (gray) and for all dwarf galaxies from CLU in the LoTSS field (black). A two-sample KS test between these two distributions gives a p-value of ≪0.005. |
3. Candidates
The final candidate list includes 27 sources, with 16 having a projected offset of lower than (2 + ϵ)″. Composite images for each candidate in ascending order of offset are presented in Fig. 6 (offset ≲2″) and Fig. 7 (≳2″ and OCRs within the AGN region of Fig. 1), and candidates are detailed in Table 1. Given that all Hα filters used by CLU fall within the frequency range covered by the PanSTARRS (PS1; Chambers et al. 2016; Flewelling et al. 2020) r filter, we use PS1 to generate image cutouts around the coordinates of our candidates. The central coordinates of the matched objects from LoTSS and CLU are indicated by black crosses and plus symbols, respectively.
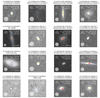 |
Fig. 6. Over-luminous compact radio sources with a projected offset of less than (2 + ϵ)″. Each panel indicates the source name from LoTSS and the host galaxy name above a PS1 R filter image in logarithmic gray scale. Contours indicate optical data from PS1 (Chambers et al. 2016; Flewelling et al. 2020) at μ + [1, 2, …, 10]σ levels, with μ and σ being the median and standard deviation, respectively. The black crosses and plus symbols (×, +) indicate the central coordinates of matched objects from LoTSS and CLU, respectively. LoTSS astrometric uncertainty is marked as a yellow box. Where available in the CLU catalog, we indicate a yellow ellipse corresponding to the Hα detection isophote (D25). For each panel, in the top left, we indicate the spatial offset (″) between the × and + markers as a white bar, along with corresponding transverse distance (pc). Top right: LoTSS radio flux at 144 MHz in mJy, with uncertainty on the last digit in parenthesis, host galaxy stellar mass ( |

All candidates shown in Fig. 6 and most candidates in Fig. 7 fall well within the galaxy contours. ILT J125940.18+275123.5 falls within the low-surface-brightness regions of its host galaxy, while the associated host galaxy of ILT J125940.18+275123.5 (candidate with largest offset) is of extremely low surface density, and likely a chance alignment (further discussed in Appendix B). SDSS J143037.09+352052.8 (matched to the AGN candidate ILT 143037.30+352053.3) is also extremely faint in the PS1 r filter image and may also be a chance alignment. However, data from the JVO Subaru/Suprime-Cam (Aihara et al. 2019) show the radio source to be within the galaxy (Appendix B).
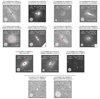 |
Fig. 7. Over-luminous compact radio sources with projected offset greater than (2 + ϵ)″. OCRs within the AGN region in Fig. 1 are shown below demarcation lines. See Fig. 6 for component descriptions. |
We note that galaxies 2MASS J13002220+2814499 (ILT J130022.42+281451.7), SDSS J125944.76+275807.1 (ILT J125944.53+275800.9), 2MASX J12594007+2751177 (ILT J125940.18+275123.5), and SSTSL2 J125915.27+274604.1 (ILT J125915.34+274604.2) are part of the cluster of galaxies ACO 1656 (Appendix C). Similarly, 2MASX J23171540+1843385 (ILT J231715.38+184339.0) is part of the compact group of galaxies HCG 94. Finally, the Simbad6 service7 indicates 2MASX J09133387+3000514 (ILT J091333.83+300056.9) as having a 75% probability of being a hierarchical member of the galaxy cluster HCG 37.
In the following subsections, we investigate the possible nature of the candidates by considering complementary information in ancillary surveys; for example, optical spectra and flux density measurements at other radio wavelengths.
3.1. Main source of ionization in host galaxies
A useful tool for distinguishing between galaxies with different prevailing photo-ionization sources is the family of emission line ratio diagnostic diagrams introduced by Baldwin et al. (1981, hereafter, BPT) in which the source location is determined by a pair of low-ionization, emission-line intensity ratios. We searched archival data8 for optical spectra to within 6″ of the CLU coordinates. In SDSS, we found 11 matches within our candidates, and 483 out of the total 708 matched dwarf galaxies. However, it is worth noting that ∼40% of nearby radio-loud AGNs are too gas poor and optically inactive to be detected via optical line ratio (Geréb et al. 2015). Furthermore, low-luminosity dwarf galaxies with low metallicities – particularly those with high star formation rates – are susceptible to contamination from stellar processes that can potentially hide AGN indicators (Reines et al. 2013; Molina et al. 2021). Using the normalized emission line measurements from the MPA-JHU9 spectroscopic reanalysis10 (Tremonti et al. 2004; Brinchmann et al. 2004), we evaluated the ratios of measured line fluxes (Table 2) for [O III]/Hβ against [N II]/Hα and [S II]/Hα. We show the results in Fig. 8.
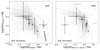 |
Fig. 8. BPT diagrams for sources with SDSS spectra showing the main source of ionization. Green and black markers correspond to sources with projected separation of less than or greater than (2 + ϵ)″, respectively. Gray circles are all “compact radio source-dwarf galaxy” matches with spectral line information in SDSS. Markers with a colored inner circle (colors other than black) occupy interesting parts of parameter space and are discussed in Sect. 4. The galaxy marked with a white inner circle lies above the gray line in the S II/Hα panel, while being well within the star formation range in the [N II]/Hα panel. Blue and pink inner circles fall within the composite region in the [N II]/Hα panel, where we can expect a contribution from both star formation (H II regions) and AGN activity. Finally, the galaxy marked by a cyan inner circle was classified as an AGN candidate by Truebenbach & Darling (2017) by selecting sources detected in the AllWISE and FIRST catalogs but not detected in 2MASS or SDSS DR7 and DR9. |
Emission line ratio measurements for host galaxies observed by SDSS.
3.2. Spectral indices in the radio band
A radio continuum spectrum dominated by nonthermal synchrotron emission has a characteristic power-law slope, Sv ∝ vα. To evaluate the spectral index α of our candidates, we cross-matched other radio surveys to within a 6″ radius from our source center. In particular, we searched the Rapid ASKAP Continuum Survey (RACS; McConnell et al. 2020, 1.25 GHz), the Faint Images of the Radio Sky at Twenty centimeters survey (FIRST; Becker et al. 1995, 1.4 GHz), the NRAO VLA Sky Survey (NVSS; Condon et al. 1998, 1.4 GHz), and the Very Large Array Sky Survey (VLASS; Lacy et al. 2020, 3 GHz). The coverage of each survey can be found in Appendix F.
We find a total of 12 matches among the 29 source candidates. Spatial coverage by the various surveys is discussed in Appendix F. Table 3 lists the multifrequency flux measurements used to evaluate spectral indices (α), following the order of sources in Table 1. Figure 9 presents for each matched source a radio spectrum and best model from fitting a single power law to flux measurements including uncertainties (dashed line), with corresponding α. The resulting spectral indices range between 0.2 ± 0.01 and −1.0 ± 0.10.
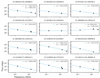 |
Fig. 9. Radio spectra of candidates matched in one or more of the RACS, FIRST, NVSS, and VLASS surveys, with central frequencies of 1.25 GHz, 1.4 GHz, 1.4 GHz, and 3 GHz, respectively. LoTSS observes at a central frequency of 144 MHz. The source name in LoTSS is indicated for each candidate. Black markers show flux measurements with uncertainties (small enough not to be visible), and the dashed blue lines show the best power-law fit over all frequencies, with power-law index α also indicated. Where applicable, a gray dashed line shows the best power-law fit at higher frequencies (∼1 − 3 GHz). |
Fluxes for candidates matched in at least one ancillary radio survey.
It is worth noting that if our sources are partially resolved by some surveys then our spectral index estimates will be systematically biased. The beam sizes of LoTSS (6″) and FIRST (5″) are comparable, while the beam of VLASS is slightly smaller (∼3″), and is larger in both NVSS and RACS (∼15″). We checked whether or not the sources were point-like by comparing the peak flux density to the integrated flux density in RACS, VLASS and LoTSS (NVSS does not provide peak flux information) in Fig. 10. In most cases, flux ratios in FIRST, RACS and VLASS point toward compactness, with median ratios of 1.0, 0.8, and 0.8, respectively (with a minimal ratio of 0.6, 0.6, and 0.8; and a maximal ratio of 1.7, 1.0, and 0.9). Despite the point-source-like nature of our candidates, we caution the reader that the possible presence of diffuse synchrotron emission from the host galaxy could have biased our flux estimates. This effect is especially apparent at very large beam size ratios (e.g., Venkattu et al. 2023). Unfortunately, we do not yet have VLBI detection of our sources to test this hypothesis: we cross-matched the candidates with the Radio Fundamental Catalog11 and mJIVE-20 (Deller & Middelberg 2014)–two VLBI datasets–, but found no matches.
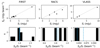 |
Fig. 10. Comparing peak flux (Sp) and integrated flux (Si, Tables 1 and 3) measurements in the various surveys. Gray lines in the upper panel indicate a 1:1 ratio. In the lower panel, the solid and dashed blue lines indicate the median and mean of each ratio distribution, respectively. NVSS does not provide peak flux information. |
3.3. X-ray and gamma ray bands
We searched the ancillary data from the Chandra and XMM-Newton (namely Chandra Source Catalog Release 2.012, XMM-EPIC, and XMM-EPIC-STACK) which we query via the astroquery (v0.4.6) ESA Sky module13, and the Burst Alert Spectroscopic Survey (BASS; Koss et al. 2017) to within 15″. Chandra SC2 observed 7 out of the 29 candidates, and XMM-Newton only 2. The only match (found in Chandra SC2) corresponds to the source 2CXO J125943.4+275802. The X-ray source covers the cluster of galaxies ACO 1656 mentioned in Sect. 3, and can be attributed to free-free emission (bremsstrahlung) at the cluster scale, and therefore not directly attributable to our compact source. It is worth noting that X-ray observations toward FRB 20121102A have not yet been constraining (Chatterjee et al. 2017; Marcote et al. 2017). Similarly, we search the Fermi 4FGL second data release to within 6 arcmin for gamma-ray emission (also with astroquery.esasky). All candidate fields have been observed; we did not find any match.
We find it difficult to interpret the X-ray nondetections using the fundamental plane of BH activity, that is, the empirical correlation between the continuum X-ray, radio emission, and mass of an accreting black hole (Gültekin et al. 2019). Firstly, the 6″spatial resolution data from LoTSS can only provide upper limits as it is not possible to isolate the nuclear core flux with good point-source sensitivity (which would require subarcsecond spatial resolution). Furthermore, LoTSS and any X-ray data mentioned in this section were not obtained simultaneously, and the timescale for variations in flux would be short for IMBHs, that is, scaling with the size of the “event horizon” and therefore with the black hole mass.
We obtained flux upper limits in the hard state for both Chandra (accessed with CSCview14, using values in the 2–7 keV range) and XMM-Newton (accessed with flix15 for XMM-Newton in the 2–10 keV range). We evaluate the upper limits using the prescription from Gültekin et al. (2019), which typically uses radio flux at 5 GHz, and X-ray flux at 2–10 keV. We scale radio flux to 5 GHz using either α = −0.7 or using spectral indices from Table 3 where available. Results are listed in Table 4, with estimated BH mass limits ranging from below ∼107 M⊙ to ∼108 M⊙. Given the reasons highlighted above, we advise the reader to use these upper limits with caution.
BH mass upper limits estimated from radio flux and X-ray flux limits.
4. Discussion
4.1. Cause of radio emission
We here investigate what can be ascertained about the potential progenitors of our selected candidates given emission line ratios and spectral index measurements presented in Sect. 3. Markers below and to the left of the solid and dashed gray lines in Fig. 8 indicate that the emission lines are due to star formation and not to AGN activity (Kewley et al. 2001; Kauffmann et al. 2003). Measurement uncertainties cannot definitively rule out an AGN contribution in three cases. For galaxies falling within the star formation region of this parameter space, ionising flux is primarily provided by hot, massive, young stars and associated supernovae surrounded by H II regions (Zajaček et al. 2019).
A few cases occupy interesting regions of parameter space. ILT J090406.54+530314.6 (white inner circles) sits above the gray line in the S II/Hα panel, while sitting well within the star formation range in the [N II]/Hα panel. ILT J075257.15+401026.3 (blue inner circles) and ILT J125940.18+275123.5 (pink inner circles) fall within the composite region between models from Kewley et al. (2001) and Kauffmann et al. (2003) in the [N II]/Hα panel. For these, we can expect a contribution from both star formation (H II regions) and AGN activity.
Similarly, the galaxy UGC 04068, which hosts ILT J075257.15+401026.3 has been classified as an AGN by Véron-Cetty & Véron (2010), while the classification based on the SDSS spectrum is simply “galaxy” (rather than other considered classes in SDSS nomenclature, such as QSO). There is a bright star located near the centroid of the galaxy (slightly leftward in Fig. 6) that may impact the overall flux observed in the spectrum, especially given the location of the SDSS spectrograph fiber (pink circle) almost exactly between the galaxy centroid and that of the bright star. It is also the only case within the candidates where the CLU catalog contains a fitted Hα D25 measurement. CLU J163850.64+352900.9 and 2MASX J09133387+3000514 are unclassified in SDSS, while all other matches are classified as galaxies.
Finally, we note that ILT J113634.77+592533.3 (cyan inner circles) was classified as an AGN candidate by Truebenbach & Darling (2017) by selecting sources detected in the AllWISE and FIRST catalogs, but not detected in 2MASS or SDSS DR7 and DR9. However, we note that the source may be matched to the galaxy SBS 1133+597, which has been observed by SDSS and for which the BPT diagram rather indicates that the driving source of ionization in the galaxy can be attributed to star formation.
The value of α helps distinguish between optically thin and optically thick emission mechanisms. We note that flux measurements from the archival surveys we used span several decades of observations, with FIRST and NVSS being the oldest, and RACS, VLASS and LoTSS being contemporaneous but not simultaneous. Using archival data spanning many decades comes with the caveat that measurements may be affected by time-dependent phenomena like scintillation or source evolution. In cases where radio emission is powered by an AGN, variability at various timescales (from days to years) can be expected with potential flux variations of the order of 100 mJy at GHz frequencies, and in rare cases varying by factors of several in flux density over timescales measured in decades (Nyland et al. 2020). Almost no variability is expected from star formation on the timescale covered by our data.
The range of spectral indices covered by various source types is known to differ. Pulsars have spectral indices of ≲ − 1.2 (Bates et al. 2013). Given the range of values of our candidates, they are unlikely to be pulsars. Moreover, we can assume that if an OCR (detected by LoTSS/FIRST/NVSS) is a radio pulsar, it would have to be Galactic, and would therefore be an unrelated foreground object in a chance alignment with the background galaxy as LoTSS should not be sensitive to extragalactic pulsars. Supernova remnants tend to have spectral indices ranging between −0.1 and −0.8 (Kothes et al. 2006; Alvarez et al. 2001). Six of our candidates fall within this range, including five cases with offset below (2 + ϵ)″. Planck Collaboration XV (2011) showed that the spectral indices of AGNs at low frequencies (1.1 − ≤70 GHz) are fairly flat, with an average of −0.06. Their distribution is narrow, with 91% of the indices being in the range α ∈ [ − 0.5, 0.5]. However, a few sources have remarkably steep spectra ≤ − 0.8, while others have inverted spectra (α = 0.86). Although our spectral indices are calculated at lower frequencies than these (where possible, we also computed the spectral index at higher frequency between 1.4 − 3 GHz), they all fall within this broad range.
Comparing spectral indices between 4.85 and 10.45 GHz from a distribution of radio sources with optical counterparts, Zajaček et al. (2019) showed that the ionization potential of sources with an inverted radio spectrum (α > −0.4) is weaker than that of sources with a steep radio spectrum (α < −0.7). In particular, simultaneous two-point α measurement at 4.85 and 10.45 GHz at Effelsberg highlighted that decreasing spectral indices from steep to flat (−0.7 < α < −0.4) to inverted leads to a decrease in typical line ratios (BPT diagram), particularly [O III]/Hβ.
Zajaček et al. (2019) considered radio loudness Rg in addition to α and ionization ratio in order to highlight three distinct classes of radio emitters resulting from recurrent nuclear jet activity distributed along the transition from Seyfert to LINER sources in the optical diagnostic, namely sources with: (class 1) steep α, high ionization ratio, and high radio loudness; (class 2) flat α, lower ionization ratio, and intermediate radio loudness; and (class 3) inverted α, low ionization ratio, and low radio loudness.
To compare our results to those of Zajaček et al. (2019), we computed Rg using the flux density from LoTSS, F144. We converted F144 into the ABν radio magnitude system of Oke & Gunn (1983), according to Ivezić et al. (2002): m1.4 = −2.5 log F1.4/3631 Jy, in which the zero point 3631 Jy does not depend on wavelength, and scaled the fluxes from 144 MHz to 1.4 GHz using either our fitted spectral indices or α = −0.7 otherwise. Subsequently, the radio loudness can be calculated as the ratio of the radio flux density to the optical flux density, Rg ≡ log Fradio/Foptical = 0.4(g − m144), with g corresponding to the magnitude in the optical g-band. We use SDSS magnitudes in the g band where available, and g-band Kron magnitudes from PS1 where available otherwise.
We list values of Rg in Table 1. For our whole set of candidates, Rg ranges between 0.05 and 2.48, with mean, median, and standard deviation of 1.21, 1.16, and 0.48, respectively. Sources for which we can evaluate Rg and emission line ratio between [O III] and Hβ are shown in the upper panel of Fig. 11, displaying α where possible using the color map16 and in gray otherwise. In addition, we show distributions of Rg (central panel) and α (lower panel) for candidates with and without available optical spectra in gray and black, respectively. In the lower panel, we mark the regions defined by Eckart et al. (1986) separating steep (α < −0.7, class 1), flat (−0.7 ≤ α ≤ −0.4, class 2), and inverted (α > −0.4, class 3) spectrum sources in blue, green and pink, respectively, in order to reflect the distributions of the spectral index for samples of radio-loud galaxies in the range of 1.6 − 5 GHz – regions of parameter space also used to classify sources by Zajaček et al. (2019).
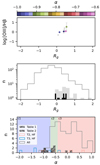 |
Fig. 11. Comparing radio loudness Rg, emission line ratio [O III]/Hβ, and spectral index, where available. From the sample of 26 Rg values (Table 1), 7 also have [O III]/Hβ values available (Table 2, alias T2; black bars in central panel), and 9 have fitted α values (Table 3, alias T3). HF indicates spectral indices fitted between 1.4 and 3 GHz. Class 1, 2, and 3 (c1, c2, c3) as defined by Eckart et al. (1986). Unfilled histograms in middle and lower panels represent all available “compact radio source-dwarf galaxy” matches below 3σ on the L–SFR relation. |
The region occupied in the emission line ratio–loudness plane by our matched sources corresponds to that of sources classified as class 3 by Zajaček et al. (2019, e.g., their Fig. 12), though with much lower Rg (the lower bound on Rg used by Zajaček et al. 2019 being ∼0.7). The sample used by these latter authors covered supermassive black holes (> 105 M⊙), explaining the loudness discrepancy where dwarf galaxies could be hosting IMBHs instead. Their spectral index distribution (black, lower panel) rather points toward class 1 or 2, even when considering α evaluated at higher frequencies (1.4 − 3 GHz; orange dotted border showing sources with associated spectrum; blue border showing all cases matched at high frequencies). Unfortunately, given that only four sources shown in the top panel of Fig. 11 were matched in other surveys to evaluate a spectral index, these results provide only small number statistics. Nevertheless, the initial information they carry points toward a mismatch between the primarily AGN-related source studied by Zajaček et al. (2019), which mainly fall along the demarcation line between Seyfert and LINER, and our candidates primarily located well within the star formation region of the BPT diagram, which strengthens our hypothesis that the OCRs in our sample are not AGNs. Follow-up observations at higher frequencies similar to those observed by Zajaček et al. (2019) would allow this tension to be further scrutinized.
4.2. Volumetric density and rate of over-luminous compact radio sources
The CLU catalog consists of galaxies selected to be within 200 Mpc and is complete to a flux limit of 10−14 erg s−1 cm−2. This limit corresponds to a dust-unobscured star formation rate of ≈1 M⊙ yr−1 (Cook et al. 2019). The 200 Mpc distance is small enough for us to assume a Euclidean geometry in our volume density calculations. Based on the 29 sources in Table 1, we can summarily compute a lower limit of 856 ± 150 sources Gpc−3 (1σ Poisson bounds in parentheses) for compact radio sources (on arcsecond-scales) above 0.8 mJy at 144 MHz that deviate by more than 3σ from the radio–SFR relationship. The limit is preliminary because VLBI observations are necessary to conclusively rule out a star-formation origin for our sources.
We can compare this rate to that suggested by Law et al. (2022) for persistent radio sources associated with FRB progenitors. These latter authors compute a volume density of 50 − 10 000 Gpc−3 for sources with a 1.4 GHz radio luminosity of greater than 1029 ergs s−1 Hz−1. A separate volume density computed by Ofek (2017) is close to the upper end of the density computed by Law et al. (2022). A source of 1029 erg s−1 Hz−1 luminosity placed at our survey horizon of 200 Mpc would have a flux density of 2.2 mJy. Given our survey completeness of 0.8 mJy, such a source would be detected in our survey if it was optically thin or if it had an inverted spectrum with a spectral index shallower than ≈0.4 (i.e., a relatively flat spectrum). However, our survey is also sensitive to closer sources with much lower flux densities.
To account for this, we assumed that the FRB-related PRS sources follow a Schechter luminosity function (Schechter 1976) with an exponent of −1 and a cut-off luminosity that is ten times the Law et al. (2022) normalization point of 1029 erg s−1 Hz−1. We also assumed that the sources have a flat spectrum and computed the number of sources that would likely exceed the 0.9 mJy completeness limit of our survey. We then numerically computed the expected number of detectable sources within a 200 Mpc horizon. For the 50 − 10 000 Gpc−3 range specified in Law et al. (2022), we expect to detect 0.3 − 58 sources, which is consistent with our yield of 28 candidates. Values of cut-off luminosity in excess of 1030.5 erg s−1 Hz−1 are necessary to create a tension between our yield and the Law et al. (2022) rates. While the consistency is encouraging, we caution against drawing firm conclusions because of the unknown FRB beaming fraction on which the Law et al. (2022) estimate is based, along with the disparate selection filters applied in the analysis of these latter authors and ours.
4.3. Star formation versus active (intermediate-mass) black holes
Condon et al. (2019) evaluated the luminosity functions for sources whose radio emission is dominated by star formation and AGN, respectively. After scaling the luminosity of our candidates to 1.4 GHz using either the spectral indices evaluated in Sect. 3.2 or α ≈ −0.7 for typical synchrotron spectra of optically thin radio sources for the remaining sources, we find luminosity values ranging between 1017.9 and 1022.7 W Hz−1, with a median of 1019.9 W Hz−1. Compared to the luminosity functions for star formation and AGN of Condon et al. (2019), the radio emission from our candidates is more likely attributable to star formation.
A critical step towards establishing the candidates presented in previous sections as potential FRB hosts is to conclusively determine the compactness of these sources. To this end, we obtained time on the European VLBI network (EVN) and e-MERLIN to observe the most likely candidates. Compactness in LoTSS images only ensures a brightness temperature of ≳104 K, which is insufficient to rule out unusually radio-bright star formation as the cause of the radio emission. Moreover, our sources may have a significant component of their radio flux attributed to star formation with the rest in a compact source component. VLBI at ≲ 10 mas resolution is therefore the best observational technique to totally eliminate (i.e., resolve out) the star-formation component and establish the presence of a compact source. Furthermore, including the e-MERLIN array should allow us to distinguish between compact and star-formation components, if present. In addition, we are in the process of reimaging the archival LoTSS radio data on these sources while including the international stations from LOFAR. The resulting images should have a resolution of about  (LOFAR-VLBI; Morabito et al. 2022). These higher-angular-resolution images should inform us about the following possible outcomes.
If a target were not detected at very high resolution then it would confirm the star-formation hypothesis. This would be a rather unusual conclusion as the selected targets all violate the radio–SFR relationship, and so a nondetection at very high resolution would cast doubt on the canonical radio-AGN selection technique that is widely used (Davis et al. 2022). It is possible that AGN-related flux is present on intermediate scales of a few hundred milliarcseconds, which are inaccessible to the EVN, but should be accessible by the intermediate scale of e-MERLIN. Moreover, in such a case, AGN-related flux should also be detectable with LOFAR long-baseline data.
The detection of a core–jet structure would confirm the AGN-like IMBH hypothesis. Although the radio detection of black-hole jet candidates in dwarf galaxies based on the procedure mentioned in Sect. 2 is now becoming feasible (Davis et al. 2022), confirmatory VLBI detection of the jet (or structure thereof) is rare (Paragi et al. 2014; Yang et al. 2020; Eftekhari et al. 2020). As such, confirmation of the AGN hypothesis will have interesting scientific consequences for studies of feedback in dwarf galaxies.
If an unresolved point is detected, although it would rule out the star-formation hypothesis, both the PWN and unresolved AGN would remain plausible–even if the source proves to be slightly (≪1″) offset from the optical stellar light centroid. Based on the known properties of starburst galaxies, a detection on EVN long baselines should exclude star formation as the cause of the bulk of the radio emission (Condon et al. 1991). Here, a path forward would be to follow-up such sources to model their broad-band SED (e.g., with optical spectroscopy directly on-source to search for canonical AGN signatures, and with radio observations at C, X, and K bands) in order to decipher between the PWN and AGN hypotheses.
4.4. Future search for FRBs
Finally, we also plan to search these targets for millisecond-duration bursts with the 25 m Westerbork Synthesis Radio Telescope. Starting with the hypothesis that some are similar in nature to currently known PRSs, we can expect these to be repeating FRB sources. Furthermore, given the periodic activity of some FRBs, such as FRB 20121102A (Cruces et al. 2021; Rajwade et al. 2020) and FRB 20180916B (Chime/Frb Collaboration 2020),), it is plausible that a subset of our candidates could also display on/off phases of FRB emission.
5. Summary
In this paper, we present a targeted search for OCRs coincident with dwarf galaxies up to z ≲ 0.05.
-
We identified candidate compact sources with luminosity exceeding 3σ relative to the L–SFR relation (Gürkan et al. 2018).
-
Through ancillary surveys, we investigated the possible nature of the candidates.
-
Emission line ratios from SDSS spectra show the main source of ionization in the host galaxies where the candidates are located is likely star formation, and not AGN activity.
-
Spectral indices suggest that our candidates could be SNRs or AGNs–although, the combination of α with emission line ratios and radio loudness provides evidence that we may be observing sources other than typical AGNs.
-
A comparison to the luminosity functions for star formation and AGN of Condon et al. (2019) indicates that radio emission from our candidates is more likely attributable to star formation.
-
We derive a preliminary lower limit of 856 ± 150 sources Gpc−3 (1σ Poisson bounds in parentheses) for compact radio sources (on arcsecond-scales) above 0.8 mJy at 144 MHz that deviate by more than 3σ from the radio–SFR relationship.
-
For the 50 − 10 000 Gpc−3 range specified in Law et al. (2022), we expect to detect 0.3 − 58 sources within the 200 Mpc horizon of our optical parent sample, which is consistent with our yield of 28 candidates.
Follow-up high-angular-resolution imaging should allow us to further describe these outlying radio sources. Furthermore, searching these sources for high-time-resolution bursts may inform us about the FRB progenitor. If only a subsample of our candidates turn out to be active sources of persistent radio emission associated to FRBs, as is the case for those presented by Chatterjee et al. (2017) and Niu et al. (2022), it would be possible to evaluate whether or not these are indeed calorimeters allowing us to estimate the energy output of the central FRB engine.
We end by noting that due to the unprecedented sensitivity of LoTSS to optically thin synchrotron sources in a wide-angle survey, we have been able to select interesting radio sources in dwarf galaxies. The proposed VLBI observations are a crucial step toward the discovery of a new population of either wind nebulae or black holes in nearby17 dwarf galaxies–both outcomes being scientifically interesting.
Namely, the uncertainty tying the LoTSS radio frame to the PanSTARRS (PS1; Chambers et al. 2016) frame, along with the formal error to evaluate the source centroid, given by  , where S/N is the signal-to-noise ratio. For ≳mJy level sources detected at ≳10σ, the latter is dominant. We refer the reader to Shimwell et al. (2022) for further details about astrometry in LoTSS DR2.
For consistency with Gürkan et al. (2018), throughout this paper, we use a concordance cosmology with H0 = 70 km s−1 Mpc−1, Ωm = 0.3, and ΩΛ = 0.7.
Data from: SDSS (Abdurro’uf et al. 2022) DR 17, CALIFA (Calar Alto Legacy Integral Field Area; González Delgado et al. 2015) survey, and LAMOST (Large Sky Area Multi-Object Fibre Spectroscopic Telescope; Guo et al. 2022) survey.
A collaboration of researchers from the Max Planck Institute for Astrophysics (MPA) and the Johns Hopkins University (JHU).
Values are taken from the table galSpecLine. A table description is available at http://skyserver.sdss.org/dr17/MoreTools/browser/.
http://astrogeo.org/rfc/, last visited 27 June 2023.
https://astroquery.readthedocs.io/en/latest/esasky/esasky.html
https://cxc.harvard.edu/csc/gui/intro.html, last accessed 18 July 2023.
https://www.ledas.ac.uk/flix/flix.html, last accessed 18 July 2023.
We note that the point with α ∼ −0.6 shown in pink is calculated using detections at all available frequencies, and that its equivalent at higher frequencies corresponds to −0.88, as shown in Table 3.
Acknowledgments
This work was carried out in part through funding from the European Open Science Cloud (EOSC) Future, an EU-funded H2020 project. D.V. thanks Benito Marcote, Shivani Bhandari, Kenzie Nimmo, and Betsey Adams for valuable discussions. We thank our referee for constructive comments. LOFAR is the Low Frequency Array designed and constructed by ASTRON. It has observing, data processing, and data storage facilities in several countries, which are owned by various parties (each with their own funding sources), and which are collectively operated by the ILT foundation under a joint scientific policy. The ILT resources have benefited from the following recent major funding sources: CNRS-INSU, Observatoire de Paris and Université d’Orléans, France; BMBF, MIWF-NRW, MPG, Germany; Science Foundation Ireland (SFI), Department of Business, Enterprise and Innovation (DBEI), Ireland; NWO, The Netherlands; The Science and Technology Facilities Council, UK; Ministry of Science and Higher Education, Poland; The Istituto Nazionale di Astrofisica (INAF), Italy. The Pan-STARRS1 Surveys (PS1) and the PS1 public science archive have been made possible through contributions by the Institute for Astronomy, the University of Hawaii, the Pan-STARRS Project Office, the Max-Planck Society and its participating institutes, the Max Planck Institute for Astronomy, Heidelberg and the Max Planck Institute for Extraterrestrial Physics, Garching, The Johns Hopkins University, Durham University, the University of Edinburgh, the Queen’s University Belfast, the Harvard-Smithsonian Center for Astrophysics, the Las Cumbres Observatory Global Telescope Network Incorporated, the National Central University of Taiwan, the Space Telescope Science Institute, the National Aeronautics and Space Administration under Grant No. NNX08AR22G issued through the Planetary Science Division of the NASA Science Mission Directorate, the National Science Foundation Grant No. AST-1238877, the University of Maryland, Eotvos Lorand University (ELTE), the Los Alamos National Laboratory, and the Gordon and Betty Moore Foundation. This research has made use of the VLASS QLimage cutout server at cutouts.cirada.ca, operated by the Canadian Initiative for Radio Astronomy Data Analysis (CIRADA). CIRADA is funded by a grant from the Canada Foundation for Innovation 2017 Innovation Fund (Project 35999), as well as by the Provinces of Ontario, British Columbia, Alberta, Manitoba and Quebec, in collaboration with the National Research Council of Canada, the US National Radio Astronomy Observatory and Australia’s Commonwealth Scientific and Industrial Research Organisation. This research is based in part on data collected at Subaru Telescope, which is operated by the National Astronomical Observatory of Japan. We are honored and grateful for the opportunity of observing the Universe from Maunakea, which has the cultural, historical and natural significance in Hawaii. Part of the data are retrieved from the JVO portal (http://jvo.nao.ac.jp/portal) operated by the NAOJ. Software: Astropy (Astropy Collaboration 2013, 2018, 2022), Astroquery (Ginsburg et al. 2019), (Robitaille & Bressert 2012), Aladin (Boch et al. 2011), Topcat (Taylor 2011), askap_surveys (David Kaplan and Andrew O’Brien (UW-Milwaukee)), matchmaker (Vohl 2023). The custom code used to generate these results is publicly available at https://doi.org/10.5281/zenodo.10018524.
References
- Abdurro’uf, N., Accetta, K., Aerts, C., et al. 2022, ApJS, 259, 35 [NASA ADS] [CrossRef] [Google Scholar]
- Aihara, H., AlSayyad, Y., Ando, M., et al. 2019, PASJ, 71, 114 [Google Scholar]
- Alam, S., Albareti, F. D., Allende Prieto, C., et al. 2015, ApJS, 219, 12 [Google Scholar]
- Alvarez, H., Aparici, J., May, J., & Reich, P. 2001, A&A, 372, 636 [NASA ADS] [CrossRef] [EDP Sciences] [Google Scholar]
- Astropy Collaboration (Robitaille, T. P., et al.) 2013, A&A, 558, A33 [NASA ADS] [CrossRef] [EDP Sciences] [Google Scholar]
- Astropy Collaboration (Price-Whelan, A. M., et al.) 2018, AJ, 156, 123 [Google Scholar]
- Astropy Collaboration (Price-Whelan, A. M., et al.) 2022, ApJ, 935, 167 [NASA ADS] [CrossRef] [Google Scholar]
- Baldwin, J. A., Phillips, M. M., & Terlevich, R. 1981, PASP, 93, 5 [Google Scholar]
- Bassa, C. G., Tendulkar, S. P., Adams, E. A. K., et al. 2017, ApJ, 843, L8 [NASA ADS] [CrossRef] [Google Scholar]
- Bates, S. D., Lorimer, D. R., & Verbiest, J. P. W. 2013, MNRAS, 431, 1352 [Google Scholar]
- Becker, R. H., White, R. L., & Helfand, D. J. 1995, ApJ, 450, 559 [Google Scholar]
- Bianchi, L., Conti, A., & Shiao, B. 2014, Adv. Space Res., 53, 900 [Google Scholar]
- Boch, T., Oberto, A., Fernique, P., & Bonnarel, F. 2011, ASP Conf. Ser., 442, 683 [NASA ADS] [Google Scholar]
- Bonnarel, F., Fernique, P., Bienaymé, O., et al. 2000, A&AS, 143, 33 [NASA ADS] [CrossRef] [EDP Sciences] [Google Scholar]
- Brinchmann, J., Charlot, S., White, S. D. M., et al. 2004, MNRAS, 351, 1151 [Google Scholar]
- Chambers, K. C., Magnier, E. A., Metcalfe, N., et al. 2016, ArXiv e-prints [arXiv:1612.05560] [Google Scholar]
- Chatterjee, S., Law, C. J., Wharton, R. S., et al. 2017, Nature, 541, 58 [NASA ADS] [CrossRef] [Google Scholar]
- Chen, G., Ravi, V., & Hallinan, G. W. 2022, ApJ, submitted [arXiv:2201.00999] [Google Scholar]
- Chime/Frb Collaboration (Amiri, M., et al.) 2020, Nature, 582, 351 [NASA ADS] [CrossRef] [Google Scholar]
- Condon, J. J., Huang, Z. P., Yin, Q. F., & Thuan, T. X. 1991, ApJ, 378, 65 [Google Scholar]
- Condon, J. J., Cotton, W. D., Greisen, E. W., et al. 1998, AJ, 115, 1693 [Google Scholar]
- Condon, J. J., Matthews, A. M., & Broderick, J. J. 2019, ApJ, 872, 148 [NASA ADS] [CrossRef] [Google Scholar]
- Cook, D. O., Kasliwal, M. M., Van Sistine, A., et al. 2019, ApJ, 880, 7 [Google Scholar]
- Cruces, M., Spitler, L. G., Scholz, P., et al. 2021, MNRAS, 500, 448 [Google Scholar]
- Curti, M., Mannucci, F., Cresci, G., & Maiolino, R. 2020, MNRAS, 491, 944 [Google Scholar]
- Davis, F., Kaviraj, S., Hardcastle, M. J., et al. 2022, MNRAS, 511, 4109 [NASA ADS] [CrossRef] [Google Scholar]
- Deller, A. T., & Middelberg, E. 2014, AJ, 147, 14 [Google Scholar]
- Dong, D. Z., & Hallinan, G. 2023, ApJ, 948, 119 [NASA ADS] [CrossRef] [Google Scholar]
- Eckart, A., Witzel, A., Biermann, P., et al. 1986, A&A, 168, 17 [NASA ADS] [Google Scholar]
- Eftekhari, T., Berger, E., Margalit, B., Metzger, B. D., & Williams, P. K. G. 2020, ApJ, 895, 98 [NASA ADS] [CrossRef] [Google Scholar]
- Flewelling, H. A., Magnier, E. A., Chambers, K. C., et al. 2020, ApJS, 251, 7 [NASA ADS] [CrossRef] [Google Scholar]
- Gaensler, B. M., & Slane, P. O. 2006, ARA&A, 44, 17 [Google Scholar]
- Geréb, K., Morganti, R., Oosterloo, T. A., Hoppmann, L., & Staveley-Smith, L. 2015, A&A, 580, A43 [NASA ADS] [CrossRef] [EDP Sciences] [Google Scholar]
- Ginsburg, A., Sipőcz, B. M., Brasseur, C. E., et al. 2019, AJ, 157, 98 [Google Scholar]
- González Delgado, R. M., García-Benito, R., Pérez, E., et al. 2015, A&A, 581, A103 [Google Scholar]
- Greene, J. E., Strader, J., & Ho, L. C. 2020, ARA&A, 58, 257 [Google Scholar]
- Gültekin, K., King, A. L., Cackett, E. M., et al. 2019, ApJ, 871, 80 [Google Scholar]
- Guo, Y., Liu, C., Wang, L., et al. 2022, VizieR Online Data Catalog: J/A+A/667/A44 [Google Scholar]
- Gürkan, G., Hardcastle, M. J., Smith, D. J. B., et al. 2018, MNRAS, 475, 3010 [Google Scholar]
- Hessels, J. W. T., Spitler, L. G., Seymour, A. D., et al. 2019, ApJ, 876, L23 [Google Scholar]
- Ivezić, Ž., Menou, K., Knapp, G. R., et al. 2002, AJ, 124, 2364 [CrossRef] [Google Scholar]
- Jarrett, T. H., Cohen, M., Masci, F., et al. 2011, ApJ, 735, 112 [Google Scholar]
- Kauffmann, G., Heckman, T. M., Tremonti, C., et al. 2003, MNRAS, 346, 1055 [Google Scholar]
- Kewley, L. J., Dopita, M. A., Sutherland, R. S., Heisler, C. A., & Trevena, J. 2001, ApJ, 556, 121 [Google Scholar]
- Koss, M., Trakhtenbrot, B., Ricci, C., et al. 2017, ApJ, 850, 74 [Google Scholar]
- Kothes, R., Fedotov, K., Foster, T. J., & Uyanıker, B. 2006, A&A, 457, 1081 [CrossRef] [EDP Sciences] [Google Scholar]
- Kron, R. G. 1980, ApJS, 43, 305 [Google Scholar]
- Lacy, M., Baum, S. A., Chandler, C. J., et al. 2020, PASP, 132, 035001 [Google Scholar]
- Law, C. J., Connor, L., & Aggarwal, K. 2022, ApJ, 927, 55 [NASA ADS] [CrossRef] [Google Scholar]
- Marcote, B., Paragi, Z., Hessels, J. W. T., et al. 2017, ApJ, 834, L8 [CrossRef] [Google Scholar]
- Margalit, B., & Metzger, B. D. 2018, ApJ, 868, L4 [NASA ADS] [CrossRef] [Google Scholar]
- Martin, D. C., Fanson, J., Schiminovich, D., et al. 2005, ApJ, 619, L1 [Google Scholar]
- McConnell, N. J., & Ma, C.-P. 2013, ApJ, 764, 184 [Google Scholar]
- McConnell, D., Hale, C. L., Lenc, E., et al. 2020, PASA, 37, e048 [Google Scholar]
- Michilli, D., Seymour, A., Hessels, J. W. T., et al. 2018, Nature, 553, 182 [Google Scholar]
- Mohan, N., & Rafferty, D. 2015, Astrophysics Source Code Library [record ascl:1502.007] [Google Scholar]
- Molina, M., Reines, A. E., Greene, J. E., Darling, J., & Condon, J. J. 2021, ApJ, 910, 5 [NASA ADS] [CrossRef] [Google Scholar]
- Mondal, S., Bera, A., Chandra, P., & Das, B. 2020, MNRAS, 498, 3863 [NASA ADS] [CrossRef] [Google Scholar]
- Morabito, L. K., Jackson, N. J., Mooney, S., et al. 2022, A&A, 658, A1 [NASA ADS] [CrossRef] [EDP Sciences] [Google Scholar]
- Murase, K., Kashiyama, K., & Mészáros, P. 2016, MNRAS, 461, 1498 [NASA ADS] [CrossRef] [Google Scholar]
- Niu, C. H., Aggarwal, K., Li, D., et al. 2022, Nature, 606, 873 [NASA ADS] [CrossRef] [Google Scholar]
- Nyland, K., Dong, D., Hallinan, G., et al. 2020, Am. Astron. Soc. Meet. Abstr., 235, 129.01 [NASA ADS] [Google Scholar]
- Ofek, E. O. 2017, ApJ, 846, 44 [NASA ADS] [CrossRef] [Google Scholar]
- Oke, J. B., & Gunn, J. E. 1983, ApJ, 266, 713 [NASA ADS] [CrossRef] [Google Scholar]
- Paragi, Z., Frey, S., Kaaret, P., et al. 2014, ApJ, 791, 2 [NASA ADS] [CrossRef] [Google Scholar]
- Planck Collaboration XV. 2011, A&A, 536, A15 [NASA ADS] [CrossRef] [EDP Sciences] [Google Scholar]
- Platts, E., Caleb, M., Stappers, B. W., et al. 2021, MNRAS, 505, 3041 [NASA ADS] [CrossRef] [Google Scholar]
- Rajwade, K. M., Mickaliger, M. B., Stappers, B. W., et al. 2020, MNRAS, 495, 3551 [NASA ADS] [CrossRef] [Google Scholar]
- Reines, A. E., & Volonteri, M. 2015, ApJ, 813, 82 [NASA ADS] [CrossRef] [Google Scholar]
- Reines, A. E., Greene, J. E., & Geha, M. 2013, ApJ, 775, 116 [Google Scholar]
- Reines, A. E., Condon, J. J., Darling, J., & Greene, J. E. 2020, ApJ, 888, 36 [NASA ADS] [CrossRef] [Google Scholar]
- Resmi, L., Vink, J., & Ishwara-Chandra, C. H. 2021, A&A, 655, A102 [NASA ADS] [CrossRef] [EDP Sciences] [Google Scholar]
- Robitaille, T., & Bressert, E. 2012, Astrophysics Source Code Library [record ascl:1208.017] [Google Scholar]
- Sargent, A. J., Johnson, M. C., Reines, A. E., et al. 2022, ApJ, 933, 160 [NASA ADS] [CrossRef] [Google Scholar]
- Schechter, P. 1976, ApJ, 203, 297 [Google Scholar]
- Shimwell, T. W., Hardcastle, M. J., Tasse, C., et al. 2022, A&A, 659, A1 [NASA ADS] [CrossRef] [EDP Sciences] [Google Scholar]
- Smith, D. J. B., Haskell, P., Gürkan, G., et al. 2021, A&A, 648, A6 [EDP Sciences] [Google Scholar]
- Spitler, L. G., Scholz, P., Hessels, J. W. T., et al. 2016, Nature, 531, 202 [NASA ADS] [CrossRef] [Google Scholar]
- Sridhar, N., & Metzger, B. D. 2022, ApJ, 937, 5 [NASA ADS] [CrossRef] [Google Scholar]
- Tasse, C., Hugo, B., Mirmont, M., et al. 2018, A&A, 611, A87 [NASA ADS] [CrossRef] [EDP Sciences] [Google Scholar]
- Taylor, M. 2011, Astrophysics Source Code Library [record ascl:1101.010] [Google Scholar]
- Tendulkar, S. P., Bassa, C. G., Cordes, J. M., et al. 2017, ApJ, 834, L7 [NASA ADS] [CrossRef] [Google Scholar]
- Tendulkar, S. P., Gil de Paz, A., Kirichenko, A. Y., et al. 2021, ApJ, 908, L12 [CrossRef] [Google Scholar]
- Tremonti, C. A., Heckman, T. M., Kauffmann, G., et al. 2004, ApJ, 613, 898 [Google Scholar]
- Truebenbach, A. E., & Darling, J. 2017, MNRAS, 468, 196 [NASA ADS] [CrossRef] [Google Scholar]
- Venkattu, D., Lundqvist, P., Pérez-Torres, M., et al. 2023, ApJ, 953, 157 [NASA ADS] [CrossRef] [Google Scholar]
- Véron-Cetty, M. P., & Véron, P. 2010, A&A, 518, A10 [Google Scholar]
- Vohl, D. 2023, https://doi.org/10.5281/zenodo.7986693 [Google Scholar]
- Vohl, D., Vedantham, H. K., Hessels, J. W. T., & Bassa, C. G. 2023, ArXiv e-prints [arXiv:2303.11967] [Google Scholar]
- Wright, E. L., Eisenhardt, P. R. M., Mainzer, A. K., et al. 2010, AJ, 140, 1868 [Google Scholar]
- Yang, J., Gurvits, L. I., Paragi, Z., et al. 2020, MNRAS, 495, L71 [NASA ADS] [CrossRef] [Google Scholar]
- Zajaček, M., Busch, G., Valencia, S. M., et al. 2019, A&A, 630, A83 [NASA ADS] [CrossRef] [EDP Sciences] [Google Scholar]
- Zhao, Z. Y., & Wang, F. Y. 2021, ApJ, 923, L17 [NASA ADS] [CrossRef] [Google Scholar]
Appendix A: The obtained L–SFR distribution
The zero point on the L–SFR relation from Gürkan et al. (2018) was obtained on more massive (∼108.5–1011 M⊙) galaxies than our dwarf sample. In figure A.1, we show that the zero point corresponds to the peak of the distribution when matching compact radio sources to all galaxy masses available within CLU using a 6″ matching radius. The peak of the distribution of matched dwarf galaxies falls just below the zero point. Objects below −10σ (14 dwarf galaxies) have redshifts below 0.002, except two extra cases at higher masses that have redshifts of 0.003 and 0.027, respectively.
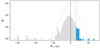 |
Fig. A.1. Matched compact radio objects along the L–SFR plane. Gray-filled bins indicate cases matched to dwarf galaxies. Gray border bins indicate cases matched to galaxies at all masses available in CLU. Blue bins indicate OCRs. Very low-luminosity cases encountered in Figure 2 are further investigated in Figure A.2. |
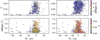 |
Fig. A.2. Compact radio objects matched to dwarf galaxies (left) and all galaxies (right) along the L–SFR plane as a function of redshift and offset. Very low-luminosity cases encountered in Figure 2 all have redshifts below 0.002. |
Appendix B: 2MASX J12594007+2751177 and SDSS J143037.09+352052.8
The dwarf galaxy 2MASX J12594007+2751177 was shown to be of very low surface density in PS1 (Figure 7). To better highlight the environment in which this galaxy resides, Figure B.1 shows the same field as observed by PS1 in r filter (right) as shown previously, and a JVO Subaru/Suprime-Cam (Aihara et al. 2019) composite image (left) using all filters—where 2MASX J12594007+2751177 is apparent. Green markers (x, +) show the location of the LoTSS and CLU detections, respectively. The Subaru Suprime-Cam image strengthens the hypothesis that 2MASX J12594007+2751177 and ILTJ125944.53+275800.9 are unrelated.
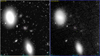 |
Fig. B.1. Environment around 2MASX J12594007+2751177 as observed by PS1 in r filter (right, Figure 7), and JVO Subaru/Suprime-Cam composite image (left) using all filters—where 2MASX J12594007+2751177 (pink markers) is apparent. Green markers (×, +) show the location of the LoTSS and CLU detections, respectively. Figure generated with Aladin Desktop (Bonnarel et al. 2000). |
Finally, the AGN candidate ILT 143037.30+352053.3 was matched to the host galaxy SDSS J143037.09+352052.8. SDSS J143037.09+352052.8 is not resolved in PS1 r filter shown in Figure 7. We found a JVO Subaru/Suprime-Cam image for this field, which indicates that the radio source is within the optical footprint of the host, which we show in Figure B.2.
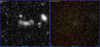 |
Fig. B.2. Environment around SDSS J143037.09+352052.8 as observed by PS1 in r filter (right, Figure 7), and JVO Subaru/Suprime-Cam composite image (left) using all filters—where SDSS J143037.09+352052.8 (pink markers) is apparent. Green markers (×, +) show the location of the LoTSS and CLU detections, respectively. |
Appendix C: ACO 1656
We note in §3 that four of our selected compact radio sources fall within galaxies that are members of the cluster of galaxies ACO 1656. These are galaxies and respective matched radio sources (Table 1) are 2MASS J13002220+2814499 (ILTJ130022.42+281451.7), SDSS J125944.76+275807.1 (ILTJ125944.53+275800.9), 2MASX J12594007+2751177 (ILTJ125940.18 +275123.5), and SSTSL2 J125915.27+274604.1 (ILTJ125915.34+274604.2). We show the position of these galaxies along with the central coordinate of ACO 1656 in Figure C.1, which displays a PS1 composite image of the z and g filters, as plotted in Aladin Desktop (Bonnarel et al. 2000).
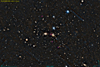 |
Fig. C.1. Cluster of galaxies ACO 1656 (pink markers), and four dwarf galaxies matched to compact radio sources (pink squares). |
Appendix D: Host properties
In Table 1, a number of physical properties are listed, including luminosity of the compact radio source, as well as redshift and star formation rate of the host galaxy. Here, we also present the distribution relative to stellar mass and specific star formation rate (sSFR, the star formation rate normalized by the stellar mass) in Figure D.2. Similarly, Figure D.2 shows SFR and sSFR in relation to stellar mass. Here, we note that none of our candidates reach the same level of SFR as the host galaxies from FRB 20121102A (Tendulkar et al. 2017) and FRB 20190520B (Niu et al. 2022), with FRB 20190520B being within range. The host galaxy of FRB 20121102A stands out with respect of its sSFR compared to the rest of the data points. The host galaxies of the IMBH candidates studied by Reines et al. fall within the SFR and sSFR ranges of our candidates. We note that two out of the three galaxies matched to CLU in our study correspond to unresolved radio sources (J0909+5655, J1136+2643) in Sargent et al. (2022). We performed two-sample KS tests between the respective candidates distributions to that of the background sample (“compact radio sources-dwarf galaxy” matches below 3σ on the L–SFR relation) for stellar mass, SFR, and sSFR that yield p-values of 0.2, 0.8, and 0.4 respectively, and are therefore consistent with being drawn from the same population.
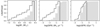 |
Fig. D.1. Distribution of host stellar mass (left panel), SFR (middle panel), and sSFR (right panel) for candidates listed in Table 1. Gray bars indicate values for all “compact radio source-dwarf galaxy” matches below 3σ on the L–SFR relation. |
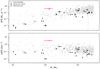 |
Fig. D.2. Host stellar mass as a function of SFR and sSFR for our candidates. We also indicate values for FRB 20121102A, FRB 20190520B, and Reines et al. (2020) sources from Figure 2. Gray markers indicate all “compact radio source-dwarf galaxy” matches below 3σ on the L–SFR relation. |
Appendix E: Radio luminosity versus OI/Hα
Reines et al. (2020) showed that the relation between the emission line ratio [OI]λ3600/Hα and the luminosity at 9 GHz could be used to separate radio emission from radio AGN and star formation. We used the spectral indices fitted in §3.2 (and the canonical α = −0.7 otherwise) to scale the luminosity of our sources to 9 GHz for sources with spectral line measurements available in SDSS. We show the results in Figure E.1. Most of our sources fill the gap region found in Figure 10 of Reines et al. (2020) that divides radio emission consistent with star formation and radio AGN. We note that, despite the fact that scaling flux from 144 MHz to 9 GHz remains an approximation, typically 10% of the flux being resolved out at higher frequencies would only marginally affect the luminosity of sources plotted here.
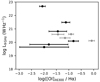 |
Fig. E.1. Black markers indicate values where the luminosity was scaled to 9 GHz with spectral indices obtained in §3.2, while gray markers were scaled using the canonical α = −0.7 for synchrotron spectra of optically thin radio sources. |
As mentioned in Appendix D, galaxies J0909+5655 and J1136+2643 were matched to CLU, with both radio source being unresolved by the VLBA (Sargent et al. 2022). The remaining match (J1220+3020, L144 MHz ∼ 5 × 10²¹ W Hz−1) is one of Reines’ sources with optical spectroscopic signature (obtained with targeted observation at the location of the radio source with GMOS-N/IFU) consistent with accreting IMBH, via the AGN coronal line [Fe X] and enhanced [O I] emission coincident with the radio source (Molina et al. 2021; Sargent et al. 2022). We do not detect these sources in LoTSS, despite two of them being within the DR2 footprint.
The two VLBA detections at 144 MHz-scaled luminosity from Reines et al. (2020) using spectral indices by Eftekhari et al. (2020) yield ∼1.39 × 10²² and ∼2.47 × 10²² W Hz−1. It is therefore plausible that a fraction of the radio luminosity reported for our candidates could be attributed to an unresolved compact component. However, our scaling from 9 GHz to 144 MHz should be seen as an informed approximation, and radio luminosity values presented in Figure E.1 should be regarded as order-of-magnitude estimates.
Appendix F: Spatial coverage of ancillary surveys
In this section, we evaluate the spatial coverage of radio surveys used in §3.2. Figure F.1 shows multiorder coverage (MOC) maps for each of these surveys, seen as subdivided cells. Each survey is color coded and described in the figure caption. In addition, we overplot our candidates using yellow ‘+’ markers. We note that seven sources have not been observed by FIRST and nine have been observed by RACS (Figure 9). All other sources could have been observed by the remaining surveys. Finally, we also show coverage for SDSS DR12 (§3.1), as well as Chandra SC2, XMM-Newton EPIC, and Fermi 4FGL (§3.3).
 |
Fig. F.1. Coverage maps of surveys searched in §3. Source candidates discussed in this paper are shown as white circles. |
All Tables
All Figures
|
Fig. 1. WISE color–color plot. Photometric ratios in magnitude (mag) between three IR bands (W13.4 μm, W24.6 μm, W312 μm, with W1–W2, W2–W3). Black markers correspond to dwarf galaxies matched to a compact radio source with luminosity exceeding 3σ in the L–SFR relation. Gray-filled markers indicate dwarf galaxies matched to a radio source. We demarcate the two sources falling within the AGN region (Jarrett et al. 2011) marked by dashed lines within our sample as being classified. |
| In the text | |
|
Fig. 2. Candidate selection via the L–SFR relation. Gray-filled markers indicate compact radio sources matched to dwarf galaxies matched. Black filled circles correspond to our final selection of OCRs matched to a dwarf galaxy with luminosity exceeding 3σ (dashed line) on the L–SFR relation by Gürkan et al. (2018, and the solid line) shows those with validated redshift. The uncertainty on luminosity is below the marker size. Orange markers are sources within the AGN region in Fig. 1. As a reference, we show PRS luminosity and the SFR of the host for both FRB 20121102A (Tendulkar et al. 2021; Law et al. 2022) and FRB 20190520B (Niu et al. 2022), with luminosity measurements scaled to 144 MHz using α from Resmi et al. (2021, evaluated between 2 MHz and 10 GHz,) and from Niu et al. (2022, evaluated between 1.5 and 5.5 GHz), respectively. We also show the transient source VT 1137+0337 using values from Dong & Hallinan (2023). Finally, we show Reines et al. (2020) galaxies (J0909+5655, J1136+2643, J1220+3020) matched in CLU for which SFR information is available, with luminosity scaled to 144 MHz using α values fitted between 1.4 GHz and 9 GHz by Eftekhari et al. (2020). The large scatter in luminosity is discussed in Sect. 2.3 and Appendix A. |
| In the text | |
|
Fig. 3. Observed offset distribution after cross-matching CLU and LoTSS surveys, using a match radius of 40″. We select our target galaxies to have offsets of 2″ (pink vertical dashed line) and 6″ (blue vertical dashed line). The blue solid line shows the expected number of chance alignments with background sources as a function of offset. |
| In the text | |
|
Fig. 4. Cumulative distributions from 1000 Monte Carlo realizations of matches exceeding 3σ on the L–SFR relation from Gürkan et al. (2018). Top panel: 6″ matching radius; bottom panel: 2″ matching radius. |
| In the text | |
|
Fig. 5. Redshift distributions of selected candidates listed in Table 1 (gray) and for all dwarf galaxies from CLU in the LoTSS field (black). A two-sample KS test between these two distributions gives a p-value of ≪0.005. |
| In the text | |
|
Fig. 6. Over-luminous compact radio sources with a projected offset of less than (2 + ϵ)″. Each panel indicates the source name from LoTSS and the host galaxy name above a PS1 R filter image in logarithmic gray scale. Contours indicate optical data from PS1 (Chambers et al. 2016; Flewelling et al. 2020) at μ + [1, 2, …, 10]σ levels, with μ and σ being the median and standard deviation, respectively. The black crosses and plus symbols (×, +) indicate the central coordinates of matched objects from LoTSS and CLU, respectively. LoTSS astrometric uncertainty is marked as a yellow box. Where available in the CLU catalog, we indicate a yellow ellipse corresponding to the Hα detection isophote (D25). For each panel, in the top left, we indicate the spatial offset (″) between the × and + markers as a white bar, along with corresponding transverse distance (pc). Top right: LoTSS radio flux at 144 MHz in mJy, with uncertainty on the last digit in parenthesis, host galaxy stellar mass ( |
| In the text | |
|
Fig. 7. Over-luminous compact radio sources with projected offset greater than (2 + ϵ)″. OCRs within the AGN region in Fig. 1 are shown below demarcation lines. See Fig. 6 for component descriptions. |
| In the text | |
|
Fig. 8. BPT diagrams for sources with SDSS spectra showing the main source of ionization. Green and black markers correspond to sources with projected separation of less than or greater than (2 + ϵ)″, respectively. Gray circles are all “compact radio source-dwarf galaxy” matches with spectral line information in SDSS. Markers with a colored inner circle (colors other than black) occupy interesting parts of parameter space and are discussed in Sect. 4. The galaxy marked with a white inner circle lies above the gray line in the S II/Hα panel, while being well within the star formation range in the [N II]/Hα panel. Blue and pink inner circles fall within the composite region in the [N II]/Hα panel, where we can expect a contribution from both star formation (H II regions) and AGN activity. Finally, the galaxy marked by a cyan inner circle was classified as an AGN candidate by Truebenbach & Darling (2017) by selecting sources detected in the AllWISE and FIRST catalogs but not detected in 2MASS or SDSS DR7 and DR9. |
| In the text | |
|
Fig. 9. Radio spectra of candidates matched in one or more of the RACS, FIRST, NVSS, and VLASS surveys, with central frequencies of 1.25 GHz, 1.4 GHz, 1.4 GHz, and 3 GHz, respectively. LoTSS observes at a central frequency of 144 MHz. The source name in LoTSS is indicated for each candidate. Black markers show flux measurements with uncertainties (small enough not to be visible), and the dashed blue lines show the best power-law fit over all frequencies, with power-law index α also indicated. Where applicable, a gray dashed line shows the best power-law fit at higher frequencies (∼1 − 3 GHz). |
| In the text | |
|
Fig. 10. Comparing peak flux (Sp) and integrated flux (Si, Tables 1 and 3) measurements in the various surveys. Gray lines in the upper panel indicate a 1:1 ratio. In the lower panel, the solid and dashed blue lines indicate the median and mean of each ratio distribution, respectively. NVSS does not provide peak flux information. |
| In the text | |
|
Fig. 11. Comparing radio loudness Rg, emission line ratio [O III]/Hβ, and spectral index, where available. From the sample of 26 Rg values (Table 1), 7 also have [O III]/Hβ values available (Table 2, alias T2; black bars in central panel), and 9 have fitted α values (Table 3, alias T3). HF indicates spectral indices fitted between 1.4 and 3 GHz. Class 1, 2, and 3 (c1, c2, c3) as defined by Eckart et al. (1986). Unfilled histograms in middle and lower panels represent all available “compact radio source-dwarf galaxy” matches below 3σ on the L–SFR relation. |
| In the text | |
|
Fig. A.1. Matched compact radio objects along the L–SFR plane. Gray-filled bins indicate cases matched to dwarf galaxies. Gray border bins indicate cases matched to galaxies at all masses available in CLU. Blue bins indicate OCRs. Very low-luminosity cases encountered in Figure 2 are further investigated in Figure A.2. |
| In the text | |
|
Fig. A.2. Compact radio objects matched to dwarf galaxies (left) and all galaxies (right) along the L–SFR plane as a function of redshift and offset. Very low-luminosity cases encountered in Figure 2 all have redshifts below 0.002. |
| In the text | |
|
Fig. B.1. Environment around 2MASX J12594007+2751177 as observed by PS1 in r filter (right, Figure 7), and JVO Subaru/Suprime-Cam composite image (left) using all filters—where 2MASX J12594007+2751177 (pink markers) is apparent. Green markers (×, +) show the location of the LoTSS and CLU detections, respectively. Figure generated with Aladin Desktop (Bonnarel et al. 2000). |
| In the text | |
|
Fig. B.2. Environment around SDSS J143037.09+352052.8 as observed by PS1 in r filter (right, Figure 7), and JVO Subaru/Suprime-Cam composite image (left) using all filters—where SDSS J143037.09+352052.8 (pink markers) is apparent. Green markers (×, +) show the location of the LoTSS and CLU detections, respectively. |
| In the text | |
|
Fig. C.1. Cluster of galaxies ACO 1656 (pink markers), and four dwarf galaxies matched to compact radio sources (pink squares). |
| In the text | |
|
Fig. D.1. Distribution of host stellar mass (left panel), SFR (middle panel), and sSFR (right panel) for candidates listed in Table 1. Gray bars indicate values for all “compact radio source-dwarf galaxy” matches below 3σ on the L–SFR relation. |
| In the text | |
|
Fig. D.2. Host stellar mass as a function of SFR and sSFR for our candidates. We also indicate values for FRB 20121102A, FRB 20190520B, and Reines et al. (2020) sources from Figure 2. Gray markers indicate all “compact radio source-dwarf galaxy” matches below 3σ on the L–SFR relation. |
| In the text | |
|
Fig. E.1. Black markers indicate values where the luminosity was scaled to 9 GHz with spectral indices obtained in §3.2, while gray markers were scaled using the canonical α = −0.7 for synchrotron spectra of optically thin radio sources. |
| In the text | |
|
Fig. F.1. Coverage maps of surveys searched in §3. Source candidates discussed in this paper are shown as white circles. |
| In the text | |
Current usage metrics show cumulative count of Article Views (full-text article views including HTML views, PDF and ePub downloads, according to the available data) and Abstracts Views on Vision4Press platform.
Data correspond to usage on the plateform after 2015. The current usage metrics is available 48-96 hours after online publication and is updated daily on week days.
Initial download of the metrics may take a while.