Fig. 3.
Download original image
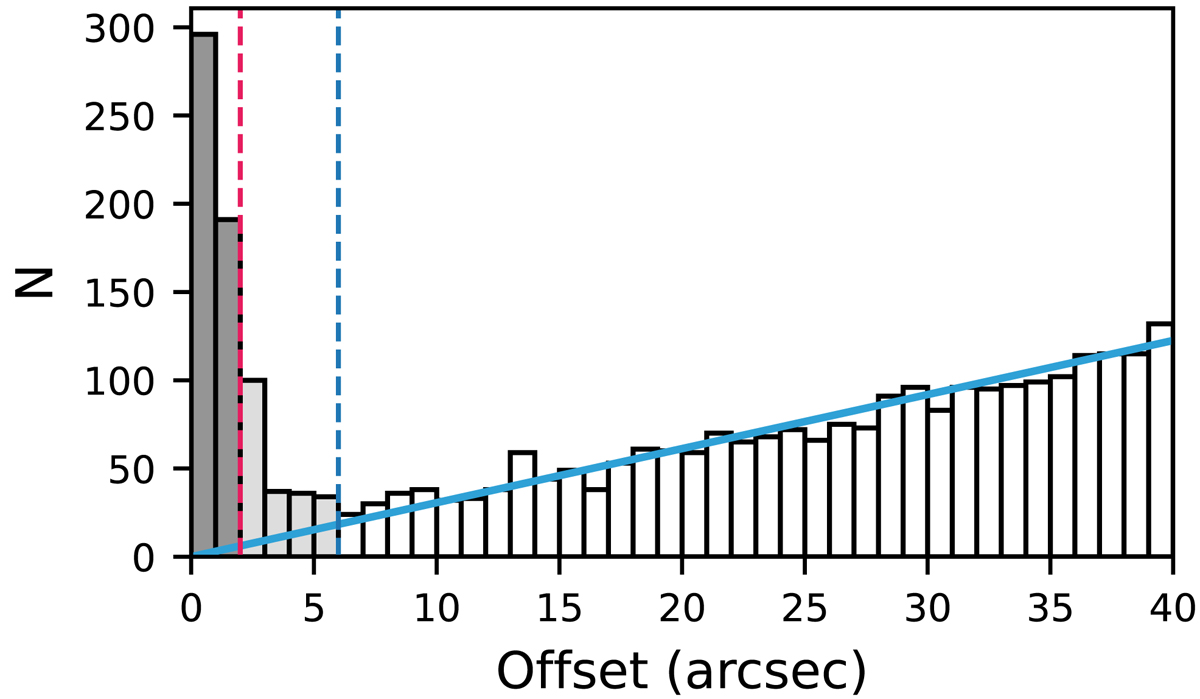
Observed offset distribution after cross-matching CLU and LoTSS surveys, using a match radius of 40″. We select our target galaxies to have offsets of 2″ (pink vertical dashed line) and 6″ (blue vertical dashed line). The blue solid line shows the expected number of chance alignments with background sources as a function of offset.
Current usage metrics show cumulative count of Article Views (full-text article views including HTML views, PDF and ePub downloads, according to the available data) and Abstracts Views on Vision4Press platform.
Data correspond to usage on the plateform after 2015. The current usage metrics is available 48-96 hours after online publication and is updated daily on week days.
Initial download of the metrics may take a while.