Fig. 11.
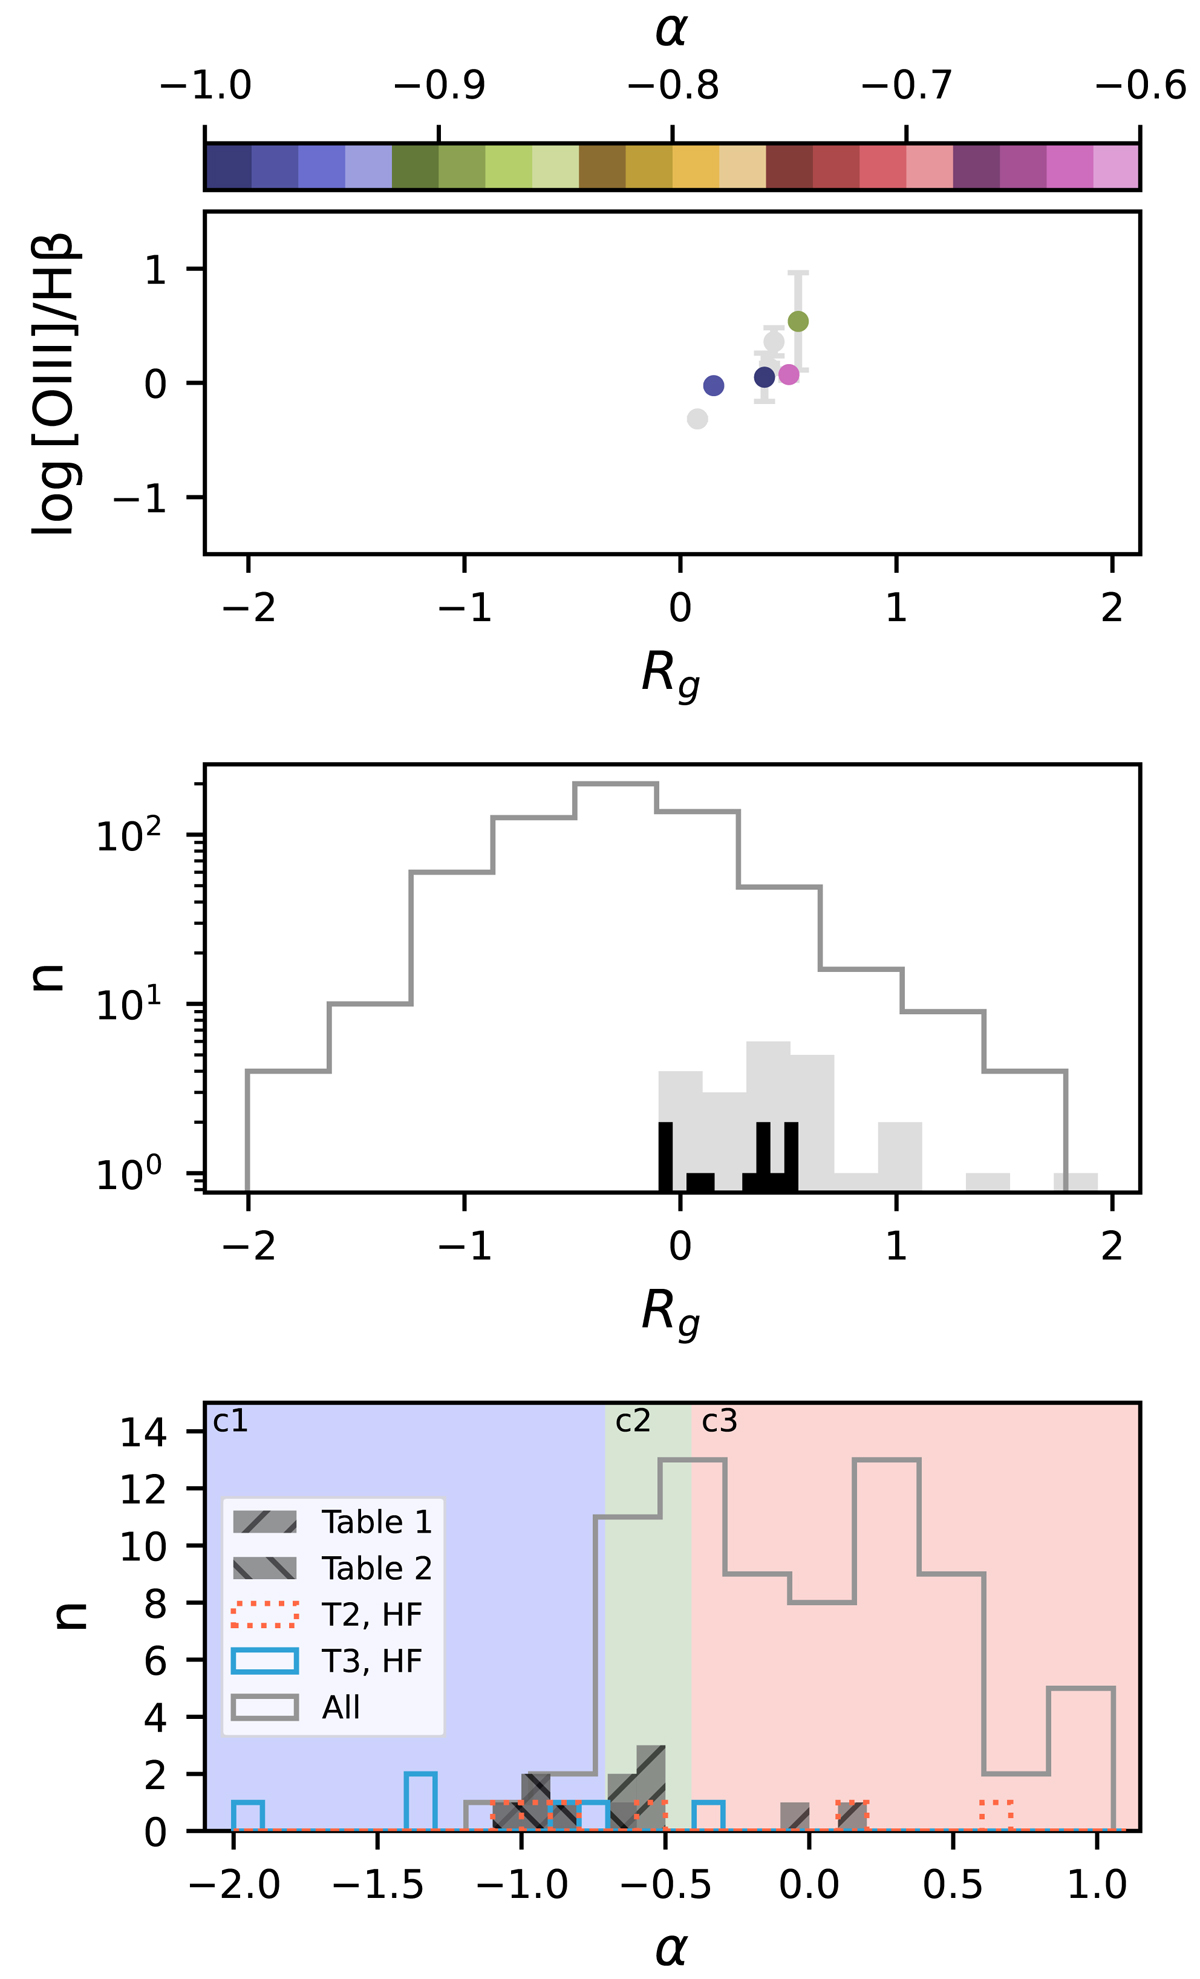
Download original image
Comparing radio loudness Rg, emission line ratio [O III]/Hβ, and spectral index, where available. From the sample of 26 Rg values (Table 1), 7 also have [O III]/Hβ values available (Table 2, alias T2; black bars in central panel), and 9 have fitted α values (Table 3, alias T3). HF indicates spectral indices fitted between 1.4 and 3 GHz. Class 1, 2, and 3 (c1, c2, c3) as defined by Eckart et al. (1986). Unfilled histograms in middle and lower panels represent all available “compact radio source-dwarf galaxy” matches below 3σ on the L–SFR relation.
Current usage metrics show cumulative count of Article Views (full-text article views including HTML views, PDF and ePub downloads, according to the available data) and Abstracts Views on Vision4Press platform.
Data correspond to usage on the plateform after 2015. The current usage metrics is available 48-96 hours after online publication and is updated daily on week days.
Initial download of the metrics may take a while.