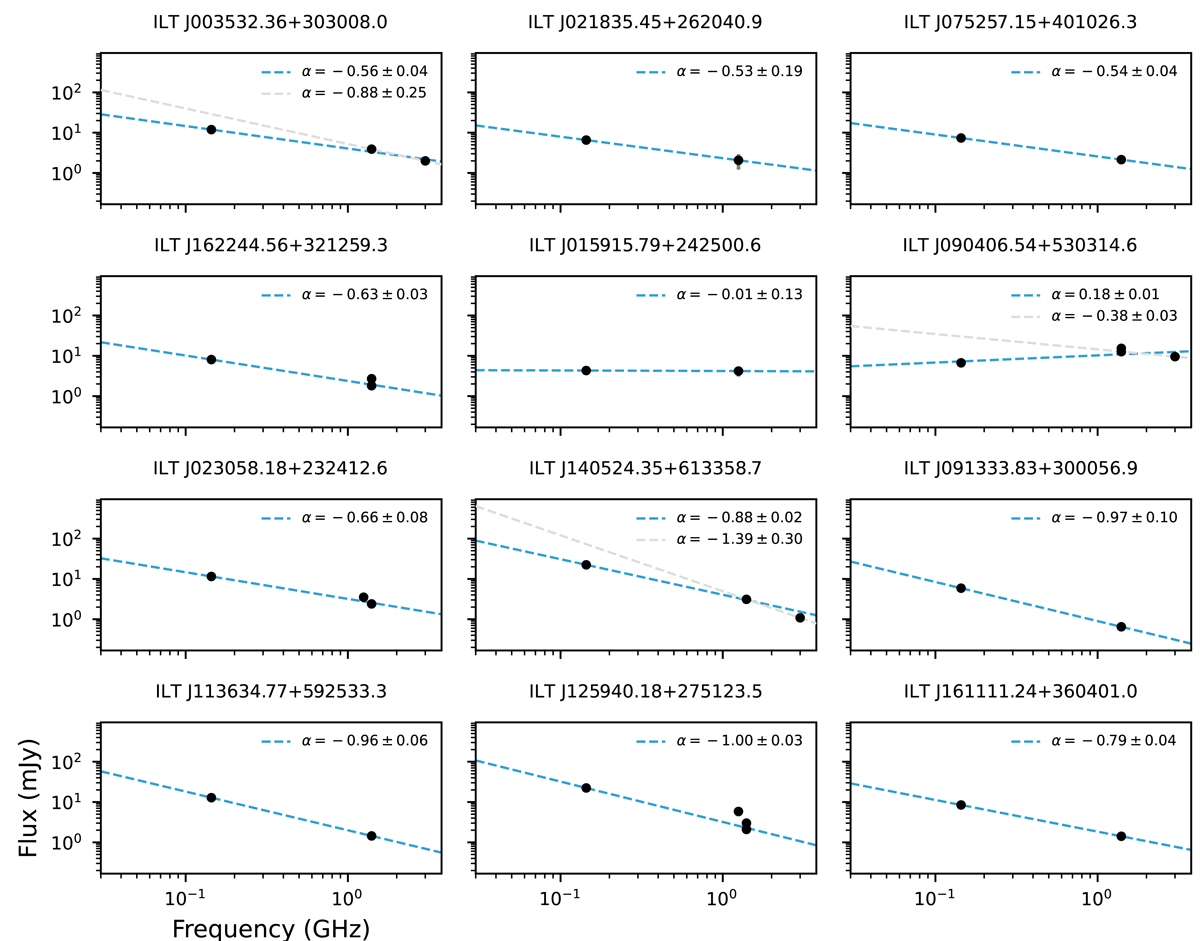
Fig. 9.
Download original image
Radio spectra of candidates matched in one or more of the RACS, FIRST, NVSS, and VLASS surveys, with central frequencies of 1.25 GHz, 1.4 GHz, 1.4 GHz, and 3 GHz, respectively. LoTSS observes at a central frequency of 144 MHz. The source name in LoTSS is indicated for each candidate. Black markers show flux measurements with uncertainties (small enough not to be visible), and the dashed blue lines show the best power-law fit over all frequencies, with power-law index α also indicated. Where applicable, a gray dashed line shows the best power-law fit at higher frequencies (∼1 − 3 GHz).
Current usage metrics show cumulative count of Article Views (full-text article views including HTML views, PDF and ePub downloads, according to the available data) and Abstracts Views on Vision4Press platform.
Data correspond to usage on the plateform after 2015. The current usage metrics is available 48-96 hours after online publication and is updated daily on week days.
Initial download of the metrics may take a while.