Fig. 6.
Download original image
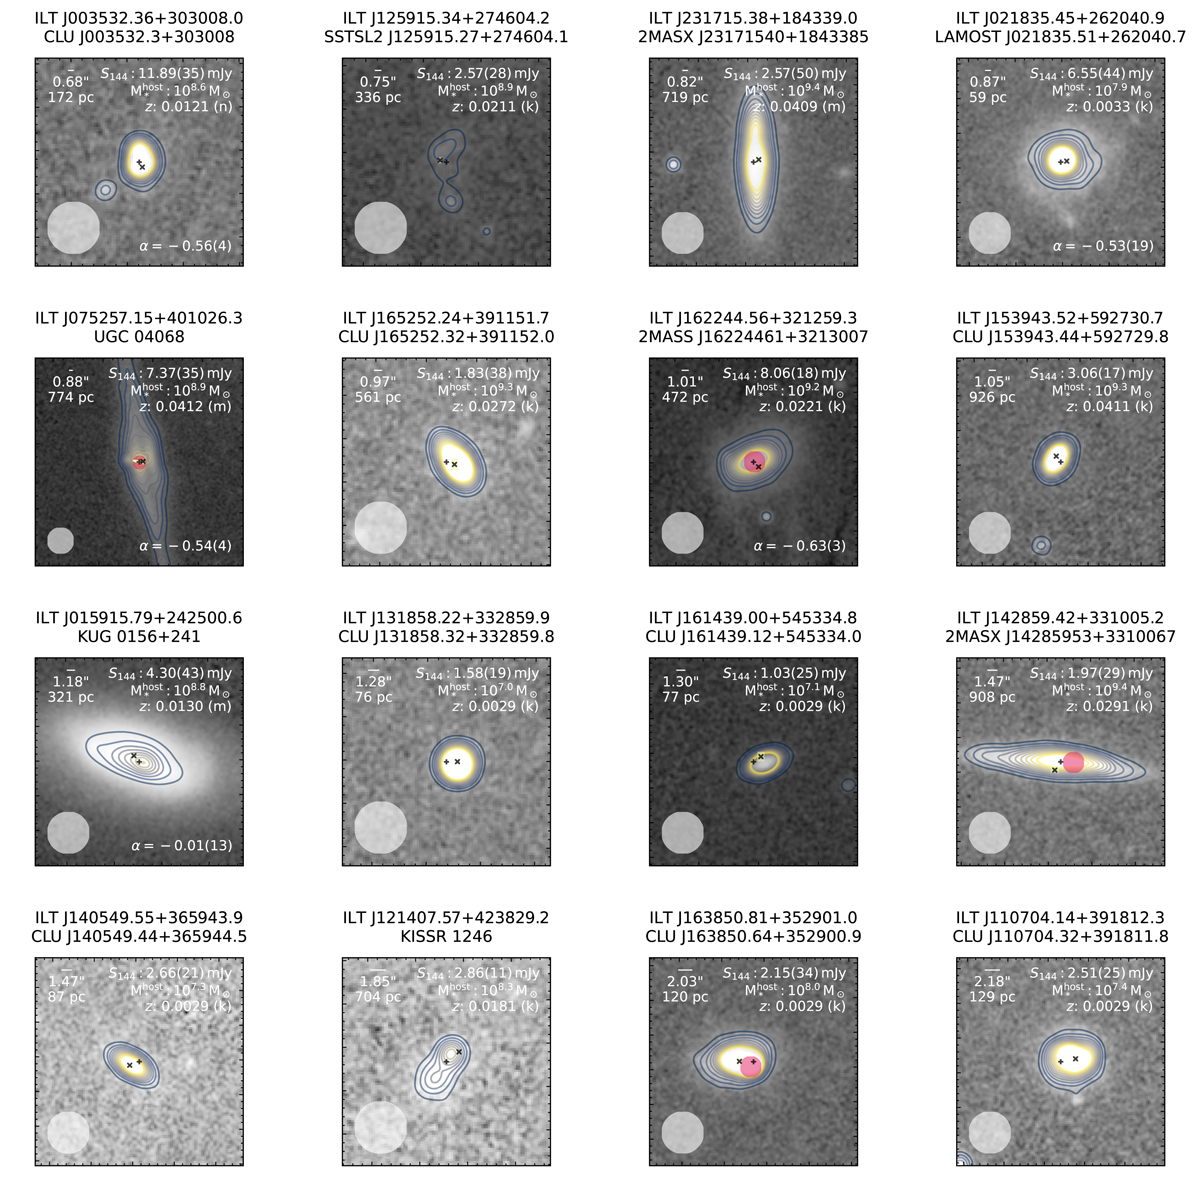
Over-luminous compact radio sources with a projected offset of less than (2 + ϵ)″. Each panel indicates the source name from LoTSS and the host galaxy name above a PS1 R filter image in logarithmic gray scale. Contours indicate optical data from PS1 (Chambers et al. 2016; Flewelling et al. 2020) at μ + [1, 2, …, 10]σ levels, with μ and σ being the median and standard deviation, respectively. The black crosses and plus symbols (×, +) indicate the central coordinates of matched objects from LoTSS and CLU, respectively. LoTSS astrometric uncertainty is marked as a yellow box. Where available in the CLU catalog, we indicate a yellow ellipse corresponding to the Hα detection isophote (D25). For each panel, in the top left, we indicate the spatial offset (″) between the × and + markers as a white bar, along with corresponding transverse distance (pc). Top right: LoTSS radio flux at 144 MHz in mJy, with uncertainty on the last digit in parenthesis, host galaxy stellar mass (![]() ) in M⊙, and redshift (z), with distance method indicated in parentheses. Here, (k) means kinematic, (m) median (redshift-independent), and (n) narrowband (Hα). Where available, we indicate the spectral index (α; Fig. 9; Sect. 3.2) and the location of the SDSS spectroscopic fiber as a filled pink circle (Fig. 8; Sect. 3.1, Fig. 9). Bottom left: White circles indicate the LoTSS 6″ beam, noting that the restoring beam used in DDFacet (Tasse et al. 2018) for each image product type is kept constant over the data release region and that all image products are made with a uv-minimum of 100 m with the uv-maximum varied to provide images at different resolutions; the highest resolution 6″ images use baselines up to 120 km (i.e., all LOFAR stations within the Netherlands).
) in M⊙, and redshift (z), with distance method indicated in parentheses. Here, (k) means kinematic, (m) median (redshift-independent), and (n) narrowband (Hα). Where available, we indicate the spectral index (α; Fig. 9; Sect. 3.2) and the location of the SDSS spectroscopic fiber as a filled pink circle (Fig. 8; Sect. 3.1, Fig. 9). Bottom left: White circles indicate the LoTSS 6″ beam, noting that the restoring beam used in DDFacet (Tasse et al. 2018) for each image product type is kept constant over the data release region and that all image products are made with a uv-minimum of 100 m with the uv-maximum varied to provide images at different resolutions; the highest resolution 6″ images use baselines up to 120 km (i.e., all LOFAR stations within the Netherlands).
Current usage metrics show cumulative count of Article Views (full-text article views including HTML views, PDF and ePub downloads, according to the available data) and Abstracts Views on Vision4Press platform.
Data correspond to usage on the plateform after 2015. The current usage metrics is available 48-96 hours after online publication and is updated daily on week days.
Initial download of the metrics may take a while.