| Issue |
A&A
Volume 679, November 2023
|
|
|---|---|---|
| Article Number | A19 | |
| Number of page(s) | 31 | |
| Section | Stellar atmospheres | |
| DOI | https://doi.org/10.1051/0004-6361/202346487 | |
| Published online | 01 November 2023 | |
To clump or not to clump
The impact of wind inhomogeneities on the optical and NIR spectroscopic analysis of massive OB stars
1
Departamento de Física, Ingeniería de Sistemas y Teoría de la Señal, Universidad de Alicante,
Carretera de San Vicente s/n,
03690
San Vicente del Raspeig, Spain
2
Departamento de Física Aplicada, Facultad de Ciencias, Universidad de Alicante,
Carretera de San Vicente s/n,
03690
San Vicente del Raspeig, Spain
e-mail: klaus.rubke@ua.es
3
Instituto de Astrofísica de Canarias,
C. Vía Láctea, s/n,
38205
La Laguna, Tenerife, Spain
4
Departamento de Astrofísica, Universidad de La Laguna,
Avenida Astrofísico Francisco Sánchez, s/n,
38205
La Laguna, Tenerife, Spain
5
LMU München, Universitäts-Sternwarte,
Scheinerstr. 1,
81679
München, Germany
Received:
23
March
2023
Accepted:
3
July
2023
Context. Winds of massive stars have density inhomogeneities (clumping) that may affect the formation of spectral lines in different ways, depending on their formation region. Most of previous and current spectroscopic analyses have been performed in the optical or ultraviolet domain. However, massive stars are often hidden behind dense clouds rendering near-infrared observations necessary. It is thus inevitable to compare the results of such analyses and the effects of clumping in the optical and the near-infrared, where lines share most of the line formation region.
Aims. Our objective is to investigate whether a spectroscopic analysis using either optical or infrared observations results in the same stellar parameters with comparable accuracy, and whether clumping affects them in different ways.
Methods. We analyzed optical and near-infrared observations of a set of massive O stars with spectral types O4-O9.5 and all luminosity classes. We used Fastwind model atmospheres with and without optically thin clumping. We first studied the differences in the stellar parameters derived from the optical and the infrared using unclumped models. Based on a coarse model grid, different clumping stratifications were tested. A subset of four linear clumping laws was selected to study the differences in the stellar parameters derived from clumped and unclumped models, and from the optical and the infrared wavelength regions.
Results. We obtain similar stellar parameters in the optical and the infrared, although with larger uncertainties in the near-infrared, both with and without clumping, albeit with some individual deviating cases. We find that the inclusion of clumping improves the fit to Hα or He II 4686 in the optical for supergiants, as well as that of Brγ in the near-infrared, but it sometimes worsens the fit to He II 2.18 μm. Globally, there are no significant differences when using the clumping laws tested in this work. We also find that the high-lying Br lines in the infrared should be studied in more detail in the future.
Conclusions. The infrared can be used for spectroscopic analyses, giving similar parameters as from the optical, though with larger uncertainties. The best fits to different lines are obtained with different (linear) clumping laws, indicating that the wind structure may be more complex than adopted in the present work. No clumping law results in a better global fit, or improves the consistency between optical and infrared stellar parameters. Our work shows that the optical and infrared lines are not sufficient to break the dichotomy between the mass-loss rate and clumping factor.
Key words: stars: mass-loss / stars: massive / infrared: stars / stars: early-type / stars: atmospheres
© The Authors 2023
 Open Access article, published by EDP Sciences, under the terms of the Creative Commons Attribution License (https://creativecommons.org/licenses/by/4.0), which permits unrestricted use, distribution, and reproduction in any medium, provided the original work is properly cited.
This article is published in open access under the Subscribe to Open model. Subscribe to A&A to support open access publication.
1 Introduction
The evolution of massive stars is an intricate subject. These relatively scarce objects evolve through various and sometimes extreme stages such as blue super- and hypergiants, luminous blue variables, Wolf-Rayet stars, and red supergiants, reaching (in most cases) their maximum luminosity when dying as supernovae before becoming compact objects such as neutron stars and black holes, or just a diffuse remnant evidencing the explosion (Langer 2012). Moreover, they are usually born in double or multiple systems (Sana et al. 2012) whose components may interact along their evolution, adding new possibilities to the evolutionary zoo: stars that have been spun up, stars stripped from their outer layers, stars that have been violently ejected from their system and travel through space as walk- or runaways, high-mass X-ray and γ-ray binaries, or combinations of neutron stars and black holes in binary systems that may emit gravitational waves (e.g., de Mink et al. 2013; Götberg et al. 2018; Renzo et al. 2019; Langer et al. 2020; Sander 2019; Abbott et al. 2022)
Being powerful sources of energy and matter, these stars have a strong impact on their surroundings and even on their host galaxy, whose chemical and mechanical evolution is affected. Moreover, our interpretation of the spectra or the population diagrams of the host galaxy depends on our correct understanding of its present and past massive star population (Wang et al. 2020; Menon et al. 2021).
Advances in our modeling of the different evolutionary stages require that the physical parameters of the stars are accurately known, which means correctly modeling the main relevant processes that dominate the evolution is necessary. It has long been realized that the process of mass loss has a strong impact on the evolution of these stars from the early phases onward (Chiosi & Maeder 1986). Thus accurate knowledge of their mass-loss rates is crucial. For hot stars, the dominant mechanism producing the stellar wind is the scattering and absorption of energetic photons via spectral line transitions, and the corresponding momentum transfer onto the stellar plasma. The line-radiation-driven wind theory (Castor et al. 1975; Pauldrach et al. 1986) has been quite successful in explaining how mass is driven away from the stellar surface by the radiation field. The actual size of the mass-loss rate, however, is still debated to date, and there might be uncertainties within a factor of about three, with significant discrepancies regarding the derived values when using different diagnostic tools (e.g., Fullerton et al. 2006).
The main reason for these uncertainties (at least in the earlier phases of massive stellar evolution) is the wind structure. Because of the intrinsic instability of the line-driving process – the so-called line deshadowing instability (LDI: e.g., Owocki & Rybicki 1984; Feldmeier 1995; Sundqvist & Owocki 2013, and already Lucy & Solomon 1970) –, the stellar wind is predicted to deviate from homogeneity. Most likely, it is strongly structured, forming clumps of high density separated by an inter-clump medium which is rarefied or even almost void. The effect of this structure on the line profiles used as diagnostic tools is different for resonance lines (usually observed in the ultraviolet, and with an opacity that depends linearly on density) and for recombination lines (usually observed in the optical or near-infrared, with an opacity that depends on density quadratically). In addition, and due to the Doppler effect, the spatial distribution of the velocity plays also a role in allowing photons to escape (“vorosity” effect, Owocki 2008).
This density structure, or clumping, is currently modeled within two flavors of approximation. In the first one, known as micro- or optically thin clumping, and firstly implemented (in its current description) into a non-local thermodynamic equilibrium (NLTE) atmosphere code by Schmutz (1995), the light interacts with the wind-plasma only within the overdense clumps, which are adopted to be optically thin for all considered processes. This assumption is usually justified for recombination line processes such as Hα in not too dense winds. In the alternative approximation, known as macro- or optically thick clumping (see Owocki et al. 2004; Oskinova et al. 2007; Owocki 2008; Sundqvist et al. 2010, 2011, 2014), the actual optical depth of the clumps for the considered process is (or needs to be) accounted for; for example, even if a clump may be optically thin in Hα, it is most likely optically thick for a (UV) resonance line.
In the optically thick case, the light is affected by porosity effects (both in physical space for continua and in velocity space for lines), which usually allow for increased photon escape through the interclump medium1. Compared to the average opacity resulting from the assumption of optically thin clumping, the effective opacity in optically thick clumps decreases2, leading to potential de-saturation effects, particularly in UV resonance lines (Oskinova et al. 2007). Moreover, in such a situation, a non-void interclump medium also plays a decisive role, not only for opening porosity channels, but also for providing additional opacity to allow for saturated UV resonance lines which would otherwise become (in contrast to observations) desaturated (Sundqvist et al. 2010).
Clumping has a severe effect on the derived mass-loss rates. When recombination lines are used as diagnostics, their emission (and absorption) increases in the clumps with the square of the density. In addition, since the average of the square is larger than the square of the average, the actual mass-loss rate is lower than the one obtained when adopting a homogeneous medium. When resonance lines are used, the effect of over- and under-densities (almost) cancels out the microclumping approach, and the derived mass-loss rate remains unaffected. When, for resonance lines, optically thick clumping is accounted for, the actual mass-loss rate may be larger than the one obtained from both a micro-clumped and a homogeneous medium.
The distribution of clumping as a function of distance from the star or velocity (which is usually adopted to increase monotonically, but see Sander et al. 2023) has been studied by several authors using different diagnostics that probe different wind regions, broadly moving to longer wavelengths to probe outer regions (e.g., Puls et al. 2006; Najarro et al. 2011; Bouret et al. 2012; Rubio-Díez et al. 2022). They agree that clumping starts close to the photosphere and increases up to a maximum, remaining constant or decreasing in the intermediate and outermost regions. The degree of clumping, that is the maximum contrast between the density in the clumps and the density in an homogeneous medium with the same mean density, has also been studied by these and other authors (e.g., Hawcroft et al. 2021; Brands et al. 2022) with values that range from three to 20 for Galactic stars, or at least for stars with high mass-loss rates (when analyzing lower-metallicity stars, Brands et al. 2022).
Massive stars are often hidden behind dense clouds of gas and dust, either local to them and their star-forming regions, or as a result of the accumulated matter in their direction. Therefore, it is often necessary to observe them in the near-infrared (NIR), where extinction is less severe than in the optical. This is particularly true for our Galaxy, where the high extinction in the Galactic Plane hides a significant number of massive stars, rendering NIR observations a key tool for their study.
In this paper we aim to study the effect of clumping onto the stellar parameter determination when using optical or NIR diagnostic lines, as well as the consistency of the parameters obtained from the two wavelength domains. Our study has been done in the approximation of micro-clumping, as recent studies have shown that macro-clumping has no significant effect on the recombination lines (Sundqvist & Puls 2018); Hawcroft et al. 2021; Brands et al. 2022). Moreover, we used different clumping distributions that have been proposed in the literature. To this end, we analyzed Galactic O-type stars with spectral types O4-O9.5 and luminosity classes from I to V. The stars have been observed in the optical and infrared with a high resolving power and high signal-to-noise ratio (S/N).
We present the data used for our study in Sect. 2, and our methodology in Sect. 3. In Sect. 4, we explain how we derived the stellar parameters when adopting a homogeneous wind, both in the optical and the NIR. In Sect. 5, we explore the effects of clumping on the stellar parameters, using different clumping distributions on a test model grid. In Sect. 6, we analyze the observed stars again, now with clumping. Section 7 discusses the impact of clumping on the analysis results. Conclusions are presented in Sect. 8.
2 The data
For our work, we selected those O stars from the NIR catalog by Hanson et al. (2005) that were also present in the IACOB Spectroscopic Database (Simón-Díaz et al. 2011) at the beginning of our project (see Table 1). The Hanson et al. spectra were obtained with the Infra-Red Camera and Spectrograph (IRCS) mounted at the Cassegrain focus of the 8.2 m Subaru Telescope at Mauna Kea, Hawaii, in the H and Κ bands with a resolving power R ~ 12 000 and signal-to-noise (S/N) ~ 200–300. They cover specific regions of the Η and Κ bands: 1.618–1.661, 1.667–1.711, 1.720–1.765, 2.072–2.123, 2.152–2.205, 2.238–2.293 and 2.331–2.388 μm. Although the wavelength coverage is not complete, the main Η and He lines in the NIR are present. IACOB spectra were obtained with the Fibre-fed Echelle Spectrograph (FIES) attached to the Nordic Optical Telescope (NOT) with S/N ≥ 150 and R ~ 46 000, covering the full range from 3710 to 7270 Å. Details on the observations and data reduction can be found in the references above. The sample covers the range of Ο spectral types from 04 to 09.5 and all luminosity classes. According to Holgado et al. (2022), most stars show line profile variations, but only one is classified as SB1 (HD 30614, α Cam). Thus we assume that the spectra are not significantly contaminated by companions. Although some spectral types are under-represented (like mid-type supergiants or cool late-type dwarfs), the sample as a whole provides a good testbed for the global behavior of O-type stars (see Fig. 1 for an example of the available data).
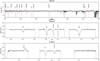 |
Fig. 1 Example for the spectra available in our sample (HD 46150). Upper panel: optical spectrum from the IACOB database; lower panels: NIR spectra from the Hanson et al. (2005) catalog. |
Ο stars selected for the analysis.
3 Methodology
To determine optical and NIR parameters, we use two main tools: a full grid of synthetic optical and near-infrared spectra, and an automatic tool that allows us to determine the parameters for a large sample of stars. We generate the first one using the code Fastwind (Puls et al. 2005, version 10.1), covering the range of massive OB star parameters, with a grid of ~100 000 models detailed below. To create this grid of models, we used the distributed computation system HTCondor3. The second ingredient is iacob_gbat (Simón-Díaz et al. 2011; Sabín-Sanjulián et al. 2014; Holgado et al. 2018, Appendix A), an automatic tool that allows us to fit the observed spectrum, returning the stellar/wind parameters corresponding to the best-fitting model (as defined by the methodology described in Sect. 3.2.1). Since our version of this algorithm has been designed for the optical range, we needed to expand it to the NIR.
Parameter ranges for the grid models.
3.1 A model grid for optical/NIR FASTWIND analyses
The NLTE, line-blanketed and unified model atmosphere code FASTWIND requires as input the atmospheric parameters. I.e., for the description of the photosphere, we have to provide effective temperature, Teff, gravity, log g, radius, R*, microturbulent velocity, υmic, and surface abundances. Wind parameters are mass-loss rate, Ṁ, terminal velocity, υ∞, and the exponent β of the canonical β-velocity law, as well as a description of the inhomogeneous wind structure (“clumps”). Since for the considered parameter space, all investigated features remain optically thin in the clumps (Sundqvist & Puls 2018), we need to provide “only” the spatial stratification of the clumping factor4, fcl, that describes the overdensities of the clumps with respect to the average wind density. Setting fcl to unity everywhere results in a smooth wind model.
It is obvious that the combination of all these parameters would result in a huge amount of models. To reduce that number, we constrain the stellar radius and the terminal velocity (from υesc, see Kudritzki & Puls 2000) using prototypical values (see Holgado et al. 2018), and calculate the mass-loss rate from the condition that the wind strength parameter (or optical depth invariant), Q = Ṁ/(R*υ∞)3/2, results in one of the grid-values as denoted in Table 2 for which the units are M⊙ a−1 for Ṁ, km s−1 for υ∞, and R⊙ for R*. The quantity Q combines mass-loss rate, stellar radius, and wind terminal velocity in such a way that the emission in Hα (and other wind diagnostics lines, as long as recombination-dominated) can be shown to vary (almost) as a function of Q alone (see Puls et al. 1996; Repolust et al. 2005, Fig. 12; and Holgado et al. 2018, Appendix B).
Table 2 displays more information about our model grid (here for the case of unclumped models), where YHe denotes the He-abundance as NHe/NH, with N the corresponding particle density. Figure 2 illustrates the distribution of grid models in the log g vs. log Teff (Kiel) diagram, together with the Geneva evolutionary tracks for 5, 10, 15, 20, 25, 40, 50, 60, 85 and 120 M⊙, and for “solar” conditions (Z = 0.014), as published by Ekström et al. (2012). The final grid contains a total of 107 547 models. In Sect. 5 we will calculate additional grids, with various clumping laws as described there.
Previous model-grid spectra used by our working group have been calculated for the optical range (e.g., Sabín-Sanjulián et al. 2017; Holgado et al. 2018). For our current study, we needed to extend them to the near infrared. Table 3 lists the H and He lines included in our synthetic spectra. This list refers only to the diagnostic lines covered in the formal solution; for the solution of the rate equation system, all decisive lines are considered. The table also indicates additional blends of the major component. For example, the total Brγ complex comprises four different transitions. Blends from additional elements, such as nitrogen, have been neglected. As well, Br12 was finally not included among the diagnostics (see comments in Sect. 3.2.2).
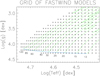 |
Fig. 2 Location of models from the FASTWIND grid in the log g vs. log Teff plane. Nonrotating Geneva evolutionary tracks (Ekström et al. 2012) are plotted in green, and the blue line defines the corresponding Zero-Age Main Sequence (ZAMS). The numbers indicate the tracks’ initial stellar masses in units of M⊙. |
3.2 Automatic fitting and extension to the NIR
3.2.1 iacob_gbat
iacob_gbat is a grid-based automatic tool (Simón-Díaz et al. 2011; Sabín-Sanjulián et al. 2014; Holgado et al. 2018, Appendix A) developed to compare a large amount of synthetic spectra with the observed ones. It calculates the fitness of the individual synthetic spectra, and provides us with the best fit (following specific criteria, see below), and the corresponding stellar parameters including appropriate error bars as described below. Before running the tool, one needs to determine the rotational and macroturbulent velocities (V sin i, and Vmac, respectively). A wrong determination of these velocities can result in an erroneous value for all stellar parameters (Sabín-Sanjulián 2014, Fig. 2.13). Rotational and macroturbulent velocities are obtained with the iacob_broad tool, developed by Simón-Díaz & Herrero (2014). Details can be found in Sects. 4.1 and 4.2.1.
In the next steps, we define interactively the wavelength range of the considered lines, correct for radial velocity, in case renormalize the continuum, and/or clip nebular lines. Finally, we run iacob_gbat to determine the six stellar and wind parameters (see Sect. 3.1). The basic strategy of iacob_gbat is to find the minimum χ2 from the sum of the corresponding individual χ2 for each considered line i, i.e., the optimal solution.
The weight given to each line,  , is iteratively determined, either from the photon noise in the neighboring continuum of the line, or, if larger, from the minimum average deviation between the synthetic and the observed line i, for the overall best-fitting model5.
This strategy ensures that systematic errors are accounted for (in case where the synthetic profiles are outside the noise-level compared to the observed ones), and that such lines obtain a low weight in the overall χ2. A detailed description of the total procedure can be found in Holgado et al. (2018, Appendix A)6.
As a result, a distribution of χ2 values is obtained that can be used to identify the best-fitting model and the corresponding values/uncertainties for each of the stellar and wind parameters. In Fig. 3, we plot the distribution of χ2 versus Teff for HD 15629. The minimum χ2 value (resulting from an interpolation of the lower envelope) provides us with the appropriate value for Teff, and the 1σ uncertainty is estimated from the range where  .
.
Sometimes, the distributions present specific difficulties: cases in which we cannot determine a given parameter with sufficient accuracy, or values that are at the border of the grid parameter range. Thus and always, the final output has to be examined individually, to identify these cases and at least to minimize corresponding problems. A more detailed discussion of the different problems can be found in Sabín-Sanjulián (2014).
Diagnostic H/He optical and NIR lines used in the current work (regarding Br12 see Sect. 3.2.2).
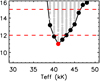 |
Fig. 3 An example of the distribution of χ2 (y-axis) versus effective temperature (HD 15629). The minimum of χ2 is indicated by a red dot, and 1 and 2σ ranges are found from the intersection between the dashed lines and the distribution. |
3.2.2 Extension to the near infrared
To extend the iacob_gbat tool toward the NIR, we added several modules to the code. In addition to including all the NIR lines from Table 3 for the determination of the best fit model, we performed several tests to check the extended version.
The ratio between the strengths of He I 4471 and He II 4541 is a good temperature diagnostics in the optical range. As shown in Fig. 4, the ratio between He I 1.70 and He II 1.69 in the NIR yields a similar diagnostic. Here we show their equivalent width ratio for a series of models ranging from 25 000 to 55 000 K, and for three values of log g. Obviously, these H-band lines can be as sensitive to the temperature as the optical ones, and with a very analogous behavior.
Similar to the Balmer lines in the optical, the shape and wings of the Brackett lines in the NIR are sensitive to gravity7. However, during our test calculations, we realized a peculiar behavior of the different Brackett lines, making it difficult or even impossible to simultaneously fit the observed spectra. Indeed, particularly the higher members of the Brackett series (starting around Br12) are only poorly represented by our synthetic profiles. We carried out a series of tests, grouping the lines in pairs (Br10 & Br11, Br11 & Br12, Br10 & Br12), i.e., skipping always one of the lines in our parameter determination. This way, we checked which pair was more consistent with the rest of the NIR lines. Our tests indicated that the highest member considered here, Br12, gave the poorest agreement.
Currently, the origin of this disagreement remains unclear, but might be related to insufficient accuracy of line-broadening data, collision strengths for hydrogen transitions with higher upper levels, difficulties in the reduction process, or a combination of all of them all (see also Repolust et al. 2005 and Sect. 7). Forthcoming work needs to identify the region in stellar parameter space where the problem appears most strongly, its physical origin, and potential solutions. Meanwhile, and since this problem becomes particularly worrisome only from Br12 on, we decided to skip this line from our line list when applying the iacob_gbat tool for our IR analysis.
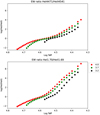 |
Fig. 4 Equivalent width (EW) ratios for selected optical and NIR He I/He II lines, as a function of log Teff and log g (see legend), resulting from our model-grid calculations. |
4 First results: Parameter determinations adopting smooth winds
We divide our stellar sample in three groups according to the luminosity class of the stars (i.e., [I-II], [III] and [ IV-V]). Each of the three groups presents a particular behavior w.r.t. the fits obtained. Dwarf stars show the best fits to the observed spectrum, whereas fit difficulties increase for giants and are usually largest for the luminosity class I stars, those with the strongest winds.
4.1 Stellar parameters from the optical spectrum
We first determine the stellar parameters using only the optical spectra secured in the IACOB database. We determine the V sin i and Vmac values using the iacob-broad package (Simón-Díaz & Herrero 2014). Our values for the optical, presented in Table 4 together with their NIR counterparts8, agree with (and have errors similar to) those from Simón-Díaz & Herrero (2014) within 20 km s−1 or ±20%, except for the Vmac of the fast rotators.
However, because of the high rotational velocities, this has no impact on the final results (within the uncertainties). Updated values have been recently presented by Holgado et al. (2022). For most stars, the differences are well within the adopted uncertainties. Only HD 149757 and HD 15570 show a larger difference. For the first object, Holgado et al. (2022) estimate 385 and 94 km s−1 for V sin i and Vmac, respectively, compared to a value of 290 km s−1 for both quantities as derived here. This is a consequence of the degeneracy between rotational and macroturbulent velocities when both reach high values. For the second star, we find 38 and 120 km s−1, where as Holgado et al. (2022) estimate 81 and 115 km s−1. We attribute this large difference to the use of different spectra and different lines. Holgado et al. have used the N V 4605 line, which is in a region of complicate normalization due to the nearby strong N III emission, whereas we have used the O III 5592 line. To ensure that these differences will not affect our results, we have repeated our optical and infrared analyses described below with the values from Holgado et al. (2022), without any significant differences. This finding results from the combined rotational and macroturbulence broadening, producing similar profiles in these cases.
Table 5 summarizes the parameters obtained from our optical analysis after running the iacob_gbat tool. Here and in the following similar tables, upper and lower limits refer to the corresponding parameter ranges of our model grid(s) only. As an example, β > 1.0 would mean that β ranges, within its 1σ uncertainties, from 1.0 to 1.5, when consulting Table 2. In Table 5, such limits frequently occur for the parameters β and υmic. For the strong Hα and/or He II 4686 wind emission from our supergiants (which actually should allow for quite a precise determination of β), this simply means that the contribution of these lines to the global χ2 is low when counted with equal weights as done here. The additional information contained in the other optical H and He lines is usually not sufficient to constrain these parameters more accurately. The inclusion of information from UV P Cygni lines would be very helpful in these cases. On the other hand, more precise values for the micro-turbulent velocity can be only obtained from the analyses of metal lines from species with more than one ionization stage visible (e.g., Markova & Puls 2008); however, in addition, such values might depend on the chosen atom.
In Table 5, gravities are not corrected for the effects of centrifugal acceleration, as we here are only interested in the formal fits and do not compare with evolutionary models. Errors were obtained from iacob-gbat as described above, but following the arguments from Sabín-Sanjulián et al. (2017) we set a lower limit of 0.1 in log Q and 0.03 in YHe for these uncertainties when the automatically derived formal errors turned out to be lower9. Figure 5, left side, displays a comparison between selected observed optical profiles and the synthetic lines from the best fit model for each star.
From the fits shown in Fig. 5 (left side) we draw the following conclusions:
Except for one object (see below), all dwarfs show excellent fits. Even the fast rotators do not show any significant problems, despite of potential effects not considered here, like gravity darkening or geometrical deformation; the fit for HD 149757 is poorer, as the model yields too broad wings in some of the Balmer lines.
The two giants within our sample are mid-types. HD 190864 shows small differences in the cores of the He I lines, with slightly too shallow theoretical profiles for He II 4200 and 4541 complemented by a slightly too deep profile for He II 4686. HD 203064, a fast rotator, displays a poor fit to Hα and, to a lesser extent, to He II 4686.
The supergiants display the largest fitting problems, particularly in Hα, sometimes together with problems in Hβ and He II 4686 (much less though), which points to some wind influence. This agrees with the findings by Holgado et al. (2018). The largest difficulties are found for the Hα P-Cygni like profile of the late types, HD 30614 (of Ia luminosity class) and HD 210809. In both stars the He II 4686 core shows a shift to the red. The best fit in this group is obtained for the less luminous supergiant, HD 209975 (Ib). Early-type supergiants have an intermediate behavior in Hα (despite of showing emission), although they present some difficulties for the red wing of Hβ that are not seen in late-type supergiants.
We compare our parameters with those recently quoted by Holgado (2019) (most of the values used here have already been published in Holgado et al. 2018), see Fig. 6. All temperatures agree well within the errors given here and by Holgado (2019). For the (uncorrected) gravity, we find significant differences for the rapidly rotating dwarfs, particularly HD 149757, for which we obtain log g = 3.84 ± 0.17, whilst Holgado (2019) inferred 3.50 ± 0.05. Although marginally within the uncertainties, HD 217 086 also shows differences in log g (3.60 ± 0.11 versus 3.81 ± 0.12). We attribute these differences to the difficulties with the normalization and radial velocity correction in fast rotators. As the line wings are very extended and reach the continuum rather smoothly, a small difference in the data treatment may result in a relatively large difference in gravity. In addition, in the case of HD 149757, variability also plays a role10.
For log Q, the agreement is excellent11, except again for the fast rotating dwarfs. This is basically due to the lack of sensitivity of the diagnostics (mainly, the Hα line) at these low values of Q, combined with high rotational velocities. The helium abundances agree also well12.
Comparison between V sin i and Vmac values obtained from optical (“OP”) metal lines and from the NIR He I λ1.70 μm line.
Stellar parameters obtained from the optical analysis using unclumped models.
4.2 Analysis in the near infrared
In this subsection, we derive the stellar parameters solely from the near infrared, following a similar methodology as we did in the previous subsection. This will tell us how far results obtained for stars in heavily obscured clusters can be compared to those provided in the extensive literature of optical analyses. While this exercise has already been carried out by other authors (e.g., Repolust et al. 2005, or more recently within investigations when fitting simultaneously optical and infrared spectra, e.g., Najarro et al. 2011 or Bestenlehner et al. 2014), we have to check whether our automatic procedure extended to the near infrared results in reliable stellar parameters.
4.2.1 Determination of V sin i and Vmac in the NIR
We start again by deriving V sin i and Vmac using iacob-broad. In the optical, these values were derived using metal lines, whose broadening is dominated by processes determining these quantities. However, the metal NIR lines are too weak in our spectra and are not available for all stars. For this reason, we are forced to use He I lines, which are affected by the Stark effect, limiting our ability to measure the rotational velocity for slow rotators (or the macroturbulent velocity when this is low). H and He II lines are even less well suited, since they are dominated by the strong linear Stark effect. Thus we decided to use the He I λ1.70 μm line, which is strong enough for all the stars. Ramírez-Agudelo et al. (2013) have shown that it is possible to derive accurate rotational velocities from the (quadratically) Stark broadened optical He I lines. However, the Stark broadening increases toward the infrared, and thus it could place a lower limit (see below) on the derived V sin i values.
Figure 7 compares the projected rotational velocities obtained from both wavelengths ranges (filled circles), whereas Table 4 gives the numerical values. In the figure, dashed lines indicate the region that departs by ±30 km s−1 or ± 30% (whatever is larger) from the 1:1 relationship. This band marks the region where stellar parameters are not affected beyond errors by changes in the adopted rotational velocity (Sabín-Sanjulián 2014). It does not indicate the uncertainties in the determinations, which sometimes are larger than the difference between the values obtained from the optical and the NIR spectra, as discussed below. We see that the V sin i pairs are always located within these bands, and that most values agree reasonably well.
Therefore, we do not expect a significant impact on our results due to these differences.
We also see that there might be a limit to the lowest rotational velocities determined with He I 1.70 μm (around 80 km s−1), although this would require more slowly rotating stars to be confirmed (the points cluster close to the 1:1 relation). The only really departing point, at V sin i (opt) = 115 and V sin i (NIR) = 78 km s−1, corresponds to HD 30614, with a strong He I λ1.70 μm line in absorption. This discrepancy is related to the large value found for Vmac (see Table 4 and open diamonds in Fig. 7). As expected, Vmac departs strongly from the 1:1 relation for some objects, especially for fast rotators. However, the tests we performed for HD 149757 and HD 15570 indicate that no significant changes in the stellar/wind parameters are expected for these stars.
We conclude that it is possible to derive the rotational and macroturbulent velocities from the NIR spectrum alone, although with larger uncertainties than from the optical spectra, and a presumably lower limit for the derived V sin i.
 |
Fig. 5 Spectral fits for selected optical (left) and NIR (right) lines using unclumped models. Observations are shown in black, and best fit model profiles in red. We stress that the individual model parameters for the best fitting optical and NIR profiles differ (to various extents) since the analyses have been performed separately for both ranges (cf. Table 5 vs. Table 6). The horizontal bar gives the wavelength scale for each range, and the scale of the ordinate axis is given by the vertical bar (at the bottom of the Hα column for the optical range, and at the bottom of the Br10 column for the NIR.) |
4.2.2 Stellar parameters from the NIR spectrum
We now derive the stellar parameters for the same stars as in Sect. 4.1, using the NIR spectra secured and reduced by Hanson et al. (2005). The results of the NIR analysis are presented in Table 6. Again, β and microturbulent velocities could not be well constrained, indicating that for these stars the near infrared is not better suited than the optical for this task. This suggests that the difference in line formation depth between the optical and the H- and K-band spectra is not sufficient to provide new information, at least at the resolution and S/N of the spectra analyzed here. The comparison of the observed profiles with those from the best fit model is presented in Fig. 5, right side. Inspection of these profile fits leads to the following summary:
The best fit quality is again obtained for the dwarfs, but now not without significant problems. The best fitted lines are the He Ones, especially He I λ1.70 μm. Br10 and Br11 also fit reasonably, but Brγ is not well fitted. For this line, the fast rotator HD 217086 shows a profile different from the other dwarfs, with a strong and relatively narrow absorption in the blue halfline (presumably because of a narrow emission component, see Fig. 8), and a broad absorption redward from line center.
Giants – The O7.5 III fast rotator HD 203064 displays a similar Brγ profile as the O7 V fast rotator HD 217086, and a similarly poor fit (see also Fig. 8), pointing to some process(es) not considered in our models, presumably related to differential rotation (see Petrenz & Puls 1996 for a discussion of similar line-shapes of Hα). The fit to Br10 and Br11, however, is much better. The slower rotating giant, HD 190864, shows also a good fit for Br10 and Br11, and a poor fit for Brγ, although without the characteristic shape of the fast rotators. For both giants, the fit to the He lines is of varying quality. Globally, the fits are again acceptable, except for Brγ.
For almost all supergiants, the Brackett lines, particularly Brγ, show a poor fit quality, except for, surprisingly, HD 30614 (that had the largest problems in the optical) and, to a lesser extent, the low luminosity object, HD 209975. The early-type supergiants show the poorest fits to the Brackett spectrum, with the models predicting an absorption profile for Brγ while the observations show emission instead. The only exception with a reasonable fit is Br11 from HD 15570. Regarding the He lines, these are also poorly fitted in the late-type supergiants. Within a given spectral subtype, He I λ1.70 μm departs more and more from a good fit with increasing luminosity. Still, for the cooler supergiants, He IIλ2.18 μm is always stronger than predicted, and He IIλ1.69 μm (not shown) only modestly reproduced. The situation is different for the early-type supergiants, where the fits to the He II lines are acceptable, though far from being perfect. We compare again with previous results in the literature, namely those from Repolust et al. (2005) (Fig. 9) Globally, there is a fair agreement13 for all stars, except for stars #9 and #11 (HD 14947 and HD 210809). Here, we obtain a higher Teff and log g, which relates to the fact that in both stars the shallow Br10 and Br11 lines are well fitted in our approach, whilst in the fits by Repolust et al. they appear as too strong. Details about the consequences of such shallow Br10/11 lines are discussed in Sect. 7. In the case of the first star, the high temperature forces an increase in the He abundance to fit the He I line at 1.70 μm (our best model has YHe = 0.30).
Moreover, the log Q of star #12 (HD 209975) shows a large discrepancy, with a much lower value in our work, due to the reaction of the He II lines to mass-loss. While the He I line and the Brackett lines have only a small response to an increased mass-loss, the He II lines (already too shallow in our fit) would become even shallower. Indeed, grid models calculated with a log Q similar to that of Repolust et al. (2005) lie just beyond our 1σ uncertainty from the best-fit model. Finally, the helium abundances agree well, although a lot of upper or lower values are present.
Part of the larger dispersion (compared to the optical analysis, see Fig. 6) is attributed not to the effect of the improvements in FASTWIND since Repolust et al. (2005) analyses were carried out (indeed, test calculations by J.P. have shown that the impact of such improvements on the IR signatures is marginal), but to the differences in the by-eye (as used by Repolust et al. 2005) and automatic techniques. When the line fits are poorer, the subjective weight given to a particular fit increases, pushing the result into a given direction, whereas the automatic procedure still forces a compromise for all considered profiles.
An extreme example is given by star number #9 (HD 14947). By means of our automatic fitting procedure, we find acceptable models (those that contribute to the final parameters values) that extend up to effective temperatures of 47 000 K, because of the uncertainties by a very weak He I line, biasing the final parameters toward hotter temperatures. As pointed out, the corresponding values by Repolust et al. (2005) are much lower, mainly because they neglected the deviations between synthetic and observed Br10 and Br11 lines.
The final comparison is that of the parameters derived from the optical versus the NIR (Fig. 10), as this will indicate their reliability when derived from the infrared alone. Globally, there is a fair global agreement within the errors, as shown by the mean values of the differences 〈ΔTeff〉 = 〈Teff(Opt) − Teff(NIR)〉 = −83 ± 697 K, 〈Δ log g〉 = −0.08 ± 0.07 dex, and 〈Δ log Q〉 = +0.08 ± 0.10 dex. Again, stars #9 (HD 14947) and #11 (HD 210809) show large differences, produced by the higher gravities and their impact on nearly all other parameters, and star#12 (HD 209975) shows a too low log Q value in the infrared. With more He I lines, this effect does not appear in the optical. Finally, for the helium abundances, the average agreement is poorer than for the other parameters (〈YHe〉 = −0.04 ± 0.01), but in this case, the statistics is not as good due to the large number of upper or lower limits present in the results. Nevertheless, a certain trend to derive higher abundances in the near infrared might become visible.
Globally, the infrared fits are worse than the optical ones, which reflects in larger systematic uncertainties (partly related to few dominating objects). Moreover, inspection of the χ1 distributions from iacob_gbat and the fits from Fig. 5 indicate that this is not due to the differences in resolution and S/N between the optical and infrared spectra, but a consequence of a less accurate reproduction of the infrared lines given the model-inherent assumptions (e.g., a smooth wind until now). This finding is different from the results quoted by Repolust et al. (2005) who found comparable errors in both wavelength ranges, and reflects the different approach of error determination and also the different fitting procedure itself. Finally, there is a relatively large number of objects for which only upper or lower limits for the helium abundance could be derived, suggesting a lack of sensitivity of the infrared spectrum to that parameter (or a degeneracy because of the larger uncertainties involved). In our case, the problem lies partly in the lack of a sufficient number of suitable He lines, particularly from He I.
Overall, however, we may conclude that we can use the infrared spectra to determine stellar parameters in a similar way as we are used to do with the optical ones, but we observe specific trends and larger uncertainties that have to be taken into account.
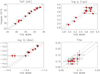 |
Fig. 6 Comparison between the stellar parameters obtained by Holgado (2019; see also Holgado et al. 2018) and our work. Upper left panel: effective temperature. The dashed lines represent ± 1000 K; upper right panel: logarithmic gravity (±0.1 dex); lower left panel: log Q (±0.2 dex); lower right panel: helium abundance YHe(±0.03). Numbers indicate the stars as listed in Table 1. |
Stellar parameters obtained from the NIR analysis using unclumped models.
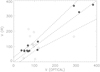 |
Fig. 7 V sin i (filled circles) and Vmac (open diamonds) values obtained from the optical metal lines and from He I λ1.70 μm in the NIR. The dashed lines give the band ±30 km s−1 (for low V sin i) or 30% of V sin i (optical), whatever is larger. |
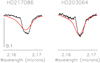 |
Fig. 8 Brγ for the rapidly rotating dwarf and giant stars HD 217086 and HD 203064. Both line profiles show a small blue emission peak close to the core of the line, resulting in a distorted blue wing. Red profiles are from best fitting models. |
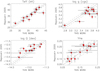 |
Fig. 9 Comparison between the stellar parameters obtained by Repolust et al. (2005) and our work, both from the NIR alone. Upper left panel: effective temperature. The dashed lines represent ± 1000 K; upper right panel: logarithmic gravity (uncorrected, ±0.1 dex). Star number 9 has been slightly shifted in both axes for clarity; lower left panel: log Q (±0.2 dex); lower right panel: YHe(±0.03), and stars #7, 9, 10, and 11 have been slightly shifted upward from its value in Repolust et al. (2005, YHe= 0.20) to avoid overlap, as well as star #4 (YHe= 0.15). Numbers indicate the stars as listed in Table 1. |
5 Clumping
The line-driven winds from massive stars are prone to instabilities, in particular the line-deshadowing instability (LDI, e.g., Owocki & Rybicki 1984), which result in an inhomogeneous outflow (e.g., Owocki et al. 1988; Owocki 1991; Feldmeier 1995). These density inhomogeneities (clumps) modify the shape and strength of spectral lines formed in the wind, and need to be accounted for in corresponding wind diagnostics (e.g., Hillier 1991; Schmutz 1995; Hillier & Miller 1998; Crowther et al. 2002; Hillier et al. 2003; Bouret et al. 2003; Puls et al. 2006, 2008). Particularly affected by these inhomogeneities is the emission in lines formed through recombination processes such as Hα or the NIR lines used as wind diagnostics.
In these processes, the emission is proportional to ρ2, and it is the difference between the averaged quantity 〈ρ2〉 (integrated over the optical path length) and the corresponding smooth wind quantity 〈ρ〉2 that leads to more emission in an inhomogeneous structure for the same mean density 〈ρ〉, since 〈ρ2〉 ≥ 〈ρ〉2 always.
Alternatively, for an observed emission, one derives a lower mass-loss rate when adopting a clumped wind. Moreover, as clumping may be radially dependent, it may affect lines formed in different layers in the atmosphere in a different way, which may help (at least partially) to explain the discrepancies found in the previous sections when fitting either optical or NIR lines.
In the conventional approach considering optically thin clumps (which is appropriate for the diagnostics investigated in the current work, e.g., Sundqvist & Puls 2018), the wind structure is characterized by the so-called clumping factor, defined as
 (1)
(1)
Under the simplifying assumption that the interclump matter is void, this clumping factor describes the clump overdensity ρcl = fcl(ρ).
As long as fcl is spatially constant, the wind emission in lines like Hα will be the same when adopting either a smooth wind with Ṁunclumped or an inhomogeneous one with Ṁclumped, if both mass-loss rates are related via
 (2)
(2)
Thus, neglecting wind-clumping might lead to overestimated mass-loss rates, at least if, as adopted, the clumps remain optically thin at all considered wavelengths.
Optically thick clumping (also called “macro-clumping” or “porosity” – including porosity in velocity space –, e.g., Owocki et al. 2004; Oskinova et al. 2007; Owocki 2008; Sundqvist et al. 2010, 2011, 2014) can lead to additional changes, even when the clumps remain optically thin for the majority of diagnostics/wavelengths. This is because important transitions such as the Lyman ionization and/or the Lyman lines become much easier optically thick than other processes (whenever neutral hydrogen is non-negligible), and are then desaturated because of porosity effects (for an instructive visualization of such effects, see Brands et al. 2022). Consequently, the hydrogen ionization and excitation may change, leading to a change in the global radiation field and (wind) plasma conditions14. Potentially affected are, in particular, the winds from massive late-type B and A-stars, where this effect might explain certain shortcomings in the current modeling of important wind-diagnostics such as Hα from such objects. Test calculations for O-type stars (Sundqvist & Puls 2018), on the other hand, indicate that in their parameter domain this should pose no problem, since hydrogen remains highly ionized. Thus, in the following, we will consider exclusively optically thin clumping.
To this end, we compare three different clumping laws, fcl(r). First, we consider a linear increase of the clumping factor from unity (smooth density in the photosphere/lowermost wind) to a maximum value between two points in the wind. After reaching this maximum, the clumping factor is adopted to remain constant. We call this the “linear law”. The second law is the one suggested by Hillier et al. (2003, Hillier law), where the clumping factor15 follows an exponential increase (as a function of velocity) until it reaches a maximum (and then stays constant). Finally, our third law bases on Najarro et al. (2011, Najarro law) and is similar to the Hillier law in the lower wind, but includes an exponentially decreasing fcl(r) beyond its maximum. Figure 11 illustrates the different laws. The “Najarrro law” is motivated by results from a combined analysis of UV, optical, NIR and L-band (including Brα) spectra for a small O-star sample, as well as an NIR analysis of massive stars in the Quintuplet Cluster (Najarro et al. 2009), and turns out to be quite similar to theoretical predictions from radiation-hydrodynamic simulations including the LDI (e.g., Runacres & Owocki 2002, 2005).
The considered clumping laws are, among others, implemented in FASTWIND, and require specific input parameters, as detailed in the following:
- the linear law is characterized by three parameters,  , υ1, and υ2,


 (3)
(3)
where  is the maximum value for the clumping factor, υ1 is the wind velocity at clumping onset (restricted to be larger/equal to the speed of sound), and υ2 is the velocity where maximum clumping shall be reached.
– The Hillier law requires two input parameters and is expressed as
 (4)
(4)
where fV ≤ 1 is the volume filling factor (equal to the inverse of fcl when the interclump medium is assumed to be void, as frequently done). The two parameters defining this relation are  , the filling factor when the wind velocity reaches the terminal velocity (corresponding to
  in our tests), and υcl1 which marks the point where clumping begins to become important and controls how fast the function reaches its minimum. In this law, clumping begins to increase directly from the bottom of the photosphere on, but becomes significant only for υ ≳ υcl1.
– the Najarro law is formulated as
 (5)
(5)
where f∞ and υcl1 are the same quantities as in Hillier’s law, whereas υcl2prescribes how fast the filling factor increases again after reaching its minimum (i.e., how fast fcl decreases after reaching its maximum). The above clumping law has been modified compared to the original formulation by Najarro et al. (2011), enforcing an unclumped outermost wind region with fV(υ ≈ υ∞) → 1.
Table 7 displays the various parameters adopted forourforth-coming tests. Overall, in the current section, we consider four different linear laws16, two variants of the Hillier law, and one of the Najarro law. For 1 and 2 (linear law) we adopt a compromise based on the range of values provided by Najarro et al. (2011), and fix these quantities in terms of a specific fraction of the terminal velocity. In this way, our υ1 and υ2 values (absolute velocities) are consistent with the ranges obtained by Najarro et al. In summary, all υ1 values have been fixed to 10% of υ∞ (see below), whilst υ2 varies in between 25 and 94% of υ∞.
When inspecting the current literature, the  parameter covers a large range, from close to unity (unclumped) to values as high as 100. Here, we will test the values
 ![$f_{{\rm{cl}}}^{{\rm{max}}} = \left[ {10,\,20} \right]$](/articles/aa/full_html/2023/11/aa46487-23/aa46487-23-eq18.png) , following Table 2 in Najarro et al. (2011). Obviously, such an approach has only an exploratory character, since it is highly unlikely that all or most stars follow such a restricted combination of the various parameters. Once we understand better how the profile fits and the derived stellar parameters react to clumping, we will be in a good position to consider at least
, following Table 2 in Najarro et al. (2011). Obviously, such an approach has only an exploratory character, since it is highly unlikely that all or most stars follow such a restricted combination of the various parameters. Once we understand better how the profile fits and the derived stellar parameters react to clumping, we will be in a good position to consider at least  as a free parameter in our fitting approaches covering the IR band. Such studies have already started in analyses of the combined optical and UV regime (cf., Hawcroft et al. 2021, Brands et al. 2022).
In our specific models based on the Hillier and Najarro laws, we adopt values that result in a similar maximum as the linear law with  , and a similar increase toward this maximum (see Fig. 11). We check two Hillier laws, with the Hillier100 increasing faster toward maximum clumping than Hillier200 (similar to Linear10–025 vs. Linear10–050). We finally note that the quantitative behavior of the Hillier and Najarro laws, when expressed in terms of a radial coordinate, strongly depends on the adopted velocity law (υ∞ and β).
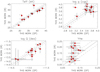 |
Fig. 10 Comparison between stellar parameters obtained in the optical and the infrared. Upper left panel: effective temperature. The dashed lines represent ±1000 K; upper right panel: logarithmic gravity (±0.1 dex). Star #9 has been slightly shifted from its value in Table 6; lower left panel: log Q (±0.2 dex); lower right panel: YHe(±0.03), and stars #10 and 8 have been slightly displaced from their values in Table 6. Numbers indicate the stars as listed in Table 1. |
Clumping laws used in our analyses.
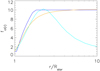 |
Fig. 11 Comparison between three different clumping laws investigated in the current work (see Table 7). Blue: Linear10–050; orange: Hillier200; cyan: Najarro200. The example refers to a velocity law with υ∞ = 1200 km s−1 and β = 0.8. |
5.1 FASTWIND coarse grid
Before analyzing the impact of clumping by means of a comparison between synthetic and actual spectra, we will test such impact for a small set of template models. To this end, we construct a coarse grid of models representing dwarfs, giants, and supergiants at different temperatures (hot, mid, and cool), resulting in nine models covering the O-star parameter range. In Fig. 12 we display these models in the log Teff – log g plane, to illustrate the corresponding evolutionary stages. Table 8 lists these coarse grid models. All models have the same (solar) helium abundance and β velocity-field exponent. In the following sections, we will discuss all coarse grid models and corresponding synthetic spectra resulting from the application of the various clumping laws, and investigate and compare their specific impact.
Stellar and wind parameters for the coarse grid models.
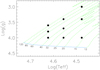 |
Fig. 12 Coarse-grid models in the log Teff – log g diagram, chosen to be representative for hot dwarfs to “cool” supergiants in the O-star regime. Overplotted in green are evolutionary tracks for Galactic nonrotating stars from Ekström et al. (2012), and the blue line defines the corresponding ZAMS. The numbers give the initial stellar masses in units of M⊙. |
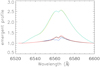 |
Fig. 13 Comparison of synthetic Hα profiles, for models with Teff = 36000 K, log g =3.40, and differing wind-clumping properties. Black: unclumped wind with log Q = −11.90. Orange: clumped model with the same mass-loss rate/wind strength parameter, using the Linear10–025 law. Red: clumped model with the same clumping properties/clumping law, but a mass-loss rate reduced by |

5.2 Clumping versus no clumping
First, we explore some general clumping effects by means of our coarse grid. Clumping modifies both radiative transfer and atomic occupation numbers (because of the altered density and radiation field), thus affecting the ionization equilibrium of all elements and consequently the stellar/wind parameters derived from model fits. Even though in our approach (at least) the subsonic stratification remains smooth, also the photospheric lines might become affected by clumping, to a various extent. This change is caused by the modified occupation numbers resulting from a modified inward directed radiation field, and particularly because of a modified filling of the absorption cores due to a different wind structure.
As already indicated, the most prominent effect is an increase of the emission in lines such as Hα. To obtain a similar emission in the clumped and unclumped case (to provide us with a similar fit quality when performing a hypothetical fit), we need to divide the unclumped mass-loss rate by  (see Eq. (2)); clearly, this is only an approximation, because of the radial dependence of fcl. This means that the wind strength parameter Q for an unclumped wind will be (roughly) equivalent to a value
  for the clumped case, where in our approach we approximate fcl by its maximum value,
  .
.
Figure 13 illustrates the potentially strong impact of clumping on the Hα line emission, by means of our grid model with Teff = 36000 K, log g = 3.40 and an (unclumped) log Q = –11.90 (corresponding to the “mid-temperature supergiant” model). This unclumped model (profile in black) is compared with four clumped ones. For two of those, we have used both the Linear10–025 (in red) and the Linear10–050 law (in blue, for designations see Table 7) together with a reduced mass-loss rate, log Q′ = −12.4 (because of  ), to obtain a roughly equivalent emission. As visible, all three Hα lines are fairly similar indeed. The blue one (with υ2 = 0.5υ∞) displays a somewhat lower emission close to the core, because a large part of the lower/intermediate wind has a lower effective mass-loss rate than the model underlying the red profile, where is reached already at 0.25υ∞. The other two profiles (in green and orange) have been calculated from clumped models with identical clumping properties as above, but now with the same mass-loss rate as in the unclumped case. The large difference is obvious, with an Hα emission roughly corresponding to that of a smooth model with wind strength parameter log
  . Here, both clumping laws deliver almost identical profiles, since due to the larger densities the line formation zone shifts to the outer wind, where both clumping laws are identical (
 ).
).
Figure 14 shows, for the same mid-supergiant parameters, the differences between the unclumped and clumped (scaled Ṁ!) models, in selected optical and NIR spectral lines. Though, as discussed above, the Hα emission remains almost identical, other lines react differently. Br10 (and also Br11, not shown) displays a weaker (and broader) absorption core for the clumped models, and Brγ is affected even stronger: whereas the unclumped model displays a slightly blue-shifted absorption, the clumped ones show a narrow central emission (red profile), or only weak absorption plus emission in the core region (blue profile).
Unlike these NIR Η-lines, Hβ (clumped) presents more absorption in the core, which is also true for the He I lines in both wavelength regimes. Since in the considered parameter range the dominant helium ion is He III (for the main part of the wind), He II lines behave similar to H lines when they are dominated by recombination processes: in the NIR, He II 21.69 (not shown) and 22.18 μm show increased emission in the core ( though on different scales), whilst He II 24686 remains mostly unchanged for the Linear10−025 law, in analogy to Hα. For Linear10−050 the emission is clearly weaker, because of the lower effective mass-loss rate. In cooler winds, when He III is no longer dominant, He π 24686 will behave differently from Hα (see Kudritzki et al. 2006).
For most lines, the line formation regions will be altered as a consequence of the different density structure in the clumped models. In particular, the increased absorption of many lines can be explained by their formation in the inner layers, before clumping plays a decisive role. In those cases, the dominant effect will be the decreased mass-loss rate in the clumped, Ṁ-scaled models, resulting in a deeper absorption (less refilling than in the smooth models with larger Ṁ).
As well, the line emission at the cores of Brγ and Hell 22.18μm is a (indirect) consequence of the modified formation depth. Concentrating on Brγ, we see at first that the wind emission in the line wings is almost identical for all three wind structures17, implying that such emission forms in the intermediate/outer wind where our scaling via  const is applicable.
The differences at line center, on the other hand, relate to different NLTE conditions in the upper photosphere/lower wind. For the unclumped model (with larger Ṁ), the apparent absorption results from a comparatively low source function, when the lower level, n = 4, becomes overpopulated compared to the upper one, n = 7. For the clumped models, with lower Ṁ in the still smooth transonic region, we find a similar effect as observed and modeled for Brα from weak-winded O-stars (Najarro et al. 2011). Also here, the lower level becomes underpopulated compared to the upper one in the transonic region, increasing the source function considerably, and resulting in a narrow emission peak close to line center. From test calculations with an analogous unclumped model with identical, low mass-loss rate as the clumped models analyzed here, we find a similar emission peak (now inside a broad photospheric absorption – no wind emission in this case). To summarize, the central emission observed in various lines is often not directly related to clumping, but occurs from specific NLTE effects in the upper photosphere when the line is formed in the transonic region, where its strength is highly dependent on mass-loss rate.
Finally, we note that the models presented in Figs. 13 and 14 show the overall strongest effects within all models of our coarse grid. In general, the supergiant models (hot, mid, and cool) display the most pronounced effects, whilst for giants we find smaller changes, becoming negligible for dwarf models.
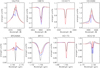 |
Fig. 14 Clumping effects for selected optical and NIR lines, for a subset of the models from Fig. 13 (same broadening parameters). Here, we compare the smooth model (in black) with the clumped models with decreased (scaled) mass-loss rate, in red for the Lineari10−025 law, and in blue for the Linear10−050 one. |
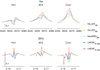 |
Fig. 15 Ηα and Brγ profiles for clumped supergiant models using different laws (see legend). Mass-loss rates have been scaled according to |

5.3 Which clumping law to use?
The calculation of a full model grid is a numerically expensive task. Thus, before analyzing the real spectra, we performed a series of tests using the coarse grid to evaluate the differences among the clumping laws provided in Table 7. Our aim is to minimize the computational effort when considering the full grid. Fig. 15 visualizes the changes in the Hα and Brγ profiles from the most sensitive supergiant models (see Table 8) when applying the different clumping laws.
5.3.1 H illier vs. Najarro
We first compare the Hillier200 with the Najarro200 clumping laws (orange and cyan in Fig. 15; see Table 7, Fig. 11 and Eqs. (4) and (5)). The main difference between both laws concerns the outer wind layers, after the maximum clumping factor in the Najarro2oo law has been reached. Thereafter, the clumping factor decreases toward unity (no clumping) in case of Najarro2oo, whilst it continues to increase asymptotically for Hillier’s law, reaching its maximum at the outer wind boundary.
In Fig. 15 we can see the impact of these two laws on Hα and Brγ. Indeed, the line profiles are very similar, and corresponding giant and dwarf models display even lower, almost invisible differences. This is not only true for the above two lines, but also for all H and He lines considered in the current study (not shown here for brevity). We conclude that there are no significant differences when using either the Hillier or the Najarro law for the analysis of optical and NIR H/He spectra of typical O-stars.
The simple reason for these almost identical line shapes is that the lines have already formed when both laws begin to deviate18. Both NIR and optical lines are formed below 2R*„ and the influence of the clumping law beyond this point is irrelevant, contrasted to wavelengths in the UV, far-IR or radio regimes where corresponding diagnostics might form at much larger radii for sufficiently strong mass loss. For the purpose of our present work, however, we can restrict ourselves to one of these clumping laws, which, because of its higher simplicity, is the one suggested by Hillier.
5.3.2 Hillier vs. Linear
We now compare the profiles obtained from the Hilher200 and the Linear10−050 laws (orange vs. blue in Fig. 15; see Table 7). The differences between both laws (see Fig. 11) are larger than those considered in the previous subsection, though in the inner layers, where most of the optical and NIR lines are formed, they are quite similar. It is thus not surprising that the largest differences between the resulting line profiles, shown in Fig. 15, are moderate. Again, the largest differences are found for the supergiant models, particularly at “cool” temperatures, whereas the giant and dwarf models display no significant differences at all.
The already small discrepancies between the (supergiant) line profiles might become even smaller when the clumping-law is altered. In the same figure, we also display the results for the Hillierioo and Linear10−025 laws (dashed orange vs. red), i.e., when using lower values for υ2 (in both cases, a factor of two lower than before). Now, the profile differences have almost vanished.
Summarizing, the prime differences between clumped and unclumped models mostly relate to the region of line formation and the overall clumping distribution, though not on the details of the specific clumping law (as long as there are enough parameters to describe the essential behavior).
Consequently, we conclude that for a first study, it is sufficient to consider only one family of clumping laws, and we decided to use the simple linear one.
5.4 The Linear law: Varying the parameters
In the following, we explore the changes introduced when modifying the parameters of such linear laws. We concentrate on the maximum clumping factor,  , and the point where this maximum is reached, υ2. We fix the point of clumping onset, υ1/υ∞ = 0.1, since this value has only a weak impact on the results as long as it is sufficiently small (0.1 … 0.2), but larger than the speed of sound to keep the photosphere unclumped. This latter condition might need to be relaxed in forthcoming studies, given the possibility that also the photosphere might be affected by inhomogeneities (e.g., Puls et al. 2006; Cantiello et al. 2009).
Figure 16 shows the four linear laws. For  , we consider two typical values,
  and 20. For
  , we choose two values for the point where this maximum is reached, namely υ2/υ∞ = 0.25 (Linear10−025) and 0.5 (Linear10−050), to simulate a rather steep and a moderate increase. To investigate the impact of clumping also in the outer wind (in addition to our considerations from Sect. 5.3.1) and in a systematic way, we proceed as follows. The υ2 values for the
  -laws (first two of the corresponding entries in Table 7) are chosen such that the specific clumping factors are identical to their
  -counterparts in the inner wind, until fcl= 10 is reached, and then continue to increase until their maximum value,
  . This results in υ2/υ∞ = 0.40 (Linear20−040) and 0.94 (Linear20−094), respectively.
Again, in Fig. 17 we only display the line profiles obtained for the supergiant models (with mass-loss rates scaled by the corresponding factor,  . At first we compare the Hα and Brγ profiles for the Linear10−025 and Linear20−040 laws (red vs. green), i.e., when the maximum clumping factor is reached in the inner wind layers, together with the profiles from the corresponding unclumped models (in black).
We see that the Hα profiles are similar for the unclumped and Linear10−025 models, whereas the profiles for the Linear20−040 law are somewhat different for the hot and mid-temperature supergiants, with less emission at lower velocities in the latter cases. This indicates that Hα is formed in a region where clumping fully compensates the lower mass-loss rate in Linear10−025 (i.e., beyond υ(r)/υ∞ = 0.25), but where this is not yet the case for the Linear20−040 law. We conclude that the differences between the two clumped models are due to the formation of Hα between υ(r)/υ∞ = 0.25.. .0.40.
Contrasted to this behavior, the Brγ profiles of both clumped models show a strong central emission, very similar to each other, and differing from the (partly blue-shifted) absorption of the unclumped wind. Again, however, all emission wings are identical. In agreement with our argumentation from Sect. 5.2, we conclude that the wind emission in Brγ is mostly formed in layers where fcl has already reached its maximum value (i.e., beyond υ(r)/υ∞ = 0.4). The more central absorption or emission is controlled by the behavior of level n = 4 vs. level n = 7 in the transonic regime, with absorption for larger and emission for lower mass loss rates. Obviously, also the redward Stark-absorption wing becomes visible for the lowest mass-loss rate (Linear20−040)
A second comparison refers to Linear10−050 (blue) vs. Linear20−094 (magenta). Here the clumping degree increases more slowly with radius than above, and Hα is majorly formed before the maximum clumping factor is reached. As a consequence, the decrease in mass-loss rate produces a lower wind emission in both clumped models. The effect is stronger for Linear20−094, because of the larger decrease in Ṁ. Now, also for Brγ the line wings deviate from each other, with decreasing impact of wind emission, and particularly Linear20−094 displays a line profile dominated by photospheric absorption. Consistent with our previous argumentation, the extent of the central emission remains fairly unaffected by the differences in clumping (though it depends on the actual mass-loss rate).
Comparing now all five models in parallel, we conclude that
the wind emission increases when the maximum clumping factor is reached in the inner wind layers. In such models, the lines are formed in regions when clumping already fully compensates the decrease in mass-loss rate.
the maximum value
 is of less relevance whenever the clumping factor increases over an extended region. What actually matters is the value of the clumping factor in the line-forming region, together with the global mass-loss rate.
For the rest of our current study, and given its exploratory character, we will restrict our analysis to the linear clumping description. On the one hand, we will use the same Linear10−025 and Linear10−050 laws considered above. The two laws with  as discussed in this section, however, are “only” linear extensions of these laws toward larger radii, studied to investigate potential effects from a highly clumped outermost wind. Since we argued that the decisive quantity is the value of the clumping factor in the line-forming region (often dominated by the lower and intermediate wind), in the next two sections we will use two alternative
  -laws (see below). In this way, we are able to simulate a larger diversity of potential line shapes and physical conditions, although this is still a severe simplification. For example, the most recent optical + UV analysis by Hawcroft et al. (2023) indicates a (maximum) clumping factor that increases with Teff, and in future work a more extended parameter range (with respect to
  and υ2)needs to be examined also in the NIR.
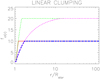 |
Fig. 16 Four different linear clumping laws considered in our study, with the clumping factor as a function of stellar radius (in units of the photospheric radius, R*, with β = 0.8). Red solid line: Linear10−025; dashed blue line: Linear10−050; dashed green line: Linear20−040; dashed magenta line: Linear20−094. See text. |
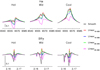 |
Fig. 17 Hα and Brγ profiles for the different clumping laws as indicated, including smooth winds. Mass-loss rates of clumped models have been scaled according to |

Range of parameters used to produce the grids of synthetic profiles for clumped winds with different clumping stratifications.
Stellar parameters obtained from the optical analysis using the Linear10−025 clumping law.
6 FASTWIND clumping grid
For a (re)analysis of our optical and NIR observations using clumped models, we have calculated a full model grid and restricted ourselves to four clumping laws in total: the Linear025 laws, with [υ1/υ∞, υ2/υ∞] = [0.1, 0.25], and the Linear050 laws with [υ1/υ∞, υ2/υ∞] = [0.1, 0.50] (see Table 7), applying  and
and  in both cases. Table 9 shows the parameter ranges for the grids.
6.1 Analysis with the Linear10−025 clumping law
The results of the analyses with the iacob_gbat tool for the Linear10−025 law can be found in Tables 10 (for the optical spectrum) and 11 (for the near infrared). The corresponding fits are displayed in Fig. 18. Moreover, in Fig. 19 we compare, for all supergiants of our sample, the spectral fits for selected optical and NIR lines for all clumping laws discussed in the following (including the homogeneous wind).
From both figures, we can see that the fits have a similar global quality as those for the unclumped models, but there are specific differences worth mentioning. We stress already here that the parameters of the globally best-fitting clumped and unclumped models are different; thus, the changes will not only be due to clumping, but also due to the parameter changes produced by it.
For the hot supergiants we observe two major changes in the optical. The first one is a distinct improvement in the fit of Hα (see Fig. 19, red vs. black profiles). A similar improvement is not seen for Hβ (see Figs. 5 and 18), that fits slightly better in the red wing, but clearly worse in the core, due to less core-filling in the inner layers19. Upper Balmer lines remain unaffected.
The second one is a deeper absorption in He II λ4541 that improves the fit. However, the good fit for He II λ4686 without clumping slightly deteriorates, again because of less emission in the forming layers. The cool supergiants do not present the same global improvement in Hα, but there is a partial improvement. Moreover, the He lines, particularly He II λ4686, also improve slightly, including a correction in the apparent shift in the line core between the observations and the unclumped profile. This differential behavior in He II λ4686 in (dense) hot and cool winds is expected because of the change in the dominant ionization stage of helium, as explained earlier, and strengthens our warning about the use of a single clumping law for all stars. We conclude that the Linear10−025 improves Hα for the hot supergiants and improves the agreement between Hα and He II λ4686 for the cool supergiants (but without reaching a good fit).
In the NIR, the fits to the spectra of the hot supergiant HD 15570 and the cool one HD 210809 improve considerably for Brγ. The rest of the line fits also improve slightly in these stars, except for He II λ2.18 μm that deteriorates significantly in HD 15570. Unlike for the optical spectra, we now find changes also in the line fits for giants and dwarfs. Finally, there is a remarkably bad fit to the He I λ 1.70 μm line in the cool supergiants HD 30614 and HD 210809, both in the models with and without clumping. Thus, in the NIR the major improvement of using the Linear10−025 law regards the Brγ line of some supergiants.
6.2 Analysis with the Linear10−050 clumping law
The results from the analysis of our stellar sample with the Linear10−050 law (that reaches the maximum clumping factor,  , further out than Linear10−025 from the previous section) can be found in Tables A.1 (for the optical spectrum) and A.2 (for the infrared). The corresponding best fits can be inspected in Fig. A.1. For a comparison of supergiant fits, we refer again to Fig. 19.
As for the Linear10−025 law, there is an improvement in the fit of Hα from the hot supergiants, that in fact show an excellent agreement in all optical lines. The cool supergiants HD 209975 and HD 30614 do not change significantly. But now we see a much better fit for Hα for the cool supergiant HD 210809, indicating that the clumping distribution is more extended in this star than represented by Linear10−025. For the rest of the sample (giants and dwarfs), we obtain similarly good fits with the Linear10−050 law as with an homogeneous wind model.
In the NIR, the fits to Brγ of HD 15570 and HD 210809 improve again significantly compared to the unclumped models. For all stars, the fits to Brγ and other H and He NIR lines (except for He II λ2.18 μm) improve slightly. An exception is He I λ1.70 μm in the hot dwarf HD 46223, where the insufficient quality is a consequence of the hotter temperature resulting from the global fit parameters when using Linear10−050. This line remains also very badly fitted in the cool supergiants HD 30614 and HD 210809. Summarizing and overall, the global line profile fits in the NIR do not seem to be strongly affected by the different clumping distributions when using  .
.
6.3 Analysis with the  clumping laws
In this subsection, we analyze whether a higher (maximum) clumping factor enables an improvement in the fit quality for our sample. We compare here the fits of Linear20−025 and Linear20−050 with their corresponding counterparts, Linear10−025 and Linear10−050 as described above. The fits with these laws can be seen in Figs. A.2–A.3 and again in Fig. 19 for the supergiants, and the derived parameters in Tables A.3–A.6
The changes when using the Linear20−025 law as compared to the Linear10−025 are mostly minor. The most affected line is of course Hα, with significant changes seen in the supergiants, reflecting their higher sensitivity to clumping: the fit improves for HD 210809 and worsens for HD 14947. HD 30614 shows significant changes, improving the fit in the emission peak and the red wing but worsening it in the blue wing. HD 15570 does not show changes in Hα, but the blue wings of the other Balmer lines are slightly less well reproduced with the Linear20−025 law. Only the supergiant HD 209975 remains almost unchanged. The optical wind lines of HD 14947, HD 30614 and HD 210809 are the most sensitive to changes in the clumping law.
In the NIR there are few changes. The Brγ line of dwarfs and giants is marginally affected in many cases. Other lines do not change, except He I 1.70 μm in HD 203064 and in HD 217086, with an improvement in both cases.
For the supergiants, the Brγ line of HD 15570 deteriorates when using Linear20−025. For HD 14947, the fit to Br10 and He I 1.70 μm improves, but Br11 (not displayed) and the He II 2.18 μm become worse. The cool supergiants are not significantly affected.
When comparing the profile fits in the optical using the laws with larger υ2, Linear20−050 vs. Linear10−050, we also find only small changes. Hα is the most affected line, usually with more core absorption (or less emission). Concentrating on the super-giants, there is a clearly worse fit in HD 14947 and HD 210809 when using the Linear20−050 law. HD 15570 and HD 30614 show an improvement in the red and a worsening in the blue wing, with the former object showing also an improvement in the emission peak. Other lines are not significantly affected.
In the NIR, Brγ shows small changes for nearly all stars, The weak changes for the supergiants HD 15570 and HD 14947 are now similar to those in the dwarfs HD 46223 and HD 46150. The other Brackett lines display a mixed behavior, as do the He lines. Particularly, He II 1.69 μm (not shown), which is usually not affected, changes in HD 210809, where it shows a better fit with the Linear20−050 law. Overall, this time a larger number of stars present changes, but these are small compared to differences with homogeneous-wind profiles.
Taken all our findings together, we conclude that, globally, clumping has sometimes positive impact on the fits to Hα, Brγ and He II λ4686 in supergiants. The impact may depend on the particular clumping law chosen, although the differences between the clumping laws explored are small (or even not present for most lines), and they do not offer a clear indication of which one better represents the distribution of inhomogeneities in the stellar wind. While for most cases the  linear laws shows a better fit, we also find many counter-examples. This indicates that more work is needed to determine the actual clumping distribution in these stars.
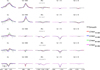 |
Fig. 19 Comparison of spectral fits to selected optical and NIR lines from the supergiants of our sample. Observations: gray; synthetic profiles from best-fitting models without (black) and with clumping using various clumping laws (for color-coding, see legend). The stellar and wind parameters of the individual best-fitting models are provided in Tables 5, 10, A.1, A.3, A.5 for the optical lines, and in Tables 6, 11, A.2, A.4, A.6 for the NIR lines. |
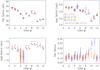 |
Fig. 20 Comparison of effective temperatures (upper left), gravity (upper right), log Q (lower left) and YHe (lower right) obtained from the optical spectra with the different clumping laws considered in this work. The abscissa gives the identification number of the star. For each star, the results from the different clumping laws (including the smooth wind model) are plotted (see legend). Corresponding entries (except for the smooth wind results) have been slightly displaced on the abscissa. Stars are ordered as in Table 1: #1: HD 46223; #2: HD 15629; #3: HD 46150; #4: HD 217086; #5: HD 149757; #6: HD 190864; #7: HD 203064; #8: HD 15570; #9: HD 14947; #10: HD30614; #11: HD 210809; #12: HD 209975. Rapid rotators are stars #4, #5, and #7. |
7 Discussion of results: Impact of clumping laws on optical and NIR anaylses
We are now able to compare the derived parameters, to see whether the introduction of the different clumping laws modifies our determinations or improves the agreement between optical and infrared stellar parameters. We will not consider microturbulence and β exponent, as they remain basically unrestricted in our analyses.
We begin by comparing the results obtained from the optical analysis for the effective temperature. Figure 20 (upper left) shows the comparison for all five clumping laws (homogeneous wind and four linear laws, as discussed above). We see that the values for all stars are fully consistent for almost all laws within the uncertainties. The only exception is for the υ2/υ∞ = 0.5 laws in HD 15570, that give a slightly lower Teff. Thus, the temperature determination in the optical is not significantly affected by the presence of clumping or by differences in the clumping distribution (as far as it concerns the laws used in this work).
The comparison of the gravities obtained from the optical analyses is presented in Fig. 20 (upper right). The difference between dwarfs and giants on the one side, and supergiants on the other, is obvious. For giants and dwarfs we obtain similar values of log g, independent of the clumping laws used (including the absence of clumping). Also the uncertainties are similar ( but the uncertainties are significantly larger for the fast rotators, as could be expected). However, and except for HD 209975, the situation is different for the supergiants. Here, the unclumped values are always larger than the clumped ones, and depend on the specific clumping law; in the cases of HD 15570 and HD 14947, quite significantly. This is a consequence of the lower mass-loss rate implied by clumping that renders the red wings of the Balmer lines and the core of He I lines deeper. A lower gravity (sometimes accompanied by a lower Teff) compensates for this effect.
We compare the results for the wind parameter log Q in Fig. 20 (lower left). As we have used the same wind terminal velocity and stellar radius, this quantity is equivalent to the mass-loss rate. We see that the unclumped models give higher mass-loss rates, and that the correction increases with the maximum clumping factor, as expected. The mean differences in log Q are somewhat below the “nominal” values of 0.5 ( ) and 0.65 dex (
 ), with actual differences of 0.39 ± 0.05 and 0.33 ± 0.05 for the
  laws, and 0.54 ± 0.05 and 0.48 ± 0.08 for the
  laws, indicating that the diagnostic lines form before the maximum clumping factor is reached.
The helium abundances are compared in Fig. 20 (lower right). All determinations (unclumped and clumped models) result in equal values within typical uncertainties, again except for the supergiants where the dispersion is larger and lower limits become frequent. Although most values are still consistent within their uncertainties, in two cases they are not. The largest discrepancy is found for the cool and bright supergiant HD 30614, which gives a higher He abundance when clumping is included. This higher He abundance is the result of a better fit to the He lines after the changes produced in Hα. The second strong discrepancy is seen in HD 210809, where the He abundance obtained with the Linear20–050 law is much larger than any other value
Regarding an optical diagnostics, we conclude that only specific stellar parameters might be affected by different assumptions on the clumping conditions: gravities determined for supergiants, helium abundances in peculiar cases like HD 30614, and wind strengths (beyond their explicit dependence on  ) for supergiants and rapidly rotating dwarfs.
The temperature values obtained from the analysis in the NIR are, in general, again consistent when introducing clumping (Fig. 21, upper left). The exception is the behavior of the hottest star, HD 46223. Here, the models with υ2 = 0.5υ∞ give a temperature much higher than those with υ2 = 0.25υ∞ and the homogeneous wind models. The high temperature produces a bad fit to the He I lines compensated by a slightly better fit to all other lines. This is then due to the lack of sufficient constraints for such a case. Giving more weight to He I 1.70 μm (as the only diagnostics strongly constraining the ionization balance) would reduce the discrepancy, as we have convinced ourselves.
The gravity values show a large dispersion, even for dwarfs, though they are all consistent within their 1-σ uncertainties (which are sometimes quite large, see Fig. 21, upper right). This is a consequence of the poorer fits to the Brackett lines (see Sect. 3.2.2), together with a more limited number of diagnostics.
This combination produces also a complicate behavior for the log Q wind parameter. The general behavior is similar to the optical case, namely the log Q values obtained with clumping are lower than the ones derived from a homogeneous wind model, though with a larger number of upper limits and larger error bars.
This is particularly obvious for the rapidly rotating dwarfs. In a few peculiar cases we find clumped values that are larger than the unclumped ones. This happens for the Linear10–050 law in HD 15629, HD 14947 and HD 210809 (in the latter star, also for Linear10–025 and Linear20–050). Though in all cases the values are consistent within the uncertainties (and even consistent with the expected behavior), the apparent problems result from the loss of information produced by poorer fits. In fact, only for supergiants, an actual determination of log Q for all clumping laws is possible (except for HD 209975 for which only upper limits could be derived). With all these uncertainties, the He abundance remains nearly unconstrained.
The conclusion is that the impact of clumping on the derived parameters is similar in the NIR and in the optical. The NIR shows a larger scatter in the global trends and more upper/lower limits. A second conclusion is that, compared to the optical, the H and K band lines in the NIR do not offer us a clear advantage to characterize the clumping. However, this conclusion depends (until further evidence) on our assumptions about the shape of the clumping law and its parameters; the impact on the different lines will depend on the behavior of the clumping law in the line formation region.
We are now in a position to finally address the question whether the introduction of clumping improves the agreement between the optical and the infrared parameter determinations, compared to the assumption of a homogeneous wind. An improvement in this comparison would also provide additional hints on the most appropriate clumping law to be adopted.
Figure 22, upper left, shows the comparison of Teff determinations in the optical and the infrared for the different clumping conditions explored in our experiment. Most stars have optical and NIR Teff determinations consistent within the uncertainties for all explored laws. However, there are also certain outliers. The most important are the supergiants HD 14947 and HD 210809, where the large discrepancies can be traced back to their shallow Br10 and Br11 lines (shallow compared to those from HD 15570 and HD 209975, which occupy similar parameter ranges, respectively; see Fig. 23). As shown by Repolust et al. (2005, their Fig. 1) for models with low wind densities, the cores of Br10/11 strongly react to changes in gravity (an alteration of gravity mostly affects the depth of the line cores, contrasted to the behavior of the Balmer lines), where the depth decreases with increasing log g. For our objects with substantial mass-loss rates, shallow Br10/11 lines can be only reproduced when in addition to a high gravity also the effective temperatures and mass-loss rates lie in a certain range. In particular, the mass-loss rates must not be too large, since otherwise Br10/11 would become severely asymmetric, which is not observed. Taken all these constraints together, a fit of the shallow Br10/11 lines pushes the gravity and the temperature toward values higher than derived from the optical, with the higher temperature also required for compensating for the shift of the Helium ionization equilibrium and the strong reaction of the Hell lines (see again Fig. 1 in Repolust et al. 2005). The somewhat lower mass-loss rate (required to fit Br10/11) also prevents Brγ from entering into emission in the hot supergiant HD 14947, whereas the cooler supergiant HD 210809 still partly fills its Brγ. All these problems are, for example, not present in HD 15570, because here the Br10/11 lines have a “reasonable” depth allowing for these lines to be fit at parameters that are mostly compatible with the optical results (but see below). Whether these problems are related to the model calculation or to the reduction of NIR spectra remains an open question. Anyhow, and apart from a few individual cases that do not allow a generalization, no clumping law (including the homogeneous wind) shows a better agreement between the effective temperatures derived from the optical and the NIR than the other laws.
The gravity differences reflect the larger scatter obtained for this parameter in the NIR. Most stars are again close to the zero-difference line, again with the exceptions of the supergiants HD 14947 and HD 210809 already discussed above.
The difficulties to simultaneously fit the He I and Hell lines in HD 210809 could point to a higher He abundance than considered in our grid (for this star and also for HD 14947, we obtain mostly lower limits for the He abundance; however, this is not the case in the optical, cf. Figs. 20 and 21).
The optical/NIR differences in log Q show again a clear pattern: for dwarfs, the large uncertainties dominate, whereas for supergiants, results are consistent (although HD 209975 is here an exception, with a very low log Q value derived in the NIR). The He abundances also scatter around the zero-line, with large uncertainties and numerous limits reflecting mainly the behavior in the NIR. Nevertheless, there are no obvious outliers, except for the unclumped values for HD 14947 and HD 210809, both suffering from the mass-loss dependence of Br10/11 (see above). Interestingly, however, the log Q values from the optical and the NIR agree when clumping is considered.
Finally, when combining the optical and near NIR lines in a joint analysis, the results are dominated by the fits to the optical lines. This is a consequence of the larger number of optical lines and the better fit quality in this wavelength range.
The most important conclusion from our comparison is that whatever the differences between the optical and the NIR, the inclusion of the different clumping laws as explored in our work, does not contribute to a globally better agreement between the parameters derived from either wavelength range. For example, the average value of the differences for Teff is −0.1 ± 2.4 kK for the unclumped values, and ranges from −0.7 ± 2.5 kK to +1.6 ± 2.9 kK for the various clumping laws, with no star showing a clearly better agreement when introducing clumping. Such a better agreement would require either even higher than current quality NIR observation with more diagnostic spectral lines or different types of clumping laws.
Alternatively, it is also possible that clumping has a different behavior in different stars, not only because of spectral type (cf. Hawcroft et al. 2023, as already discussed in Sect. 5) and luminosity class, but also because of additional differences like pulsations and wind variability (not to mention ocassional mass ejections or local magnetic fields). This is particularly relevant for the two most extreme outliers, HD 14974 and HD 210809 (the latter well known for its notorious wind variability, see Markova et al. 2005), where the discrepancy of the optical and NIR results is rooted in the weak Br10 and Br11 lines (see above). But also for the other objects analyzed here we are using single epoch observations, with the optical and NIR spectra taken at different times, so that line profile variability may play a role in the differences.
Besides the above possibility that the clumping conditions in both stars deviate strongly from our current assumptions (particularly regarding the lower wind), we cannot neglect the possibility that the (complex) NIR data reduction (see appendix in Hanson et al. 1996 and Hanson et al. 2005) is free from any problems, and that the actual line profiles might be stronger than adopted here (see also Repolust et al. 2005). Another possibility regards the question of (in)accurate hydrogen collision cross sections. Using the most up-to-date, ab initio values from Przybilla & Butler (2004) instead of the default values following Giovanardi et al. (1987) implemented into FASTWIND only exacerbates the problem though, since the corresponding Brackett lines become even stronger then (see Fig. 15 in Repolust et al. 2005).
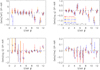 |
Fig. 22 Same as Fig. 20, but for the differences between optical and NIR determinations. Temperature differences are given in kK, and differences in gravity and log Q in dex. |
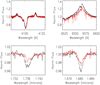 |
Fig. 23 Comparison of the observed Balmer and Brackett lines in HD 15570 (black) and HD 14947 (red). Whereas the Balmer lines are very similar, the Brackett lines Br10 and Br11 are much shallower in HD 14947. See text. |
8 Conclusions
We have carried out a determination of stellar parameters and a study of the clumping effects in the optical and the NIR extending the automatic methods developed in our group (see Sects. 3.1 and 3.2). Our objectives were (a) to check whether we can obtain stellar parameters from the infrared, with the same or comparable accuracy to those in the optical; (b) to check whether the parameters obtained were consistent; (c) to study the effects of clumping in the determination of stellar parameters; and (d) to check whether clumping improves the agreement between the infrared and the optical parameters. To these ends, we have extended the automatic tools to include the NIR spectra.
When analyzing the observed spectra in the optical and NIR with unclumped models, we reached the following conclusions:
In many cases, test calculations revealed a problematic behavior of the Br lines. It was not possible to fit all of the observed lines simultaneously. We decided not to use the highest available line, Br12, since this line deviates the most. However, Br10/11 also frequently presented problems to achieve a consistent fit. We conclude that the Br lines need to be studied in more detail in the future.
Globally, the quality of the fits to the optical spectrum is excellent. The only problems appear for supergiants, mostly related to Hα and sometimes to He II 4686, with the fits improving with decreasing luminosity class. In the infrared, again the best fits are for dwarfs, and problems are concentrated in Brγ (and sometimes the other Br lines), which in some supergiants appear in emission, while models still predict absorption. Helium lines in the NIR present a variety of fitting problems, which might also be related to a lower number of available lines.
Both the optical and the NIR analyses without clumping show a good agreement with previous similar studies in the literature (Holgado et al. 2018; Repolust et al. 2005).
When comparing the results in the optical and the NIR derived from unclumped models, we find that:
the rotational velocities derived from the NIR He I λ1.70 μm line agree in most cases well with those derived with a higher accuracy from the optical metal lines (with the known limitations due to the larger intrinsic (Stark-) broadening).
There is a good agreement between the parameters derived in the optical and the NIR, with some deviating individual cases (particularly HD 14947 and HD 210809). The uncertainties in the NIR are larger, mostly due to poorer fits and, to a lesser extent, to the low number of diagnostic lines. Helium abundances from the NIR frequently show upper and lower limits, indicating a lack of sensitivity to this parameter.
We could thus derive stellar parameters from the infrared with an almost similar accuracy to the optical. The uncertainties are larger for the reasons given in the item above.
We then explored the effects of clumping using different clumping laws. We considered a Najarro-type law, two Hillier-type laws, and up to six different linear laws. We compared the behavior of the different laws and their impact on the line profiles. The main conclusions are:
Using a coarse model grid, we show that clumping only had significant effects on the synthetic spectra of supergiants once we accounted for the corresponding mass-loss scaling relations as a function of the (maximum) clumping factor,
 (or minimum volume filling factor). For giant stars, effects are very modest and they are negligible for dwarfs.
We find only small differences in the synthetic wind lines based on the various clumping laws, which indicates that these lines are formed in layers where the differences between these laws are not critical. Differences can also be present in the absorption cores of lines that are mainly formed in the photosphere, because of a different refilling by wind emission when the mass-loss rates have been appropriately scaled as a function of
 .
.Together with
 , the second relevant parameter is the extent of the region where the clumping factor increases until that maximum is reached. Both quantities define the distribution of the clumping factor in the line formation region.
Primary differences between clumped and unclumped models are related to the modified density structure in the line-forming region. The different laws explored in this work do not trigger significant differences in the corresponding spectra (after scaling the mass-loss rates), since they all share the same general behavior in that region: clumping is adopted to start close to (but above) the photosphere, and increases more or less rapidly to a maximum. The wind emission increases when
 is reached in the inner and intermediate wind layers, and the behavior of the clumping laws in the outer wind does not affect the line formation region relevant for this work.
Because of the rather weak differences raised by the three kinds of clumping laws investigated here, an analysis with the linear clumping law is sufficient for the exploratory character of this work, because if its conceptual simplicity.
The central emission seen in some lines (either on top of an emission or absorption profile) is primarily related to a NLTE effect in the transonic region, affecting the occupation numbers of the upper and/or lower atomic levels. It is thus (almost) independent of the specific clumping stratification, though it depends on the actual mass-loss rate.
Subsequent to the above study of principal effects, we compared the fits obtained from four model grids with different linear clumping laws, discriminated by different combinations in υ2/υ∞(= 0.25, 0.50) and  (= 10, 20). We find that:
Clumping usually has positive effects for the fit of Hα, He II 4686, and Brγ in supergiants (particularly in hot supergiants), sometimes improving the consistency between the former two optical lines (for cool supergiants). However, there is a trend to worse fits in He II 2.18 μm.
The laws with υ2/υ∞= 0.50 imply a larger number of changes when comparing the fits for the two
 values. This is a consequence of a more pronounced variation of the clumping factor along the line-forming regions.
The actual impact on the line profiles depends on the specific clumping law, although differences between the laws are small in many cases. We note, however, that the best fit to individual lines in a given star may be reached with different clumping laws, pointing to a potentially more complex distribution than the one considered here.
We finally compared the stellar parameters obtained with the different clumping laws, to see whether the parameters change significantly and whether the agreement between optical and NIR parameters is better for a particular law. Our main conclusions are:
In the optical, only log g and log Q in supergiants are affected by the use of different clumping laws (except for particular cases, such as YHe in HD 30614 or the wind strength in rapidly rotating dwarfs).
In the NIR, the Br lines are often responsible for problems in accurately determining log g and consequently log Q.
As in the unclumped case, we obtain similar stellar parameters in the optical and the NIR, although with a larger scatter and more upper and lower limits in the latter. HD 14947 and HD 210809 (both supergiants) are outliers in this respect, mainly due to problems with Br lines.
In our analysis, the H and K bands did not offer a clear advantage over the optical wavelengths to characterize clumping.
Regarding the consistency between optical and NIR parameters, none of the specific clumping laws displayed a better global agreement nor do clumped models agree better than unclumped ones. Results for log Q are mostly consistent (the larger
 , the lower the derived wind-strength), particularly for strong winds (supergiants).
Taking everything together, we reach the somewhat disappointing conclusions that the inclusion of the NIR ( as done here) still does not allow actual mass-loss rates to be derived. There is still the dichotomy between Ṁ and  , which might be only broken by including lines that react in a different way than typical recombination lines such as Hα. However, including UV P Cygni lines (when available) is difficult, because of the impact of X-ray emission, optically thick clumping, and saturation, though first analyses in such a respect have already been undertaken (Hawcroft et al. 2021, 2023; Brands et al. 2022). One might question whether an analysis of the predicted central emission in, for example, Brγ might help, since this should depend on the actual Ṁ alone, in the same spirit as Brα for weak-winded stars (Najarro et al. 2011). Unfortunately, the predicted emission peak is quite narrow and small, much smaller than in the case of Brα, and most likely not useful for Ṁ determinations. Finally, at least for late-type O supergiants and early-type B supergiants, constraints on the clumping properties and actual mass-loss rates might be feasible, because of the different behavior of Hα and He II 4686 (Kudritzki et al. 2006; Holgado et al. 2018).
Our study indicates that future work requires some improvement in the treatment of the Br lines. We need to analyze a larger sample of stars considering a wavelength range as large as possible to find patterns among them that can be used to characterize the clumping laws. The positive view is that our models give consistent results between the optical and infrared wavelength regions, that the use of different clumping laws does not result in significant differences in the derived stellar parameters (although the use of a common clumping law may introduce some extra uncertainty for individual cases), and that the infrared contains enough information for a spectroscopic analysis with an accuracy that is quite similar to the optical.
Acknowledgements
This research has been supported by the Generalitat Valenciana under grant PROMETEO/2019/041 and Spanish Ministerio de Ciencia e Innovacion (MCIN) with funding from the European Union NextGenerationEU and Generalitat Valenciana in the call Programa de Planes Complementarios de I+D+i (PRTR 2022), (Project HIAMAS, reference ASFAE/2022/017) and also MCIN through the Spanish State Research Agency through grants PID2021-122397NB-C21/C22 and the Severo Ochoa Programme 2020-2023 (CEX2019-000920-S) (MICINN/AEI/FEDER, UE).
Appendix A Additional tables and figures
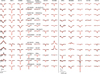 |
Fig. A.1 Spectral fits for selected optical (left) and NIR (right) lines using the clumping law Linear10–050. Observations are shown in black, and best fit model profiles in red. We stress that the individual model parameters for the best fitting optical and NIR profiles differ (to various extent) since the analyses have been performed separately for both ranges (cf. Table A.1 vs. Table A.2). The horizontal bar gives the wavelength scale for each range, and the scale of the ordinate axis is given by the vertical bar (at the bottom of the Hα column for the optical range, and at the bottom of the Br10 column for the NIR.) |
References
- Abbott, R., Abbott, T. D., Acernese, F., et al. 2022, Physical Review X, 13, 1 [Google Scholar]
- Asplund, M., Grevesse, N., Sauval, A. J., & Scott, P. 2009, ARA&A, 47, 481 [NASA ADS] [CrossRef] [Google Scholar]
- Bestenlehner, J. M., Gräfener, G., Vink, J. S., et al. 2014, A&A, 570, A38 [NASA ADS] [CrossRef] [EDP Sciences] [Google Scholar]
- Bouret, J. C., Lanz, T., Hillier, D. J., et al. 2003, ApJ, 595, 1182 [NASA ADS] [CrossRef] [Google Scholar]
- Bouret, J. C., Hillier, D. J., Lanz, T., & Fullerton, A. W. 2012, A&A, 544, A67 [NASA ADS] [CrossRef] [EDP Sciences] [Google Scholar]
- Brands, S. A., de Koter, A., Bestenlehner, J. M., et al. 2022, A&A, 663, A36 [Google Scholar]
- Cantiello, M., Langer, N., Brott, I., et al. 2009, A&A, 499, 279 [NASA ADS] [CrossRef] [EDP Sciences] [Google Scholar]
- Castor, J. I., Abbott, D. C., & Klein, R. I. 1975, ApJ, 195, 157 [Google Scholar]
- Chiosi, C., & Maeder, A. 1986, ARA&A, 24, 329 [NASA ADS] [CrossRef] [Google Scholar]
- Crowther, P. A., Hillier, D. J., Evans, C. J., et al. 2002, ApJ, 579, 774 [Google Scholar]
- de Mink, S. E., Langer, N., Izzard, R. G., Sana, H., & de Koter, A. 2013, ApJ, 764, 166 [Google Scholar]
- Ekström, S., Georgy, C., Eggenberger, P., et al. 2012, A&A, 537, A146 [Google Scholar]
- Feldmeier, A. 1995, A&A, 299, 523 [NASA ADS] [Google Scholar]
- Fullerton, A. W., Massa, D. L., & Prinja, R. K. 2006, ApJ, 637, 1025 [Google Scholar]
- Giovanardi, C., Natta, A., & Palla, F. 1987, A&AS, 70, 269 [NASA ADS] [Google Scholar]
- Götberg, Y., de Mink, S. E., Groh, J. H., et al. 2018, A&A, 615, A78 [NASA ADS] [CrossRef] [EDP Sciences] [Google Scholar]
- Hanson, M. M., Conti, P. S., & Rieke, M. J. 1996, ApJS, 107, 281 [NASA ADS] [CrossRef] [Google Scholar]
- Hanson, M. M., Kudritzki, R.-P., Kenworthy, M. A., Puls, J., & Tokunaga, A. T. 2005, ApJS, 161, 154 [Google Scholar]
- Hawcroft, C., Sana, H., Mahy, L., et al. 2021, A&A, 655, A67 [NASA ADS] [CrossRef] [EDP Sciences] [Google Scholar]
- Hawcroft, C., Sana, H., Mahy, L., et al. 2023, A&A, in press, https://doi.org/18.1851/8884-6361/282245588 [NASA ADS] [CrossRef] [EDP Sciences] [Google Scholar]
- Hillier, D. J. 1991, A&A, 247, 455 [NASA ADS] [Google Scholar]
- Hillier, D. J., & Miller, D. L. 1998, ApJ, 496, 407 [NASA ADS] [CrossRef] [Google Scholar]
- Hillier, D. J., Lanz, T., Heap, S. R., et al. 2003, ApJ, 588, 1039 [Google Scholar]
- Holgado, G. 2019, PhD thesis, Universidad de La Laguna, Spain [Google Scholar]
- Holgado, G., Simón-Díaz, S., Barbá, R. H., et al. 2018, A&A, 613, A65 [NASA ADS] [CrossRef] [EDP Sciences] [Google Scholar]
- Holgado, G., Simón-Díaz, S., Herrero, A., & Barbá, R. H. 2022, A&A, 665, A150 [NASA ADS] [CrossRef] [EDP Sciences] [Google Scholar]
- Kudritzki, R.-P., & Puls, J. 2000, ARA&A, 38, 613 [Google Scholar]
- Kudritzki, R. P., Urbaneja, M. A., & Puls, J. 2006, IAU Symp., 234, 119 [CrossRef] [Google Scholar]
- Langer, N. 2012, ARA&A, 50, 107 [CrossRef] [Google Scholar]
- Langer, N., Schürmann, C., Stoll, K., et al. 2020, A&A, 638, A39 [NASA ADS] [CrossRef] [EDP Sciences] [Google Scholar]
- Lucy, L. B., & Solomon, P. M. 1970, ApJ, 159, 879 [Google Scholar]
- Maz Apellániz, J., Sota, A., Morrell, N. I., et al. 2013, in Massive Stars: from Alpha to Omega (Berlin: Springer), 198 [Google Scholar]
- Markova, N., & Puls, J. 2008, A&A, 478, 823 [NASA ADS] [CrossRef] [EDP Sciences] [Google Scholar]
- Markova, N., Puls, J., Scuderi, S., & Markov, H. 2005, A&A, 440, 1133 [NASA ADS] [CrossRef] [EDP Sciences] [Google Scholar]
- Menon, A., Langer, N., de Mink, S. E., et al. 2021, MNRAS, 507, 5013 [NASA ADS] [CrossRef] [Google Scholar]
- Najarro, F., Figer, D. F., Hillier, D. J., Geballe, T. R., & Kudritzki, R. P. 2009, ApJ, 691, 1816 [NASA ADS] [CrossRef] [Google Scholar]
- Najarro, F., Hanson, M. M., & Puls, J. 2011, A&A, 535, A32 [NASA ADS] [CrossRef] [EDP Sciences] [Google Scholar]
- Oskinova, L. M., Hamann, W.-R., & Feldmeier, A. 2007, A&A, 476, 1331 [NASA ADS] [CrossRef] [EDP Sciences] [Google Scholar]
- Owocki, S. P. 1991, NATO ASI Ser. C, 341, 235 [NASA ADS] [Google Scholar]
- Owocki, S. P. 2008, in Clumping in Hot-Star Winds, ed. W.-R. Hamann, L. M. Oskinova, & A. Feldmeier, 121 [Google Scholar]
- Owocki, S. P., & Rybicki, G. B. 1984, ApJ, 284, 337 [Google Scholar]
- Owocki, S. P., Castor, J. I., & Rybicki, G. B. 1988, ApJ, 335, 914 [NASA ADS] [CrossRef] [Google Scholar]
- Owocki, S. P., Gayley, K. G., & Shaviv, N. J. 2004, ApJ, 616, 525 [NASA ADS] [CrossRef] [Google Scholar]
- Pauldrach, A., Puls, J., & Kudritzki, R. P. 1986, A&A, 164, 86 [NASA ADS] [Google Scholar]
- Petrenz, P., & Puls, J. 1996, A&A, 312, 195 [NASA ADS] [Google Scholar]
- Przybilla, N., & Butler, K. 2004, ApJ, 609, 1181 [NASA ADS] [CrossRef] [Google Scholar]
- Puls, J., Kudritzki, R. P., Herrero, A., et al. 1996, A&A, 305, 171 [Google Scholar]
- Puls, J., Urbaneja, M. A., Venero, R., et al. 2005, A&A, 435, 669 [NASA ADS] [CrossRef] [EDP Sciences] [Google Scholar]
- Puls, J., Markova, N., Scuderi, S., et al. 2006, A&A, 454, 625 [NASA ADS] [CrossRef] [EDP Sciences] [Google Scholar]
- Puls, J., Vink, J. S., & Najarro, F. 2008, A&ARV, 16, 209 [NASA ADS] [CrossRef] [Google Scholar]
- Ramírez-Agudelo, O. H., Simón-Díaz, S., Sana, H., et al. 2013, A&A, 560, A29 [NASA ADS] [CrossRef] [EDP Sciences] [Google Scholar]
- Renzo, M., Zapartas, E., de Mink, S. E., et al. 2019, A&A, 624, A66 [NASA ADS] [CrossRef] [EDP Sciences] [Google Scholar]
- Repolust, T., Puls, J., Hanson, M. M., Kudritzki, R.-P., & Mokiem, M. R. 2005, A&A, 440, 261 [NASA ADS] [CrossRef] [EDP Sciences] [Google Scholar]
- Rubio-Díez, M. M., Sundqvist, J. O., Najarro, F., et al. 2022, A&A, 658, A61 [NASA ADS] [CrossRef] [EDP Sciences] [Google Scholar]
- Runacres, M. C., & Owocki, S. P. 2002, A&A, 381, 1015 [NASA ADS] [CrossRef] [EDP Sciences] [Google Scholar]
- Runacres, M. C., & Owocki, S. P. 2005, A&A, 429, 323 [NASA ADS] [CrossRef] [EDP Sciences] [Google Scholar]
- Sabín-Sanjulián, C. 2014, PhD thesis, Universidad de La Laguna, Spain [Google Scholar]
- Sabín-Sanjulián, C., Simón-Díaz, S., Herrero, A., et al. 2014, A&A, 564, A39 [NASA ADS] [CrossRef] [EDP Sciences] [Google Scholar]
- Sabín-Sanjulián, C., Simón-Díaz, S., Herrero, A., et al. 2017, A&A, 601, A79 [NASA ADS] [CrossRef] [EDP Sciences] [Google Scholar]
- Sana, H., de Mink, S. E., de Koter, A., et al. 2012, Science, 337, 444 [Google Scholar]
- Sander, A. A. C. 2019, IAU Symp., 346, 17 [NASA ADS] [Google Scholar]
- Sander, A. A. C., Lefever, R. R., Poniatowski, L. G., et al. 2023, A&A, 670, A83 [NASA ADS] [CrossRef] [EDP Sciences] [Google Scholar]
- Schmutz, W. 1995, IAU Symp., 163, 127 [Google Scholar]
- Simón-Díaz, S., & Herrero, A. 2014, A&A, 562, A135 [NASA ADS] [CrossRef] [EDP Sciences] [Google Scholar]
- Simón-Díaz, S., Castro, N., Herrero, A., et al. 2011, J. Phys. Conf. Ser., 328, 012021 [Google Scholar]
- Sundqvist, J. O., & Owocki, S. P. 2013, MNRAS, 428, 1837 [Google Scholar]
- Sundqvist, J. O., & Puls, J. 2018, A&A, 619, A59 [NASA ADS] [CrossRef] [EDP Sciences] [Google Scholar]
- Sundqvist, J. O., Puls, J., & Feldmeier, A. 2010, A&A, 510, A11 [NASA ADS] [CrossRef] [EDP Sciences] [Google Scholar]
- Sundqvist, J. O., Puls, J., Feldmeier, A., & Owocki, S. P. 2011, A&A, 528, A64 [NASA ADS] [CrossRef] [EDP Sciences] [Google Scholar]
- Sundqvist, J. O., Puls, J., & Owocki, S. P. 2014, A&A, 568, A59 [NASA ADS] [CrossRef] [EDP Sciences] [Google Scholar]
- Surlan, B., Hamann, W. R., Aret, A., et al. 2013, A&A, 559, A130 [NASA ADS] [CrossRef] [EDP Sciences] [Google Scholar]
- Wang, C., Langer, N., Schootemeijer, A., et al. 2020, ApJ, 888, L12 [NASA ADS] [CrossRef] [Google Scholar]
A very instructive illustration can be found in Brands et al. (2022).
Though on an absolute scale, the effective opacity also increases with increasing absorber density, until a certain saturation threshold is reached (Owocki et al. 2004; Sundqvist et al. 2010, Sundqvist et al. 2011).
http://research.cs.wisc.edu/htcondor/. The supercomputer facility HTCondor at Instituto de Astrofïsica de Canarias consists of a cluster of 914 cores, each capable of running in parallel, enabling us to create a full grid of models within roughly one week.
A discussion of specific dependencies which are different from the behavior of the optical lines can be found in Repolust et al. (2005).
We only discuss here the results for the optical. For a further discussion, see Sect. 4.2.1.
We have analyzed a different spectrum than Holgado (2019), and the Balmer lines are slightly broader in our case.
Gravities given in Repolust et al. (2005) are corrected for centrifugal acceleration. Using their data, we have uncorrected them and have also calculated the corresponding log Q for the comparison here.
As long as clumps are optically thick only for specific transitions from trace ions or less abundant atomic species, porosity will affect the corresponding diagnostics (e.g., the UV PV-diagnostics, see Oskinova et al. 2007; Sundqvist et al. 2010, 2011), but not the global atmospheric model and radiation field.
The (small) differences between both laws in the inner wind (Fig. 11) do not play any role.
All Tables
Diagnostic H/He optical and NIR lines used in the current work (regarding Br12 see Sect. 3.2.2).
Comparison between V sin i and Vmac values obtained from optical (“OP”) metal lines and from the NIR He I λ1.70 μm line.
Range of parameters used to produce the grids of synthetic profiles for clumped winds with different clumping stratifications.
Stellar parameters obtained from the optical analysis using the Linear10−025 clumping law.
All Figures
|
Fig. 1 Example for the spectra available in our sample (HD 46150). Upper panel: optical spectrum from the IACOB database; lower panels: NIR spectra from the Hanson et al. (2005) catalog. |
| In the text | |
|
Fig. 2 Location of models from the FASTWIND grid in the log g vs. log Teff plane. Nonrotating Geneva evolutionary tracks (Ekström et al. 2012) are plotted in green, and the blue line defines the corresponding Zero-Age Main Sequence (ZAMS). The numbers indicate the tracks’ initial stellar masses in units of M⊙. |
| In the text | |
|
Fig. 3 An example of the distribution of χ2 (y-axis) versus effective temperature (HD 15629). The minimum of χ2 is indicated by a red dot, and 1 and 2σ ranges are found from the intersection between the dashed lines and the distribution. |
| In the text | |
|
Fig. 4 Equivalent width (EW) ratios for selected optical and NIR He I/He II lines, as a function of log Teff and log g (see legend), resulting from our model-grid calculations. |
| In the text | |
|
Fig. 5 Spectral fits for selected optical (left) and NIR (right) lines using unclumped models. Observations are shown in black, and best fit model profiles in red. We stress that the individual model parameters for the best fitting optical and NIR profiles differ (to various extents) since the analyses have been performed separately for both ranges (cf. Table 5 vs. Table 6). The horizontal bar gives the wavelength scale for each range, and the scale of the ordinate axis is given by the vertical bar (at the bottom of the Hα column for the optical range, and at the bottom of the Br10 column for the NIR.) |
| In the text | |
|
Fig. 6 Comparison between the stellar parameters obtained by Holgado (2019; see also Holgado et al. 2018) and our work. Upper left panel: effective temperature. The dashed lines represent ± 1000 K; upper right panel: logarithmic gravity (±0.1 dex); lower left panel: log Q (±0.2 dex); lower right panel: helium abundance YHe(±0.03). Numbers indicate the stars as listed in Table 1. |
| In the text | |
|
Fig. 7 V sin i (filled circles) and Vmac (open diamonds) values obtained from the optical metal lines and from He I λ1.70 μm in the NIR. The dashed lines give the band ±30 km s−1 (for low V sin i) or 30% of V sin i (optical), whatever is larger. |
| In the text | |
|
Fig. 8 Brγ for the rapidly rotating dwarf and giant stars HD 217086 and HD 203064. Both line profiles show a small blue emission peak close to the core of the line, resulting in a distorted blue wing. Red profiles are from best fitting models. |
| In the text | |
|
Fig. 9 Comparison between the stellar parameters obtained by Repolust et al. (2005) and our work, both from the NIR alone. Upper left panel: effective temperature. The dashed lines represent ± 1000 K; upper right panel: logarithmic gravity (uncorrected, ±0.1 dex). Star number 9 has been slightly shifted in both axes for clarity; lower left panel: log Q (±0.2 dex); lower right panel: YHe(±0.03), and stars #7, 9, 10, and 11 have been slightly shifted upward from its value in Repolust et al. (2005, YHe= 0.20) to avoid overlap, as well as star #4 (YHe= 0.15). Numbers indicate the stars as listed in Table 1. |
| In the text | |
|
Fig. 10 Comparison between stellar parameters obtained in the optical and the infrared. Upper left panel: effective temperature. The dashed lines represent ±1000 K; upper right panel: logarithmic gravity (±0.1 dex). Star #9 has been slightly shifted from its value in Table 6; lower left panel: log Q (±0.2 dex); lower right panel: YHe(±0.03), and stars #10 and 8 have been slightly displaced from their values in Table 6. Numbers indicate the stars as listed in Table 1. |
| In the text | |
|
Fig. 11 Comparison between three different clumping laws investigated in the current work (see Table 7). Blue: Linear10–050; orange: Hillier200; cyan: Najarro200. The example refers to a velocity law with υ∞ = 1200 km s−1 and β = 0.8. |
| In the text | |
|
Fig. 12 Coarse-grid models in the log Teff – log g diagram, chosen to be representative for hot dwarfs to “cool” supergiants in the O-star regime. Overplotted in green are evolutionary tracks for Galactic nonrotating stars from Ekström et al. (2012), and the blue line defines the corresponding ZAMS. The numbers give the initial stellar masses in units of M⊙. |
| In the text | |
|
Fig. 13 Comparison of synthetic Hα profiles, for models with Teff = 36000 K, log g =3.40, and differing wind-clumping properties. Black: unclumped wind with log Q = −11.90. Orange: clumped model with the same mass-loss rate/wind strength parameter, using the Linear10–025 law. Red: clumped model with the same clumping properties/clumping law, but a mass-loss rate reduced by |
| In the text | |
|
Fig. 14 Clumping effects for selected optical and NIR lines, for a subset of the models from Fig. 13 (same broadening parameters). Here, we compare the smooth model (in black) with the clumped models with decreased (scaled) mass-loss rate, in red for the Lineari10−025 law, and in blue for the Linear10−050 one. |
| In the text | |
|
Fig. 15 Ηα and Brγ profiles for clumped supergiant models using different laws (see legend). Mass-loss rates have been scaled according to |
| In the text | |
|
Fig. 16 Four different linear clumping laws considered in our study, with the clumping factor as a function of stellar radius (in units of the photospheric radius, R*, with β = 0.8). Red solid line: Linear10−025; dashed blue line: Linear10−050; dashed green line: Linear20−040; dashed magenta line: Linear20−094. See text. |
| In the text | |
|
Fig. 17 Hα and Brγ profiles for the different clumping laws as indicated, including smooth winds. Mass-loss rates of clumped models have been scaled according to |
| In the text | |
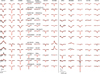 |
Fig. 18 As Fig. 5 using the clumping law Linear10−025. |
| In the text | |
|
Fig. 19 Comparison of spectral fits to selected optical and NIR lines from the supergiants of our sample. Observations: gray; synthetic profiles from best-fitting models without (black) and with clumping using various clumping laws (for color-coding, see legend). The stellar and wind parameters of the individual best-fitting models are provided in Tables 5, 10, A.1, A.3, A.5 for the optical lines, and in Tables 6, 11, A.2, A.4, A.6 for the NIR lines. |
| In the text | |
|
Fig. 20 Comparison of effective temperatures (upper left), gravity (upper right), log Q (lower left) and YHe (lower right) obtained from the optical spectra with the different clumping laws considered in this work. The abscissa gives the identification number of the star. For each star, the results from the different clumping laws (including the smooth wind model) are plotted (see legend). Corresponding entries (except for the smooth wind results) have been slightly displaced on the abscissa. Stars are ordered as in Table 1: #1: HD 46223; #2: HD 15629; #3: HD 46150; #4: HD 217086; #5: HD 149757; #6: HD 190864; #7: HD 203064; #8: HD 15570; #9: HD 14947; #10: HD30614; #11: HD 210809; #12: HD 209975. Rapid rotators are stars #4, #5, and #7. |
| In the text | |
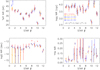 |
Fig. 21 Same as Fig. 20, but for the stellar parameters derived from the NIR. |
| In the text | |
|
Fig. 22 Same as Fig. 20, but for the differences between optical and NIR determinations. Temperature differences are given in kK, and differences in gravity and log Q in dex. |
| In the text | |
|
Fig. 23 Comparison of the observed Balmer and Brackett lines in HD 15570 (black) and HD 14947 (red). Whereas the Balmer lines are very similar, the Brackett lines Br10 and Br11 are much shallower in HD 14947. See text. |
| In the text | |
|
Fig. A.1 Spectral fits for selected optical (left) and NIR (right) lines using the clumping law Linear10–050. Observations are shown in black, and best fit model profiles in red. We stress that the individual model parameters for the best fitting optical and NIR profiles differ (to various extent) since the analyses have been performed separately for both ranges (cf. Table A.1 vs. Table A.2). The horizontal bar gives the wavelength scale for each range, and the scale of the ordinate axis is given by the vertical bar (at the bottom of the Hα column for the optical range, and at the bottom of the Br10 column for the NIR.) |
| In the text | |
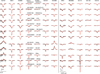 |
Fig. A.2 As Fig. A.1, but using the clumping law Linear20–025. |
| In the text | |
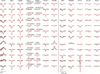 |
Fig. A.3 As Fig. A.1, but using the clumping law Linear20–050. |
| In the text | |
Current usage metrics show cumulative count of Article Views (full-text article views including HTML views, PDF and ePub downloads, according to the available data) and Abstracts Views on Vision4Press platform.
Data correspond to usage on the plateform after 2015. The current usage metrics is available 48-96 hours after online publication and is updated daily on week days.
Initial download of the metrics may take a while.