Open Access
Fig. 1
Download original image
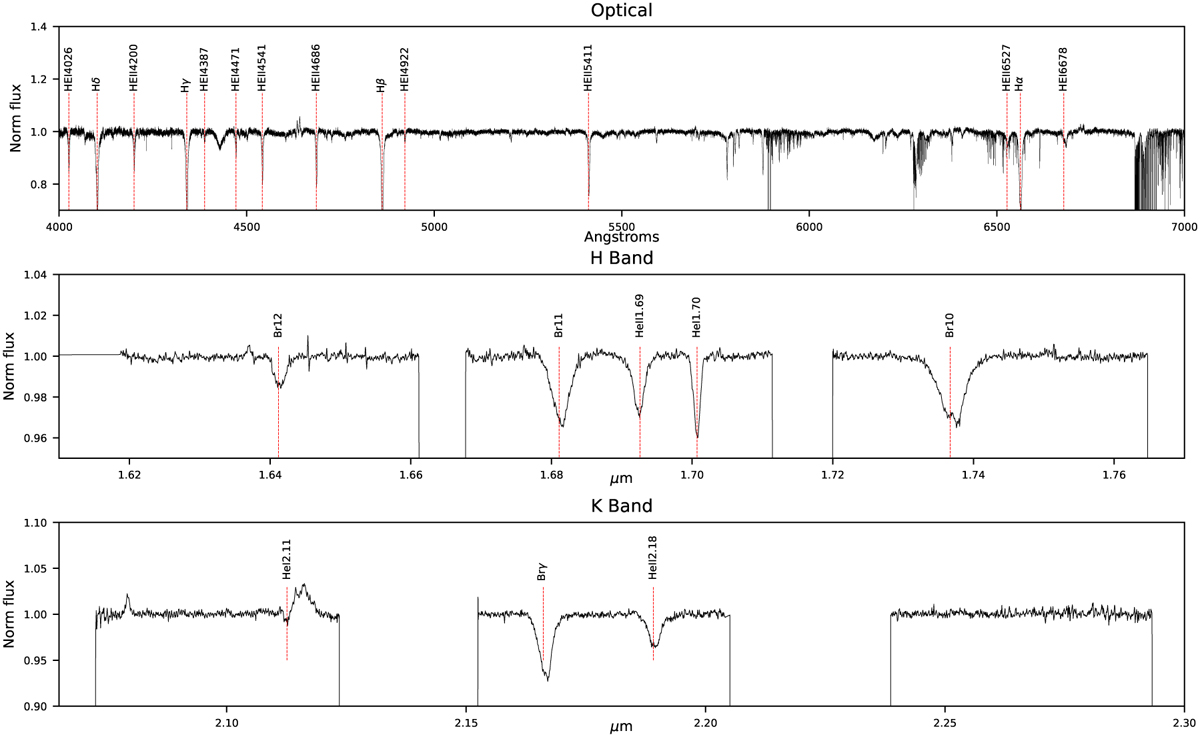
Example for the spectra available in our sample (HD 46150). Upper panel: optical spectrum from the IACOB database; lower panels: NIR spectra from the Hanson et al. (2005) catalog.
Current usage metrics show cumulative count of Article Views (full-text article views including HTML views, PDF and ePub downloads, according to the available data) and Abstracts Views on Vision4Press platform.
Data correspond to usage on the plateform after 2015. The current usage metrics is available 48-96 hours after online publication and is updated daily on week days.
Initial download of the metrics may take a while.