Fig. 19
Download original image
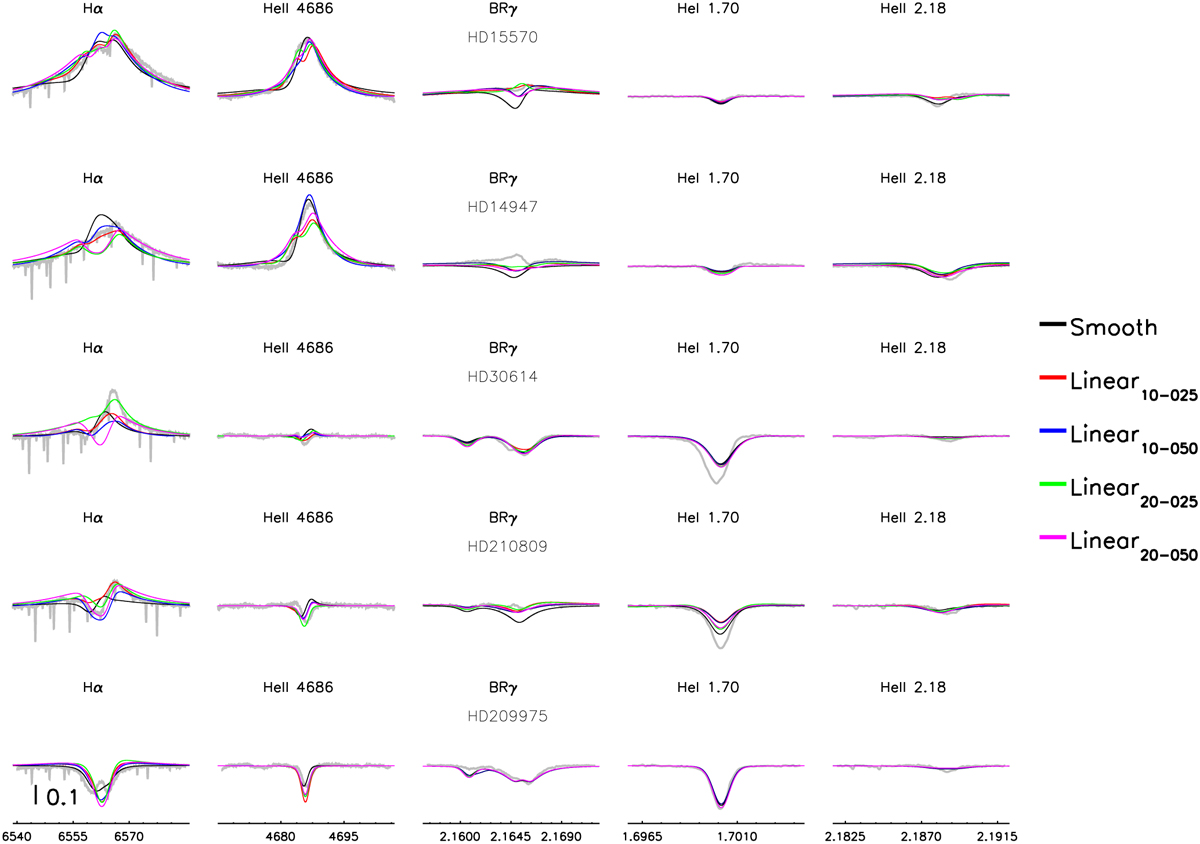
Comparison of spectral fits to selected optical and NIR lines from the supergiants of our sample. Observations: gray; synthetic profiles from best-fitting models without (black) and with clumping using various clumping laws (for color-coding, see legend). The stellar and wind parameters of the individual best-fitting models are provided in Tables 5, 10, A.1, A.3, A.5 for the optical lines, and in Tables 6, 11, A.2, A.4, A.6 for the NIR lines.
Current usage metrics show cumulative count of Article Views (full-text article views including HTML views, PDF and ePub downloads, according to the available data) and Abstracts Views on Vision4Press platform.
Data correspond to usage on the plateform after 2015. The current usage metrics is available 48-96 hours after online publication and is updated daily on week days.
Initial download of the metrics may take a while.