Open Access
Fig. 14
Download original image
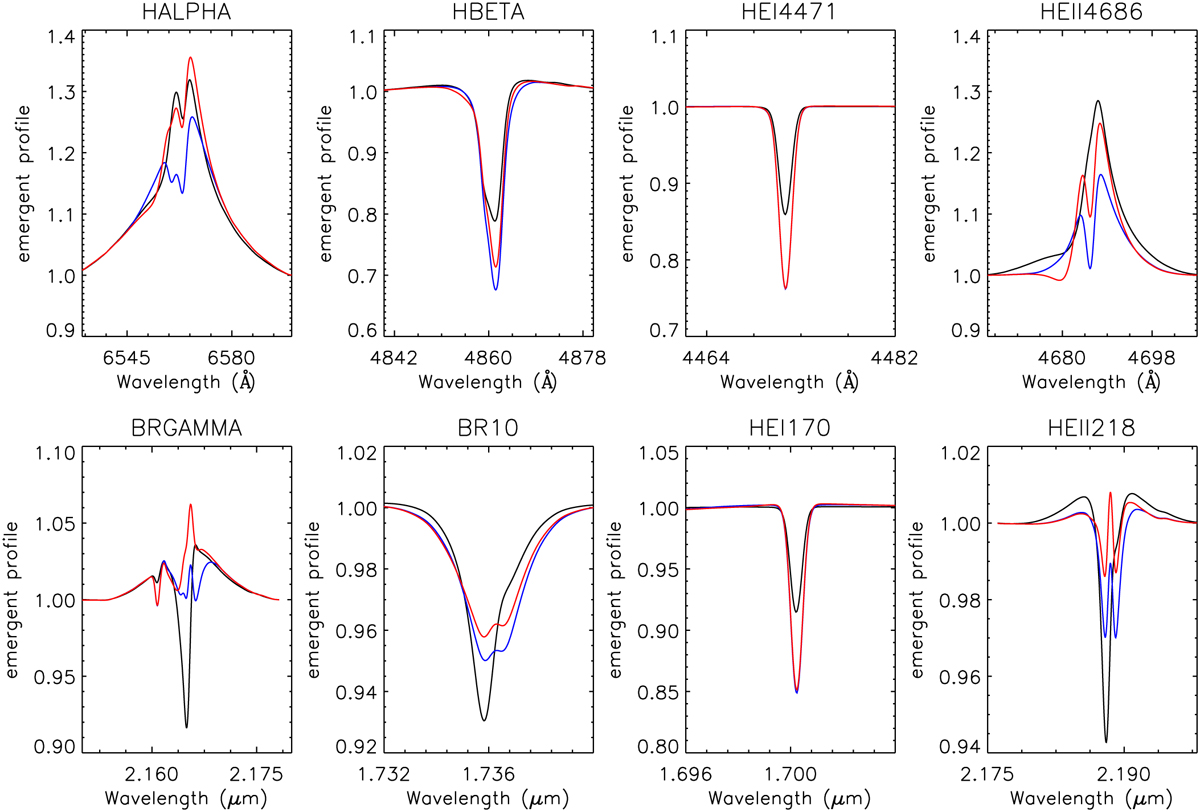
Clumping effects for selected optical and NIR lines, for a subset of the models from Fig. 13 (same broadening parameters). Here, we compare the smooth model (in black) with the clumped models with decreased (scaled) mass-loss rate, in red for the Lineari10−025 law, and in blue for the Linear10−050 one.
Current usage metrics show cumulative count of Article Views (full-text article views including HTML views, PDF and ePub downloads, according to the available data) and Abstracts Views on Vision4Press platform.
Data correspond to usage on the plateform after 2015. The current usage metrics is available 48-96 hours after online publication and is updated daily on week days.
Initial download of the metrics may take a while.