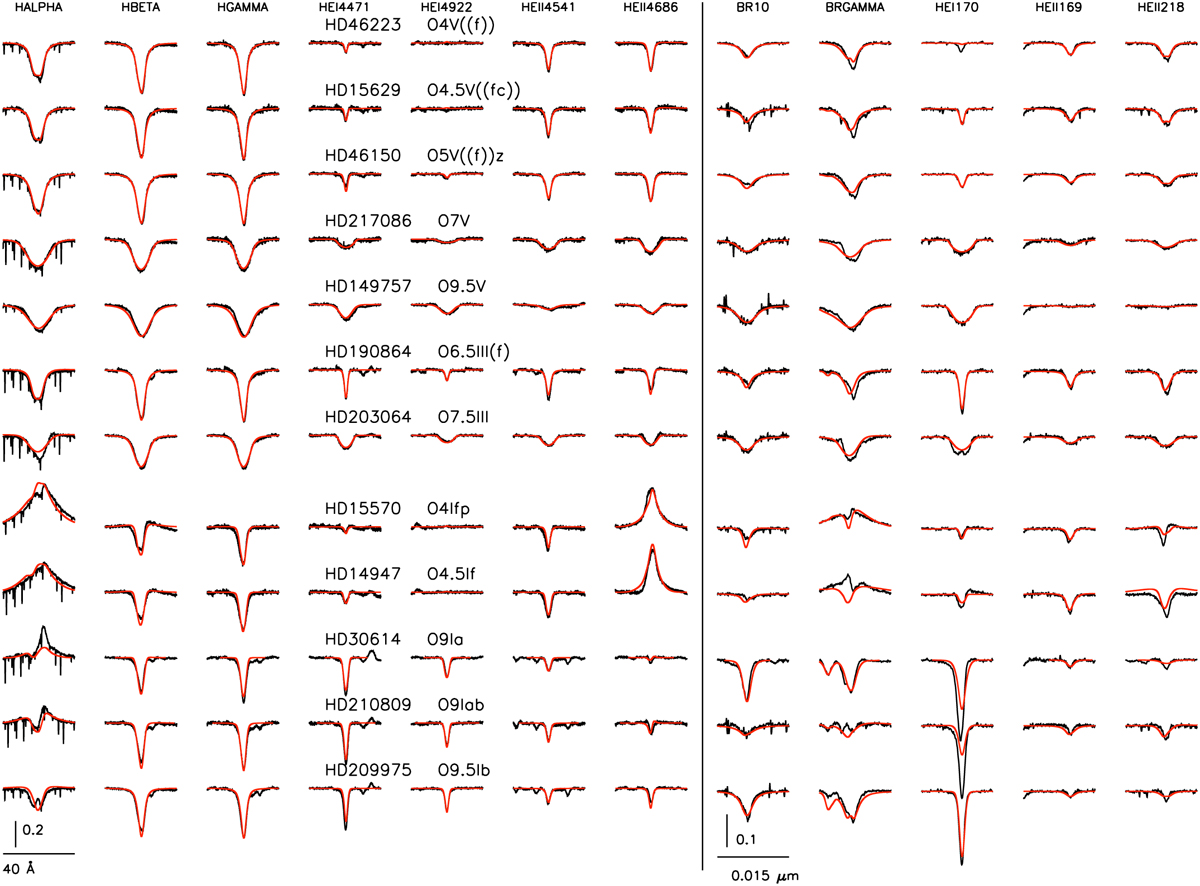
Fig. A.1
Download original image
Spectral fits for selected optical (left) and NIR (right) lines using the clumping law Linear10–050. Observations are shown in black, and best fit model profiles in red. We stress that the individual model parameters for the best fitting optical and NIR profiles differ (to various extent) since the analyses have been performed separately for both ranges (cf. Table A.1 vs. Table A.2). The horizontal bar gives the wavelength scale for each range, and the scale of the ordinate axis is given by the vertical bar (at the bottom of the Hα column for the optical range, and at the bottom of the Br10 column for the NIR.)
Current usage metrics show cumulative count of Article Views (full-text article views including HTML views, PDF and ePub downloads, according to the available data) and Abstracts Views on Vision4Press platform.
Data correspond to usage on the plateform after 2015. The current usage metrics is available 48-96 hours after online publication and is updated daily on week days.
Initial download of the metrics may take a while.