Fig. 10
Download original image
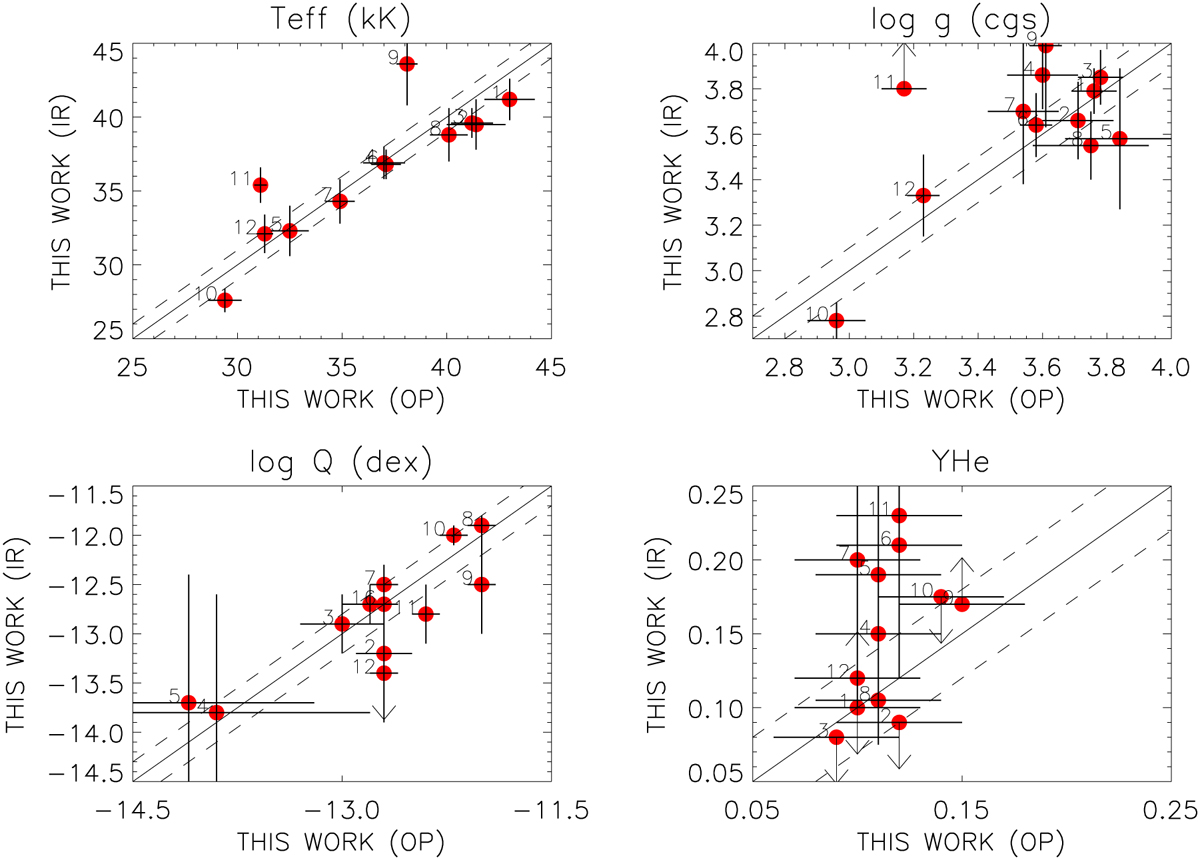
Comparison between stellar parameters obtained in the optical and the infrared. Upper left panel: effective temperature. The dashed lines represent ±1000 K; upper right panel: logarithmic gravity (±0.1 dex). Star #9 has been slightly shifted from its value in Table 6; lower left panel: log Q (±0.2 dex); lower right panel: YHe(±0.03), and stars #10 and 8 have been slightly displaced from their values in Table 6. Numbers indicate the stars as listed in Table 1.
Current usage metrics show cumulative count of Article Views (full-text article views including HTML views, PDF and ePub downloads, according to the available data) and Abstracts Views on Vision4Press platform.
Data correspond to usage on the plateform after 2015. The current usage metrics is available 48-96 hours after online publication and is updated daily on week days.
Initial download of the metrics may take a while.