| Issue |
A&A
Volume 677, September 2023
|
|
|---|---|---|
| Article Number | A179 | |
| Number of page(s) | 13 | |
| Section | Extragalactic astronomy | |
| DOI | https://doi.org/10.1051/0004-6361/202346753 | |
| Published online | 25 September 2023 | |
Merger-induced star formation in the low-metallicity dwarf galaxy NGC 4809/4810
1
School of Astronomy and Space Science, Nanjing University, Nanjing 210093, PR China
e-mail: This email address is being protected from spambots. You need JavaScript enabled to view it.
2
Key Laboratory of Modern Astronomy and Astrophysics (Nanjing University), Ministry of Education, Nanjing 210093, PR China
3
CAS Key Laboratory for Research in Galaxies and Cosmology, Department of Astronomy, University of Science and Technology of China, Hefei 230026, PR China
4
School of Astronomy and Space Science, University of Science and Technology of China, Hefei 230026, PR China
5
Frontiers Science Center for Planetary Exploration and Emerging Technologies, University of Science and Technology of China, Hefei, Anhui 230026, PR China
Received:
27
April
2023
Accepted:
2
August
2023
Abstract
Context. The physical mechanisms driving starbursts in dwarf galaxies are unclear, and the effects of mergers on star formation in these galaxies are still uncertain.
Aims. We explore how the merger process affects star formation in metal-poor dwarf galaxies by analyzing high spatial resolution (∼70 pc) integral field spectrograph observations of ionized gas.
Methods. We used archival data from the Very Large Telescope/Multi Unit Spectroscopic Explorer to map the spatial distribution of strong emission lines (e.g., Hβ, Hα, [O III] λ5007, and [N II] λ6583) in the nearby merging star-forming dwarf galaxy system NGC 4809/4810.
Results. We identify 112 star-forming knots scattered among the two galaxies, where the gas-phase metallicity distribution is inhomogeneous and mixes with metal-poor and metal-rich ionized gas. Star-forming knots at the interacting region show lower metallicity, the highest star formation rates (SFRs), and the highest ratio of the SFR to the resolved main-sequence relation (rMSR). Ionized gas exhibits an obvious northeast–southwest velocity gradient in NGC 4809, but appears to be mixed in NGC 4810. The high virial parameters and the stellar mass-size relation of the H II regions indicate that these regions are dominated by direct radiation pressure from massive stars (or clusters) and expand persistently. We find two different relations of the stellar mass surface density to stellar age in NGC 4809 and NGC 4810, and the stellar ages of NGC 4810 are systematically younger than those in NGC 4809.
Conclusions. Our study suggests that the merging stage of two dwarf galaxies can induce starburst activities in the interaction areas despite the metal-deficient environment. Considering the high specific SFRs and different stellar ages, we propose that the interaction initially triggered star formation in NGC 4809 and then drove star formation in NGC 4810.
Key words: galaxies: star formation / galaxies: individual: NGC 4809/4810 / galaxies: ISM / galaxies: interactions
© The Authors 2023
 Open Access article, published by EDP Sciences, under the terms of the Creative Commons Attribution License (https://creativecommons.org/licenses/by/4.0), which permits unrestricted use, distribution, and reproduction in any medium, provided the original work is properly cited.
This article is published in open access under the Subscribe to Open model. This email address is being protected from spambots. You need JavaScript enabled to view it. to support open access publication.
1. Introduction
The physical mechanisms that trigger galaxy starbursts are not yet fully understood. In the diagram of star formation rate (SFR) versus stellar mass (M*), galaxies fall into two broad categories: star-forming galaxies (SFGs, or blue clouds), which are mostly spiral or late-type galaxies that follow an almost linear relation of the SFR and the stellar mass (known as the main sequence relation, MSR; Brinchmann et al. 2004; Daddi et al. 2007; Peng et al. 2010; Lilly et al. 2013; Speagle et al. 2014); and starburst galaxies, which experience an exceptionally intense phase of star formation and lie above the MSR (Elbaz et al. 2018; Orlitova 2020). Quiescent galaxies (QGs, or red sequence galaxies), mostly consisting of elliptical or early-type galaxies, have a much lower SFR than SFGs and lie below the main sequence. Some so-called green valley galaxies lie between the blue SFGs and red QGs and have been classified as transition-zone or quenching galaxies (Bell et al. 2003; Fang et al. 2012). That galaxies lie above the main sequence suggests that SFGs may boost their star formation at some point in their life.
Galaxy mergers are inevitable processes in galaxy evolution (Hopkins & Quataert 2010). Mergers disrupt gas rotation, leading to rapid gas inflow that fuels intense starbursts or feeds central massive black holes. Energetic feedback from active galactic nuclei (AGNs) or starbursts heats the interstellar medium (ISM), preventing gas from cooling and expelling gas from the host galaxy (Fabian 2012; Cheung et al. 2016; Harrison et al. 2018), thereby suppressing star formation and transforming blue SFGs into quiescent red massive elliptical galaxies. In the local Universe, major mergers mainly occur between spiral galaxies, which can result in ultraluminous infrared galaxies ((U)LIRGs; Papadopoulos et al. 2007; Israel et al. 2015; Espada et al. 2018; Spence et al. 2018; Shangguan et al. 2019).
How star formation is triggered in dwarf galaxies with M* < 5 × 10⁹ M⊙ (Stierwalt et al. 2015) remains a mystery. While more than 70% of the galaxies in the local Universe are dwarfs, only a small percentage of them are starburst galaxies. Elbaz et al. (2018) identified two regimes for the starburst galaxies. One regime includes the global starbursts located above the MSR, showing a high gas fraction and a short gas-depletion time. In the other regime, these galaxies are located within the scatter of the MSR, but contain some compact star formation regions with short gas-depletion times (∼150 Myr). Global starbursts preferentially occur in dwarfs, while the starbursts are most often located in the circumnuclear region in the massive galaxies, such as (U)LIRGs. The dwarf starburst galaxies include blue compact galaxies (BCGs), the Lyman-α reference sample (LARS; Hayes et al. 2013; Östlin et al. 2014), Lyman-break analogs (LBAs; Heckman et al. 2001, 2005), and Green Peas (see the review in Orlitova 2020). Although many BCGs are relatively isolated, their morphologies and velocity distribution suggest that they have recently interacted with their neighbors. Moreover, the stellar components in BCGs contain both young and old populations (Kunth & Östlin 2000), indicating that interactions may trigger the starburst activity. However, previous star formation models suggest that due to the weak gravitational potential and strong turbulence of stellar winds, the conversion from molecular gas into stars may be inefficient. Thus, it remains an open question whether the merging of two dwarf galaxies can trigger starburst activity. Recent studies by Zhang et al. (2020a) and Zhang et al. (2020b) reported an enhanced star cluster formation rate (∝SFR) in the galaxy VCC 848, which is a remnant of a gas-rich dwarf-dwarf merger, by approximately 1.0 dex during the past 1 Gyr relative to its earlier times. On the other hand, using high spatial resolution observations from the Very Large Telescope (VLT)/Multi Unit Spectroscopic Explorer (MUSE) and the Atacama Large Millimeter Array (ALMA), Gao et al. (2022) found that the post-merger galaxy Haro 11 is undergoing efficient molecular gas consumption and stellar mass assembly. However, previous studies rarely examined the detailed star formation activities of dwarf galaxies at premerger and merging stages.
This paper studies the ionized gas properties of NGC 4809/4810, a merging system in the nearby universe (e.g., Casasola et al. 2004; Paudel et al. 2018). NGC 4809 and NGC 4810 are currently colliding and overlap in a small region. We obtained the redshift (z) of 0.00326 from the NASA/IPAC Extragalactic Database (NED)1. The redshift corresponds to a luminosity distance of 14.0 Mpc and a scale of 67 pc per arcsecond. Zou et al. (2019) used photometric data from the DESI Legacy Imaging survey (g, r, z bands; Dey et al. 2019) and the unWISE survey (W1, W2 bands; Mainzer et al. 2014) to perform stellar population synthetic fitting and determined that the total stellar mass of NGC 4809/4810 is about 2.5 × 10⁸ M⊙, indicating that it is a merging dwarf galaxy system. Single-spectrum observations prevented a detailed analysis of the physical properties (density, temperature, dust extinction, and metallicity) of the ionized gas, the kinematics of the stellar and ionized gas, and the effect of the merger on the star formation activities. To address these questions, we collected and analyzed high spatial resolution integral field spectrograph (IFS) observation data by the VLT/MUSE to investigate the ionized gas properties and kinematics in NGC 4809/4810 at 67 pc scales.
This paper is organized as follows: In Sect. 2 we present the observations and data reduction and then derive the ionized gas properties. The main results and discussion are presented in Sects. 3 and 4, respectively. We summarize our findings in Sect. 5. Throughout the paper, we assume a flat ΛCDM cosmology model with ΩΛ = 0.7, Ωm = 0.3, and H0 = 70 km s−1 Mpc−1. We adopt the solar metallicity (Z⊙) as 12 + log(O/H) = 8.69 (Allende Prieto et al. 2001).
2. Observations and data reduction
2.1. VLT/MUSE data
NGC 4809/4810 was observed by VLT/MUSE in May 2015 (ID: 095.D-0172; PI: Kuncarayakti) with an integration exposure time of approximately 0.8 h in the two-component field-of-view regions. The fully reduced data cube was obtained from the ESO archive website2. The observations had a seeing value of about 0.5″, and the full width at half maximum (FWHM) of the final image was approximately 0.8″. The rest-frame spectral range was 4750 − 9160 Å, with a channel width of 1.25 Å. We show the pseudo-color image of NGC 4809 (north component) and NGC 4810 (south component) combined with the r-, i-, and y-band images from the Hyper Suprime-Cam Subaru Strategic Program (HSC-SSP) in the left panel of Fig. 1. The white rectangles indicate the two field of view (FoV) regions observed by MUSE.
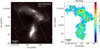 |
Fig. 1. Pseudo-color image of NGC 4809 (north component) and NGC 4810 (south component) combined with the r-, i-, and y-band images from the HSC-SSP (left panel). The white rectangles indicate the two FoV regions observed by MUSE. The red star represents the supernova SN2011jm. Integrated-intensity map of the attenuation-corrected Hα emission (right panel). The circles represent the identified Hα knots detected by Astrodendro. The red circles represent these knots around SN2011jm, and the blue circles show these knots in the interaction area of the two galaxy components. We also label the IDs of some large knots. |
To derive the flux of pure emission lines, we used the STARLIGHT package (Cid Fernandes et al. 2005) to reproduce the stellar continuum. In this process, we assumed the Chabrier (2003) initial mass function (IMF) and performed a combination of 45 single stellar populations (SSPs) from the Bruzual & Charlot (2003) model, which consists of three different metallicities and 15 stellar ages. The SSP fitting results allowed us to derive the stellar mass and stellar age within each spatial pixel (spaxel) with an uncertainty of 0.11 dex and 0.14 dex (Bruzual & Charlot 2003; Cid Fernandes et al. 2005), respectively. We estimated the total stellar mass (M* ∼ 2.4 × 10⁸ M⊙) by integrating the values in each pixel with a continuum S/N higher than 3.0, in which the stellar masses of NGC 4809 and NGC 4810 are about 1.3 × 10⁸ M⊙ and 1.1 × 10⁸ M⊙, respectively. After subtracting the stellar continuum synthesis, we applied multiple Gaussians to fit strong emission lines such as Hα, Hβ, [O III] λλ4959,5007, [N II] λλ6548,6583, and [S II] λλ6717,6731. To ensure a reliable measurement of SFR and metallicity, we only considered spaxels with S/N ( Hα, Hβ,[O III] λλ4959,5007) > 5 and S/N ([N II] λ6583, [S II] λλ6717,6731) > 3.
2.2. Star formation knots
We used the Astrodendro3 Python package (Goodman et al. 2009) to search for star-forming clumps in the Hα map of NGC 4809/4810. This clump-finding algorithm is based on a dendrogram and has been used to reliably identify star-forming cores in galaxies (see Li et al. 2020 for a detailed comparison of different clump-finding packages). To define the boundaries of the clump structures, we specified several parameters, including min_value, min_delta, and min_npix. The min_value represents the minimum value in the field to be considered, min_delta represents the minimum significance of the structure to avoid including local maxima, and min_npix specifies the minimum number of pixels that a structure should contain. Adopting the smallest region radius as the seeing value, we obtain a min_npix of 26. We selected six different regions in the Hα intensity map around the galaxy, and measured the root mean square (RMS) values in each region. Then we adopted the min_value and min_delta as the mean values of five times the RMS and one time the RMS, respectively. Ultimately, we identified 112 Hα knots within these two galaxies, and their distribution is shown in the right panel of Fig. 1.
3. Results
The spatial distribution of ionized gas can provide crucial insight into the kinematics of gas and the activity of star formation. In this study, we present for the first time the properties of ionized gas within NGC 4809/4810.
3.1. Emission line maps and BPT diagrams
We show in Figs. 1 and 2 the emission line maps of the ionized gas, including Hα, [O III] λ5007, [N II] λ6563, [S II] λ6731, and [O I] λ6300. These maps provide insight into the level of ionization in H II regions and into the strength of the ultraviolet radiation field. For instance, as the ionization potential of H is much lower (13.6 eV) than that of O++ (35 eV), higher [O III] λ5007/ Hα ratios indicate a higher number of energetic photons. The spatial distributions of [O III] λ5007 and Hα emissions overlap, tracing the same ionizing source of young stars in star-forming regions. The luminous Hα and [O III] λ5007 emission lines are mainly concentrated in the hotspots surrounding the supernova SN2011jm, which was regarded as a type-Ic supernova with an initial star mass of 20.7 M⊙ (Howerton et al. 2011; Kuncarayakti et al. 2018), and the interaction regions of these two galaxies. Additionally, there are some isolated Hα and [O III]-emitting blobs between these two galaxies. The spatial distributions of [N II] λ6583 and [S II] λ6731 are similar to the Hα and [O III] emission and can be used to calibrate the gas-phase metallicity.
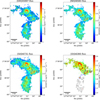 |
Fig. 2. Integrated-intensity maps of four emission lines. [O III] λ5007 (top left), [N II] λ6583 (top right), [S II] λ6731 (bottom left), and [O I] λ6300 (bottom right) are shown after correcting for attenuation. The circles indicate the locations of the identified star formation knots, which are the same as in Fig. 1. |
In addition to highly ionized [O III] gas, the lowly ionized forbidden [O I] λ6300 line is commonly used to trace the radiation of the ISM heated by shocks. Thermal electrons with low energy (∼1.9 eV) can excite O atoms through collisions, resulting in the observed [O I] λ6300 line. Higher-speed shocks can increase the thermal energy of free electrons in the ISM, thereby enhancing the number of collisional excitations. In Fig. 2 the distribution of [O I] λ6300 is similar in NGC 4809 but is only detected in two bright star formation knots of ID 8 and 39 in NGC 4810. This indicates that most shocks occur in NGC 4809 instead of NGC 4810, which is discussed in Sect. 3.2.
We used spatially resolved BPT diagnostic diagrams (Baldwin et al. 1981; Kewley et al. 2001; Kauffmann et al. 2003) to determine the primary ionizing source in each spaxel. The [N II]-based (Kewley et al. 2001; Kauffmann et al. 2003; Cid Fernandes et al. 2010) and [O I]-based (Kewley et al. 2001, 2006) BPT diagrams and their corresponding spatial distributions are presented in Fig. 3. Our results reveal that star formation dominates gas ionization in both galaxies in the [N II]-based diagram. However, in the [O I]-based BPT diagram, we find a few AGN-like ionized regions located at the outer edge of the supernova ring, which might be caused by shock. A few spaxels identified as LINER-like regions may be excited by shock or ionized by hot evolved (post-asymptotic giant branch) stars (Belfiore et al. 2016). In summary, we discovered that 104 Hα knots are primarily determined by star formation in the [N II]-based and [O I]-based BPT diagrams, while 8 knots are detected at the AGN or LINER regimes of the [O I]-based BPT diagram.
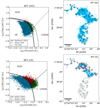 |
Fig. 3. Spatially resolved BPT diagrams (left) of NGC 4809/4810 and their corresponding spatial distribution (right), obtained from the attenuation-corrected integrated intensity maps. The solid, dashed, and dotted lines in the [N II]-based BPT diagram are the demarcation curves that separate star formation, AGNs, and Low Ionization Nuclear Emission Regions (LINERs) as defined by Kauffmann et al. (2003), Kewley et al. (2001), and Cid Fernandes et al. (2010), respectively. In the [O I]-based BPT diagram, the solid and dashed lines separate star-forming galaxies, Seyfert galaxies, and LINERs as defined by Kewley et al. (2001, 2006). Regions dominated by star formation, AGN-type ionization, and LINERs are marked in blue, red, and green, respectively. |
3.2. Kinematics of ionized gas
We adopted a single-Gaussian profile to fit the mean velocity of gas in NGC 4809/4810. In Fig. 4 we present the velocity and velocity dispersion maps of the ionized gas, traced by Hα and [O III] λ5007. The Hα velocity field is overlaid as contours with levels of −70, −35, 0, 35, and 70 km s−1. These maps show that the ionized gas displays an obvious northeast–southwest velocity gradient in NGC 4809, but is approximately oriented along the northwest-southeast direction in NGC 4810. We observe that the ionized gas in NGC 4809 is clearly separated into different velocity ranges, but appears to be mixed in NGC 4810. Moreover, the southwest regions of NGC 4809 (e.g., knot IDs 48, 49, 50, 53, and 56) exhibit similar velocities to those in NGC 4810 (knot 39). This result suggests that these star-forming knots (IDs 39, 48, 49, 50, 53, and 56; marked in blue) are located in the interaction area of the two merging galaxies.
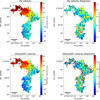 |
Fig. 4. Velocity (left panel) and velocity dispersion (right panel) maps of the Hα and [O III] λ5007 emission lines, respectively. The velocity dispersion was obtained by enforcing single-Gaussian profile fitting. The gray contours in the Hα velocity map represent velocity levels of −70, −35, 0, 35, and 70 km s−1. |
We computed the velocity dispersion (σ) using the FWHM (σ = FWHM/2.355) and subtracted the instrumental broadening of MUSE (Bacon et al. 2010). In the right panels of Fig. 4, we present the luminosity-weighted average velocity dispersion maps of the Hα and [O III] λ5007 emission gas, which reflect the typical random motions of the ionized gas in the interstellar medium. The Hα and [O III] λ5007 velocity dispersion ranges from 25 to 64 and 42 to 114 km s−1, respectively, with median values of 40 and 66 km s−1. Low dispersion values (σHα ≤ 40 km s−1, σ[O III] ≤ 65 km s−1) are measured at the northeast knots of NGC 4809 and in the south knots of NGC 4810, while higher dispersion values (σHα ≥ 40 km s−1, σ[O III] ≥ 65 km s−1) are observed at the knots in the interaction area. Furthermore, high Hα and [O III] velocity dispersion values are measured north and south of the supernova and in its surrounding regions, indicating the possible influence of the massive stars/clusters on the stellar feedback in the previous evolutionary stage.
3.3. Distribution of gas-phase metallicity
The gas-phase metallicity is a crucial factor for understanding galaxy evolution because it is linked to previous star formation, mass inflow/outflow, and the mixing of metals in the ISM. There are various methods for measuring the gas-phase metallicity, specifically the oxygen abundance, of the ISM (e.g., Kewley & Ellison 2008; Kewley et al. 2019). Some of these methods use photoionization models of H II regions to reproduce specific emission line ratios, such as N2O2 ([N II] λ6583/[O II] λ3727) (Kewley & Dopita 2002), R23 (([O II] λ3727 +[O III] λλ4959,5007)/Hβ) (Kobulnicky & Kewley 2004), and N2S2 ([N II] λ6583/[S II] λλ6717,6731) (Dopita et al. 2016). The most reliable approach to determining the metallicity involves directly measuring the electron temperature (Te) from faint auroral-to-nebular emission line ratios, such as [O III] λ4636/[O III] λ5007, and then using the strengths of other emission lines to calculate the metallicity (e.g., Izotov et al. 2006). However, the faint [O III] λ4636 emission line is only significant in H II regions with high enough temperature and little cooling in metal-poor galaxies. Other calibrations use strong emission line ratios, such as O3N2 (([O III] λ5007/Hβ)([N II] λ6583/Hα)) and N2 ([N II]λ6583/Hα), to estimate the electron temperature metallicity. Because the MUSE spectral wavelength does not cover the [O II] λ3727 and [O III] λ4636 lines, we used two different strong-line calibrators, O3N2 and N2S2, to determine the metallicity of each spaxel.
The O3N2 index (Alloin et al. 1979) is defined as
![Mathematical equation: $$ \begin{aligned} \mathrm{O3N2} \equiv \log {\left(\frac{[{\text{ O}}{\small {\uppercase {\text{ III}}}}]\,\lambda 5007}{\mathrm{H} \beta } \times \frac{\mathrm{H} \alpha }{[{\text{ N}}{\small {\uppercase {\text{ II}}}}]\,\lambda 6583}\right)}\cdot \end{aligned} $$](/articles/aa/full_html/2023/09/aa46753-23/aa46753-23-eq1.gif) (1)
(1)
Marino et al. (2013) improved the O3N2 calibration based on CALIFA and literature data using Te, providing the following relation:
 (2)
(2)
with a typical error of 0.08 dex when O3N2 ranges from −1.1 to 1.7. The median O3N2-based metallicity and its 1σ dispersion of all spaxels are about  .
.
The N2S2 index (Dopita et al. 2016) is defined as
![Mathematical equation: $$ \begin{aligned} \mathrm {N2S2} \equiv \log {\left(\frac{[{\text{ N}}{\small { {\text{ II}}}}]\,\lambda 6583}{[{\text{ S}}{\small { {\text{ II}}}}]\,\lambda \lambda 6717,6731}\right)}, \end{aligned} $$](/articles/aa/full_html/2023/09/aa46753-23/aa46753-23-eq4.gif) (3)
(3)
which is sensitive to metallicity and weakly dependent on reddening and ionization parameter. Combining it with the N2 index (N2 ≡ log([N II] λ6583/Hα)), Dopita et al. (2016) presented the calibration relation as follows:
 (4)
(4)
The median N2S2-based metallicity and its 1σ dispersion are about  .
.
The gas-phase metallicity distributions are depicted in Fig. 5. We regard metallicities with a value lower (higher) than 1σ as metal poor (rich). It is evident that the metallicity distribution is heterogeneous in the two galaxies, comprising both metal-poor and metal-rich ionized gas. The majority of star formation knots show a lower metallicity when using either the O3N2 or N2S2 calibrators, although the distributions vary considerably between the two. In the O3N2-based map, metal-poor regions are primarily concentrated in the SN2011jm-surrounding regions (knot IDs 83, 87, 93, 96, and 97; marked in red), the interaction area (marked in blue) between NGC 4809 and NGC 4810. However, in the N2S2-based map, metal-poor regions are mainly confined to the interaction area.
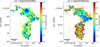 |
Fig. 5. Gas-phase metallicity distributions of NGC 4809/4810 determined by two calibrators, O3N2 (left) and N2S2 (right). |
In summary, the star-forming knots in the interaction area show a lower metallicity, regardless of the assumed calibrators. This result could be explained by the dilution of inflowing metal-poor gas during the merging process of the two dwarf galaxies. However, the metallicity of the regions surrounding SN2011jm differs significantly when using the two calibrators. The most deficient O3N2-based metallicity values around the supernova could be attributed to the calibration underestimation in this high-ionization environment. When we use the N2S2 index, which is weakly dependent on ionization parameter, the ISM around the supernova exhibits a high metallicity, possibly due to the substantial contribution of metal-enriched stellar wind (and supernova ejecta) from previous massive star clusters.
3.4. Spatially resolved star formation rate
We calculated the extinction-corrected Hα flux using the Hα/Hβ ratio and the case B recombination model with the reddening formalism from Calzetti et al. (2000). Because our focus is on the intense star-forming regions in NGC 4809/4810, we used ionization-based tracers such as Hα for this study. We obtained the SFR from the Hα luminosity, Lcor (Hα), using the calibration relation in Kennicutt (1998), which assumes a Chabrier (2003) IMF,
 (5)
(5)
The uncertainty on the SFR was calculated from the Hα luminosity and attenuation uncertainties, which include the errors in the Hβ intensity. The total SFR of these two galaxies is 0.12 ± 0.01 M⊙ yr−1. We also obtained the SFR surface density, ΣSFR, by dividing the area of each region.
In the left panel of Fig. 6, we show the distribution map of the SFR surface density (ΣSFR). To compare this with the SFR in normal star-forming galaxies, we present a ratio map (right panel) of the ΣSFR to the resolved stellar mass-SFR relation (rMSR) in star-forming galaxies from the MaNGA survey (Liu et al. 2018). Liu et al. (2018) studied 141,114 spaxel bins of star-forming main-sequence galaxies, then derived the rMSR by performing the best optimized least-squares (OLS) linear fitting for all spaxel bins. The knots with the highest SFRs and SFR/rMSR ratios (> 1 dex) are located at the interaction area and in the ring around the supernova. These SFR-enhanced regions also show a lower metallicity in Fig. 5. Our results suggest that the merging process of two dwarf galaxies can trigger their star formation activities in the interaction area even in a metal-poor environment.
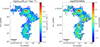 |
Fig. 6. Maps of the SFR surface density (ΣSFR, left panel) and the ratios (right panel) of ΣSFR and the spatial resolved main-sequence relation in nearby star-forming galaxies from the MaNGA survey (rMSR; Liu et al. 2018). |
4. Discussion
4.1. Chemical inhomogeneity
In Sect. 3.3 we observed that the spatial distributions of the metallicity in NGC 4809/4810 are significantly inhomogeneous, which differs from the homogeneous distribution found in some studies of H II galaxies on spatial scales larger than 100 pc (e.g., Cairós et al. 2009; García-Benito & Pérez-Montero 2012; Kehrig et al. 2016). These studies focused on significantly compact galaxies with star formation activities mostly concentrated in a few knots, where feedback mechanisms such as stellar winds and supernovae efficiently mix newly created metals homogeneously with the surrounding ionized gas during the H II region lifetime.
However, previous IFU-based studies (e.g., Lagos et al. 2009; Bresolin 2019; James et al. 2020) have also reported chemical inhomogeneities. These studies suggested that complex processes, such as metal-enriched gas outflows from supernovae, self-enrichment winds from massive stars, metal-poor gas accretion from interactions/mergers, and rapid starburst activities at shorter timescales than the metal mixing, may cause these inhomogeneities.
Figure 5 shows that the gas-phase metallicity is generally lower in most of the star formation knots than in the surrounding ISM. The metallicity distributions derived by the O3N2 and N2S2 diagnostics are similar, but also different. For example, the interaction areas have a lower metallicity in both calibration maps, which could be attributed to the accretion/dilution of external metal-poor gas during the merging phase. We observe significant differences in the metallicity distributions around the supernova, with lower O3N2-based metallicity and higher N2S2-based metallicity. This difference may be due to the large discrepancy between different metallicity calibrators (e.g., Kewley & Ellison 2008; Dopita et al. 2016; Morisset et al. 2016). Kewley & Dopita (2002) used the [O III]/[O II] two-line ratio to define the ionization parameter. Higher ionization parameters are always directly linked to higher sSFRs in star-forming galaxies (Kaasinen et al. 2018) due to the larger reservoir of ionizing photons at intense star formation sites. Although the [O II] λ3727 emission line is not covered in our spectra, these supernova-surrounding regions exhibit much higher SFRs and sSFRs (Fig. 7), suggesting high ionization parameters. The gas-phase metallicity derived from the O3N2 diagnostic additionally depends on the ionization parameter, tending to show lower metallicity with higher ionization parameter (e.g., Pettini & Pagel 2004; Marino et al. 2013; Teklu et al. 2020). However, the N2S2 diagnostic is weakly dependent on the ionization parameter (Dopita et al. 2016). These calibration differences may explain the different metallicity behaviors at the star formation sites around the supernova. The detailed dispersal and mixing of the metals released by massive stars/supernovae into the surrounding H II regions remains an open question that we will explore in future work (Gao et al., in prep.).
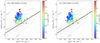 |
Fig. 7. Spatially resolved main-sequence relation (rMSR) between the surface density of stellar mass (Σ*) and the surface density of star formation rate (ΣSFR) for star-forming knots in NGC 4809/4810. The sizes of the markers correspond to the sizes of the knots, and their colors indicate their gas-phase metallicity values determined by O3N2 (left panel) and N2S2 (right panel) diagnostics. The gray contours and the solid black line represent the distribution of normal star-forming galaxies and their rMSR obtained by Liu et al. (2018) from the MaNGA survey, respectively. We also provide the star formation knots around SN2011jm (red edgecolors) and at the interaction area (blue edgecolors), which are the same as in Fig. 1. The dashed lines represent different specific star formation rate (sSFR, ΣSFR/Σ*) levels. |
4.2. Scaling relations
In Sect. 3.4 we presented the spatial distribution of SFR surface density and ΣSFR/rMSR. In this section, we analyze the star-forming knots in the Σ* − ΣSFR space and their gas-phase metallicity values, as shown in Fig. 7. The size of the markers indicates their knot sizes, and the colors indicate their gas-phase metallicity values determined by O3N2 and N2S2 diagnostics. We also mark the ID of some knots to facilitate the description of the star formation activities. In Fig. 7 the gray contours represent the Σ* − ΣSFR distribution of normal star-forming galaxies from the MaNGA survey, and the solid line represents their best-fit rMSR derived by Liu et al. (2018).
Most of the star-forming knots in our sample are located above the rMSR, indicating intense star formation activities. The highest sSFR values were found in knots surrounding supernovae (red edgecolors), which were approximately two orders of magnitude higher than the rMSR. These values suggest that some physical mechanisms must trigger the star formation in these regions. Furthermore, we note that the knots that are located in the interaction areas between the two galaxies (blue edgecolors) also exhibit sSFR values that are higher by approximately one order of magnitude than the rMSR. These knots display low O3N2(N2S2)-based metallicity values and larger physical sizes, indicating that the merger process can trigger star formation activity on a large scale even in a metal-poor environment.
We also present the resolved fundamental metallicity relation (FMR; e.g., Mannucci et al. 2010; Gao et al. 2018a,b; Cresci et al. 2019; Curti et al. 2020) in Fig. 8. The FMR, which relates the surface mass density (Σ*), gas-phase metallicity (Z), and star formation rate surface density (ΣSFR), was developed to reduce the scatter in the mass-metallicity relation (e.g., Tremonti et al. 2004; Mannucci et al. 2010; Curti et al. 2020). We calculated the combined quantity μα as log(Σ*) − αlog(ΣSFR), where α = 0.32, following the method in Mannucci et al. (2010). The solid and dashed lines in Fig. 8 represent the best-fit relations based on orthogonal distance regression (odr) and their 1σ distribution, respectively. In the O3N2-based and N2S2-based FMRs, most of the star-forming knots in the interaction areas exhibit a significantly lower gas-phase metallicity than expected for a given Σ* and ΣSFR, supporting the idea that the merger process can dilute the gas-phase metallicity by inflowing metal-poor gas. However, the high gas-phase metallicity observed in other knots above the FMR may be explained by the metal enrichment caused by stellar activities.
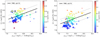 |
Fig. 8. Spatially resolved fundamental metallicity relation (rFMR, Σ* − Z − ΣSFR) of star formation knots in NGC 4809/4810. The combined quantity μα is defined as log(Σ*) − αlog(ΣSFR). We adopt the α = 0.32, which is same to previous studies (e.g., Mannucci et al. 2010; Yao et al. 2022). The solid lines represent the best-fit relations based on orthogonal distance regression (odr). The dashed lines represent the 1σ distribution around the fitted FMR relations. The other markers are the same as in Fig. 7. |
4.3. Comparison with galaxy pairs
In previous studies, Pan et al. (2019) and Steffen et al. (2021) compared the specific SFR of star-forming galaxy pairs and mass-matched control galaxies in the MaNGA survey. They found that the star formation activities are triggered in the interaction processes, showing a ∼0.3 dex higher sSFR within one effective radius. We compare the star-forming regions of NGC 4809/4810 with these galaxy pairs in Fig. 9. Gray contours indicate the stellar mass surface density and SFR surface density of 54 star forming galaxy pairs selected by Pan et al. (2019) and Steffen et al. (2021) from the MaNGA survey. These galaxies are selected with log(M/M⊙) = 9.0 − 11.5 and log(sSFR/yr−1) > −10.5. The stellar mass and emission line intensity at each spaxel are derived from the Pipe3D value added catalog4 (Sánchez et al. 2016a,b, 2018). The Pipe3D adopts a Salpeter IMF, while our analysis in Sect. 2.1 adopts the Chabrier IMF. In order to convert the stellar mass from a Salpeter IMF into Chabrier IMF, 0.2 dex has to be subtracted from the Pipe3D stellar mass. The significant star formation enhancement in galaxy pairs might occur in the coalescence phase (i.e., post merger) and in the high stellar mass surface density region. We note that the interaction areas between NGC 4809/4810 also show SFR surface densities higher by more than 1 dex than the galaxy pairs at a similar stellar mass surface density. We suspect that the interaction between the gas-rich dwarf galaxies can trigger star formation activities in the less massive surface density region. Furthermore, the different spatial scales of the star formation clumps of NGC 4809/4810 and the spaxels in MaNGA galaxies might cause differences in the sSFR.
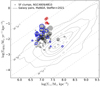 |
Fig. 9. Spatially resolved main-sequence relation (rMSR) between the surface density of stellar mass (Σ*) and the surface density of star formation rate (ΣSFR) for star-forming knots in NGC 4809/4810. The sizes of the markers correspond to the sizes of the knots. The gray contours indicate the distribution of Σ* and ΣSFR of 54 star-forming galaxy pairs selected by Steffen et al. (2021) in the MaNGA survey. We also provide the star formation knots around SN2011jm (red edgecolors) and at the interaction area (blue edgecolors), which are the same as in Fig. 1. The dashed lines represent different specific star formation rate (sSFR, ΣSFR/Σ*) levels. |
4.4. Other properties of the H II regions
From the attenuation-corrected Hα luminosity, LHα, the radius of the H II region, RH II, and the velocity dispersion, σv, we determined several physical parameters, including the ionized gas mass of the H II regions (MH II) and the virial parameter (αvir). Using Eq. (5) of Zaragoza-Cardiel et al. (2014), we calculated the ionized gas mass, MH II, as follows:
 (6)
(6)
Here, ne represents the electron density, and mp = 1.67 × 10⁻²⁷ kg is the proton mass. The units for LHα and RH II are erg s−1 and pc, respectively. We present the ionized gas mass – size relation (MH II − RH II) of the H II regions in the left panel of Fig. 10. The best-fit relation is
 (7)
(7)
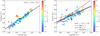 |
Fig. 10. Relation between the ionized gas mass and size (MH II − RH II) and between the stellar mass and size (M∗ − RH II) for H II regions, color-coded by their SFR surface densities. The solid black lines represent the best-fit relations for MH II − RH II and M∗ − RH II. The solid colored lines indicate three different feedback mechanisms from Krumholz et al. (2019): supernovae (SNe), direct radiation pressure (DR), and photoionization feedback (ionization), with their corresponding slopes (a = 3, a = 2, and a = 1). The other markers are the same as in Fig. 7. |
and is shown as the solid black line.
We determined the power index N of  to be 2.93 ± 0.12, which is approximately 3.0. This result suggests that the density of the ionized gas remains relatively constant throughout most of the H II regions in NGC 4809/4810. However, we note that the regions around the supernova contain significantly more massive (∼0.5 dex) ionized gas for a given H II size, indicating higher densities in star-forming regions. This finding suggests that certain physical mechanisms, such as winds or shocks from stellar feedback, may compress the ionized gas within these regions. Additionally, we plot the stellar mass–size relation (M∗ − RH II) in the right panel of Fig. 10, and derive a best-fit relation of
 (8)
(8)
To determine the dominant feedback mechanism, we considered three different mechanisms from Krumholz et al. (2019): supernovae (SNe, a = 3), direct radiation pressure (DR, a = 2), and photoionization feedback (ionization, a = 1), where a is the slope of the relation log(M/M⊙) = a × log(RH II/pc) + b. Our analysis indicates that the best-fit slope is 1.97 ± 0.18, consistent with the feedback mechanism of direct radiation pressure rather than SNe and photoionization. The average stellar mass surface density (Σ* = M*/(πR)2) is about 13.6 M⊙ pc−2, which is lower than the ΣDR ∼ 340 M⊙ pc−2 derived by Krumholz et al. (2019). Here, ΣDR is the surface density below which direct radiation pressure becomes important. This result indicates that direct radiation pressure rather than photoionization or SNe dominates the ionized gas removal in these H II regions.
We used the velocity dispersion (σv, Hα), ionized gas mass (MH II), and stellar mass in H II regions (M*) to estimate the virial parameter of ionized gas, denoted by αvir. We can calculate  following Bertoldi & McKee (1992), where
  (km s−1)2 is the gravitational constant. We assumed that the mass in the H II regions M is the total mass of the ionized gas and stellar mass, M = MH II + M∗. The virial parameter can be used to test whether the system is dominated by kinetic energy or gravitational potential (e.g., Krumholz & McKee 2005; Kauffmann et al. 2013). If αvir ≫ 2, the regions are dominated by internal pressure (e.g., ionized gas pressure or direct radiation pressure) instead of self-gravity. On the other hand, if αvir < 2, the H II regions are dominated by gravity, meaning that the gas therein is supercritical, unstable, and tends to collapse.
In Fig. 11 we plot the virial parameter versus the SFR surface density (αvir − ΣSFR), with markers colored by stellar mass. The virial parameters of the ionized gas are much larger than 2, indicating that these H II regions are dominated by internal pressure and expand persistently. Furthermore, the virial parameters are negatively correlated with the SFR surface densities, with a best-fit relation of log(αvir) = −0.55 ± 0.07 × log(ΣSFR) + 1.69 ± 0.13. This negative correlation supports the scenario that regions with smaller virial parameters are efficient in forming new stars per unit area. Moreover, the virial parameter decreases as the mass of the H II regions increases. Conversely, the supernova-surrounding regions show much higher viral parameters for a given stellar mass, which might be caused by strong stellar feedback (direct radiation pressure) from the intense star formation activities therein.
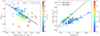 |
Fig. 11. Virial parameter vs. SFR surface density (αvir − ΣSFR) of H II regions (left), colored by stellar mass. The solid line represents the best-fit αvir − ΣSFR relation. Stellar mass surface density – stellar age (Σ* − age) distribution of H II regions (right), colored by SFR surface densities. The solid lines show the best-fit relations of Σ* − age in the two component galaxies NGC 4809 and NGC 4810. The other markers are the same as in Fig. 7. |
In Fig. 11 we present the distribution of the stellar mass surface density – stellar age (Σ∗ − age) for H II regions in the galaxy-merging system of NGC 4809 and NGC 4810. The solid lines represent the best-fit relations of Σ∗ − age in both component galaxies. The relation for NGC 4809 is given by the equation
 (9)
(9)
and the relation for NGC 4810 is given by
 (10)
(10)
Here, Σ* and age are given in units of M⊙ kpc−2 and years, respectively. The power index of the age in NGC 4809 is 1.03, which is close to 1.0, indicating that the stellar mass is expected to increase with stellar age, that is, M* ∝ age, at a fixed area size. This suggests a scenario in which the SFR is constant with time (Krumholz et al. 2019). However, the power index in NGC 4810 is 1.87, which is much higherer than 1.0 and inconsistent with a constant star formation history. This difference in power index indicates that the stellar mass-assembly process in NGC 4810 is more efficient than in NGC 4809. Most of the star formation knots show a young stellar age, that is, they are younger than 100 Myr, indicating that the galaxy-merging system has created stars in the past 100 Myr. This is consistent with the time at which star formation is triggered by the interaction of galaxies. Additionally, the regions in the interaction area and the supernova-surrounding regions show relatively higher stellar mass surface densities at a given stellar age, confirming their higher star formation activities.
To compare the efficiency of stellar mass assembly in different systems, we present the relation between stellar mass surface density and SFR surface density colored by their stellar ages, as shown in the left panel of Fig. 12. We also present the histogram of the stellar ages of these star formation knots in the right panel of Fig. 12. It is important to note that the stellar ages in NGC 4810 are consistently younger than those in NGC 4809, with median log(age/yr) values of 7.3 and 7.8, respectively. We suggest a possible scenario in which the interaction first destabilized the molecular gas cloud in NGC 4809, triggering star formation, and then enriches the metallicity of ISM by stellar activities (e.g., supernovae or winds) in the past 100 Myr to 30 Myr. Subsequently, the interaction likely transported significant amounts of metal-enriched molecular and ionized gas into NGC 4810, thereby stimulating the more efficient creation of new stars at a shorter timescale of 30 Myr to 10 Myr. Then these stellar activities create and eject metal into the surrounding ISM. The metal-richer ISM in NGC 4810 (shown at the N2S2-based metallicity map in Fig. 5) and the more efficient stellar mass assembly process in NGC 4810 (see right panel of Fig. 11) support this scenario. However, future observations of molecular gas are necessary to verify this scenario. For example, the molecular gas mass fraction and its spatial distribution can provide the gas density and star formation efficiency (Mgas/SFR, SFE) in these two galaxy components, or even at/around different knots at high spatial resolution scales. Then we can determine whether the average SFE in NGC 4810 is higher than in NGC 4809. The kinematics and dispersion of molecular gas will also shed light on these effects, such as transportation, compression, and disruption, of interaction/merging processes in molecular clouds.
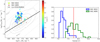 |
Fig. 12. Stellar mass surface density – SFR surface density, Σ* − ΣSFR of the star formation knots (left) in NGC 4809 (marked as stars) and NGC 4810 (marked as pluses), colored by stellar age. The marker sizes are scaled to the knot sizes. Histogram of the stellar ages of the star formation knots (right). The dashed lines represent the median values of log(age/yr), about 7.3 (NGC 4810) and 7.8 (NGC 4809), respectively. |
5. Summary
This study investigated the ionized gas properties and star formation activities in the merging dwarf galaxy system NGC 4809/4810 using VLT/MUSE IFU data. Our main results are listed below.
We identified 112 Hα emission knots within the system NGC 4809/4810 in which the gas ionization is primarily caused by star formation, with a few highly ionized regions likely resulting from high-energy photons emitted by young and massive stars/clusters.
The distribution of the gas-phase metallicity is inhomogeneous in the two galaxies, with a mixture of metal-poor and metal-rich ionized gas. Star-forming knots in the interaction area show a lower metallicity based on the O3N2 and N2S2 diagnostics, which could be due to the dilution by metal-poor gas inflows during the merging process of two dwarf galaxies.
When comparing the SFR of NGC 4809/4810 with that of normal star-forming galaxies and the resolved stellar mass-SFR relation, we find that the interaction area and the ring around the supernova contain the highest SFRs and SFR/rMSR ratios, indicating that the merging process of two dwarf galaxies can trigger star formation activities in the interaction area, even in a metal-poor environment.
The slope of the ionized gas mass-size relation of H II regions is 2.93 ± 0.12, indicating that the ionized gas density is nearly constant. However, the regions around the supernova contain much denser ionized gas. The slope of the stellar mass-size relation is 1.97 ± 0.18, suggesting that direct radiation pressure, rather than photoionization or supernovae, dominates the removal of ionized gas in these H II regions.
The high virial parameters (≫2) of the ionized gas indicate that these H II regions are dominated by internal pressure and expand persistently. The negative correlation between the virial parameters and SFR surface densities supports the scenario that regions with smaller virial parameters are efficient in forming new stars per unit area.
We detect two different relations between stellar mass surface density and stellar age in NGC 4809 and NGC 4810. In NGC 4809, the star formation rate remains constant with time, whereas in NGC 4810, the stellar mass assembly process is more efficient. These might indicate that galaxy interaction first destabilize the molecular gas cloud in NGC 4809, and then transport molecular gas into NGC 4810 and create new stars.
In conclusion, the merging of two dwarf galaxies can induce starburst activities in the interaction areas even though they are located in metal-deficient environments. Our findings shed light on the mechanisms driving starbursts in dwarf galaxies. We recommend performing the submillimeter observations (e.g., NOEMA or ALMA), such as the cold diffuse molecular gas tracer (e.g., CO(1–0), CO(2–1), Gao & Solomon 1999; Kennicutt & Evans 2012) and the warm denser gas tracer (e.g., CO(6–5), HCN(1–0), HCN(4–3), Gao & Solomon 2004; Lu et al. 2014; Zhang et al. 2014; Cao et al. 2018), to investigate the transportation, compression, and disruption of gas clouds, as well as the star formation efficiency in this merging galaxy system. Furthermore, with the successful launch of the James Webb Space Telescope, it will be possible to probe the properties of the small dust grains and polycyclic aromatic hydrocarbons at a scale of < 20 pc (0.25″). This will reveal bubbles/shell-like structures at/around young stars/clusters and interaction areas in which the effect of stellar feedback on the gas consumption, dust creation, and metal enrichment can be studied.
Acknowledgments
We thank the referee very much for careful reading and valuable suggestions. Y.L.G. acknowledges the grant from the National Natural Science Foundation of China (No. 12103023). This work is supported by the National Natural Science Foundation of China (Nos. 12192222, 12192220 and 12121003). We acknowledge the science research grants from the China Manned Space Project with NO. CMS-CSST-2021-A05. G.L. acknowledges the support from the China Manned Space Project (Nos. CMS-CSST-2021-A06, CMSCSST-2021-A07, and the 2nd-stage CSST science project: Investigation of small-scale structures in galaxies and forecasting of observations), the National Natural Science Foundation of China (Nos. 12273036, 11421303), the Fundamental Research Funds for the Central Universities (No. WK3440000005), and the lateral fund from Shanghai Astronomical Observatory (No. EF2030220007). This project makes use of the MaNGA-Pipe3D dataproducts. We thank the IA-UNAM MaNGA team for creating this catalogue, and the Conacyt Project CB-285080 for supporting them.
References
- Allende Prieto, C., Lambert, D. L., & Asplund, M. 2001, ApJ, 556, L63 [Google Scholar]
- Alloin, D., Collin-Souffrin, S., Joly, M., & Vigroux, L. 1979, A&A, 78, 200 [Google Scholar]
- Bacon, R., Accardo, M., Adjali, L., et al. 2010, in Ground-based and Airborne Instrumentation for Astronomy III, eds. I. S. McLean, S. K. Ramsay, H. Takami, et al., SPIE Conf. Ser., 7735, 773508 [Google Scholar]
- Baldwin, A., Phillips, M. M., & Terlevich, R. 1981, PASP, 93, 817 [Google Scholar]
- Belfiore, F., Maiolino, R., Maraston, C., et al. 2016, MNRAS, 461, 3111 [Google Scholar]
- Bell, E. F., McIntosh, D. H., Katz, N., & Weinberg, M. D. 2003, ApJS, 149, 289 [Google Scholar]
- Bertoldi, F., & McKee, C. F. 1992, ApJ, 395, 140 [NASA ADS] [CrossRef] [Google Scholar]
- Bresolin, F. 2019, MNRAS, 488, 3826 [NASA ADS] [Google Scholar]
- Brinchmann, J., Charlot, S., White, S. D. M., et al. 2004, MNRAS, 351, 1151 [Google Scholar]
- Bruzual, G., & Charlot, S. 2003, MNRAS, 344, 1000 [NASA ADS] [CrossRef] [Google Scholar]
- Cairós, L. M., Caon, N., Papaderos, P., et al. 2009, ApJ, 707, 1676 [CrossRef] [Google Scholar]
- Calzetti, D., Armus, L., Bohlin, R. C., et al. 2000, ApJ, 533, 682 [NASA ADS] [CrossRef] [Google Scholar]
- Cao, T., Lu, N., Xu, C. K., et al. 2018, ApJ, 866, 117 [NASA ADS] [CrossRef] [Google Scholar]
- Casasola, V., Bettoni, D., & Galletta, G. 2004, A&A, 422, 941 [NASA ADS] [CrossRef] [EDP Sciences] [Google Scholar]
- Chabrier, G. 2003, PASP, 115, 763 [Google Scholar]
- Cheung, E., Bundy, K., Cappellari, M., et al. 2016, Nature, 533, 504 [NASA ADS] [CrossRef] [Google Scholar]
- Cid Fernandes, R., Mateus, A., Sodré, L., Stasińska, G., & Gomes, J. M. 2005, MNRAS, 358, 363 [Google Scholar]
- Cid Fernandes, R., Stasińska, G., Schlickmann, M. S., et al. 2010, MNRAS, 403, 1036 [Google Scholar]
- Cresci, G., Mannucci, F., & Curti, M. 2019, A&A, 627, A42 [NASA ADS] [CrossRef] [EDP Sciences] [Google Scholar]
- Curti, M., Mannucci, F., Cresci, G., & Maiolino, R. 2020, MNRAS, 491, 944 [Google Scholar]
- Daddi, E., Dickinson, M., Morrison, G., et al. 2007, ApJ, 670, 156 [NASA ADS] [CrossRef] [Google Scholar]
- Dey, A., Schlegel, D. J., Lang, D., et al. 2019, AJ, 157, 168 [Google Scholar]
- Dopita, M. A., Kewley, L. J., Sutherland, R. S., & Nicholls, D. C. 2016, Ap&SS, 361, 61 [NASA ADS] [CrossRef] [Google Scholar]
- Elbaz, D., Leiton, R., Nagar, N., et al. 2018, A&A, 616, A110 [NASA ADS] [CrossRef] [EDP Sciences] [Google Scholar]
- Espada, D., Martin, S., Verley, S., et al. 2018, ApJ, 866, 77 [NASA ADS] [CrossRef] [Google Scholar]
- Fabian, A. C. 2012, ARA&A, 50, 455 [Google Scholar]
- Fang, J. J., Faber, S. M., Salim, S., Graves, G. J., & Rich, R. M. 2012, ApJ, 761, 23 [NASA ADS] [CrossRef] [Google Scholar]
- Gao, Y., & Solomon, P. M. 1999, ApJ, 512, L99 [NASA ADS] [CrossRef] [Google Scholar]
- Gao, Y., & Solomon, P. M. 2004, ApJ, 606, 271 [NASA ADS] [CrossRef] [Google Scholar]
- Gao, Y., Bao, M., Yuan, Q., et al. 2018a, ApJ, 869, 15 [NASA ADS] [CrossRef] [Google Scholar]
- Gao, Y., Wang, E., Kong, X., et al. 2018b, ApJ, 868, 89 [NASA ADS] [CrossRef] [Google Scholar]
- Gao, Y., Gu, Q., Shi, Y., et al. 2022, A&A, 661, A136 [NASA ADS] [CrossRef] [EDP Sciences] [Google Scholar]
- García-Benito, R., & Pérez-Montero, E. 2012, MNRAS, 423, 406 [CrossRef] [Google Scholar]
- Goodman, A. A., Rosolowsky, E. W., Borkin, M. A., et al. 2009, Nature, 457, 63 [NASA ADS] [CrossRef] [Google Scholar]
- Harrison, C. M., Costa, T., Tadhunter, C. N., et al. 2018, Nat. Astron., 2, 198 [Google Scholar]
- Hayes, M., Östlin, G., Schaerer, D., et al. 2013, ApJ, 765, L27 [NASA ADS] [CrossRef] [Google Scholar]
- Heckman, T. M., Sembach, K. R., Meurer, G. R., et al. 2001, ApJ, 558, 56 [Google Scholar]
- Heckman, T. M., Hoopes, C. G., Seibert, M., et al. 2005, ApJ, 619, L35 [NASA ADS] [CrossRef] [Google Scholar]
- Hopkins, P. F., & Quataert, E. 2010, MNRAS, 407, 1529 [Google Scholar]
- Howerton, S., Drake, A. J., Djorgovski, S. G., et al. 2011, Cent. Bureau Electron. Telegrams, 2962, 1 [NASA ADS] [Google Scholar]
- Israel, F. P., Rosenberg, M. J. F., & van der Werf, P. 2015, A&A, 578, A95 [NASA ADS] [CrossRef] [EDP Sciences] [Google Scholar]
- Izotov, Y. I., Stasińska, G., Meynet, G., Guseva, N. G., & Thuan, T. X. 2006, A&A, 448, 955 [CrossRef] [EDP Sciences] [Google Scholar]
- James, B. L., Kumari, N., Emerick, A., et al. 2020, MNRAS, 495, 2564 [NASA ADS] [CrossRef] [Google Scholar]
- Kaasinen, M., Kewley, L., Bian, F., et al. 2018, MNRAS, 477, 5568 [NASA ADS] [CrossRef] [Google Scholar]
- Kauffmann, G., Heckman, T. M., White, S. D. M., et al. 2003, MNRAS, 341, 33 [Google Scholar]
- Kauffmann, J., Pillai, T., & Goldsmith, P. F. 2013, ApJ, 779, 185 [NASA ADS] [CrossRef] [Google Scholar]
- Kehrig, C., Vílchez, J. M., Pérez-Montero, E., et al. 2016, MNRAS, 459, 2992 [NASA ADS] [CrossRef] [Google Scholar]
- Kennicutt, R. C., Jr 1998, ApJ, 498, 541 [Google Scholar]
- Kennicutt, R. C., Jr, & Evans, N. J. 2012, ARA&A, 50, 531 [NASA ADS] [CrossRef] [Google Scholar]
- Kewley, L. J., & Dopita, M. A. 2002, ApJS, 142, 35 [Google Scholar]
- Kewley, L. J., & Ellison, S. L. 2008, ApJ, 681, 1183 [Google Scholar]
- Kewley, L. J., Dopita, M. A., Sutherland, R. S., Heisler, C. A., & Trevena, J. 2001, ApJ, 556, 121 [Google Scholar]
- Kewley, L. J., Groves, B., Kauffmann, G., & Heckman, T. 2006, MNRAS, 372, 961 [Google Scholar]
- Kewley, L. J., Nicholls, D. C., & Sutherland, R. S. 2019, ARA&A, 57, 511 [Google Scholar]
- Kobulnicky, H. A., & Kewley, L. J. 2004, ApJ, 617, 240 [CrossRef] [Google Scholar]
- Krumholz, M. R., & McKee, C. F. 2005, ApJ, 630, 250 [Google Scholar]
- Krumholz, M. R., McKee, C. F., & Bland-Hawthorn, J. 2019, ARA&A, 57, 227 [NASA ADS] [CrossRef] [Google Scholar]
- Kuncarayakti, H., Anderson, J. P., Galbany, L., et al. 2018, A&A, 613, A35 [NASA ADS] [CrossRef] [EDP Sciences] [Google Scholar]
- Kunth, D., & Östlin, G. 2000, A&ARv, 10, 1 [NASA ADS] [CrossRef] [Google Scholar]
- Lagos, P., Telles, E., Muñoz-Tuñón, C., et al. 2009, AJ, 137, 5068 [NASA ADS] [CrossRef] [Google Scholar]
- Li, C., Wang, H.-C., Wu, Y.-W., Ma, Y.-H., & Lin, L.-H. 2020, Res. Astron. Astrophys., 20, 031 [CrossRef] [Google Scholar]
- Lilly, S. J., Carollo, C. M., Pipino, A., Renzini, A., & Peng, Y. 2013, ApJ, 772, 119 [NASA ADS] [CrossRef] [Google Scholar]
- Liu, Q., Wang, E., Lin, Z., et al. 2018, ApJ, 857, 17 [NASA ADS] [CrossRef] [Google Scholar]
- Lu, N., Zhao, Y., Xu, C. K., et al. 2014, ApJ, 787, L23 [Google Scholar]
- Mainzer, A., Bauer, J., Cutri, R. M., et al. 2014, ApJ, 792, 30 [Google Scholar]
- Mannucci, F., Cresci, G., Maiolino, R., Marconi, A., & Gnerucci, A. 2010, MNRAS, 408, 2115 [NASA ADS] [CrossRef] [Google Scholar]
- Marino, R. A., Rosales-Ortega, F. F., Sánchez, S. F., et al. 2013, A&A, 559, A114 [NASA ADS] [CrossRef] [EDP Sciences] [Google Scholar]
- Morisset, C., Delgado-Inglada, G., Sánchez, S. F., et al. 2016, A&A, 594, A37 [NASA ADS] [CrossRef] [EDP Sciences] [Google Scholar]
- Orlitova, I. 2020, ArXiv e-prints [arXiv:2012.12378] [Google Scholar]
- Östlin, G., Hayes, M., Duval, F., et al. 2014, ApJ, 797, 11 [CrossRef] [Google Scholar]
- Pan, H.-A., Lin, L., Hsieh, B.-C., et al. 2019, ApJ, 881, 119 [NASA ADS] [Google Scholar]
- Papadopoulos, P. P., Isaak, K. G., & van der Werf, P. P. 2007, ApJ, 668, 815 [Google Scholar]
- Paudel, S., Smith, R., Yoon, S. J., Calderón-Castillo, P., & Duc, P.-A. 2018, ApJS, 237, 36 [Google Scholar]
- Peng, Y.-J., Lilly, S. J., Kovač, K., et al. 2010, ApJ, 721, 193 [Google Scholar]
- Pettini, M., & Pagel, B. E. J. 2004, MNRAS, 348, L59 [NASA ADS] [CrossRef] [Google Scholar]
- Sánchez, S. F., Pérez, E., Sánchez-Blázquez, P., et al. 2016a, Rev. Mex. Astron. Astrofis., 52, 171 [Google Scholar]
- Sánchez, S. F., Pérez, E., Sánchez-Blázquez, P., et al. 2016b, Rev. Mex. Astron. Astrofis., 52, 21 [NASA ADS] [Google Scholar]
- Sánchez, S. F., Avila-Reese, V., Hernandez-Toledo, H., et al. 2018, Rev. Mex. Astron. Astrofis., 54, 217 [Google Scholar]
- Shangguan, J., Ho, L. C., Li, R., et al. 2019, ApJ, 870, 104 [NASA ADS] [CrossRef] [Google Scholar]
- Speagle, J. S., Steinhardt, C. L., Capak, P. L., & Silverman, J. D. 2014, ApJS, 214, 15 [Google Scholar]
- Spence, R. A. W., Tadhunter, C. N., Rose, M., & Rodríguez Zaurín, J. 2018, MNRAS, 478, 2438 [NASA ADS] [CrossRef] [Google Scholar]
- Steffen, J. L., Fu, H., Comerford, J. M., et al. 2021, ApJ, 909, 120 [NASA ADS] [CrossRef] [Google Scholar]
- Stierwalt, S., Besla, G., Patton, D., et al. 2015, ApJ, 805, 2 [NASA ADS] [CrossRef] [Google Scholar]
- Teklu, B. B., Gao, Y., Kong, X., Lin, Z., & Liang, Z. 2020, ApJ, 897, 61 [NASA ADS] [CrossRef] [Google Scholar]
- Tremonti, C. A., Heckman, T. M., Kauffmann, G., et al. 2004, ApJ, 613, 898 [Google Scholar]
- Yao, Y., Chen, G., Liu, H., et al. 2022, A&A, 661, A112 [NASA ADS] [CrossRef] [EDP Sciences] [Google Scholar]
- Zaragoza-Cardiel, J., Font, J., Beckman, J. E., et al. 2014, MNRAS, 445, 1412 [CrossRef] [Google Scholar]
- Zhang, Z.-Y., Gao, Y., Henkel, C., et al. 2014, ApJ, 784, L31 [NASA ADS] [CrossRef] [Google Scholar]
- Zhang, H.-X., Paudel, S., Smith, R., et al. 2020a, ApJ, 891, L23 [CrossRef] [Google Scholar]
- Zhang, H.-X., Smith, R., Oh, S.-H., et al. 2020b, ApJ, 900, 152 [NASA ADS] [CrossRef] [Google Scholar]
- Zou, H., Gao, J., Zhou, X., & Kong, X. 2019, ApJS, 242, 8 [Google Scholar]
All Figures
|
Fig. 1. Pseudo-color image of NGC 4809 (north component) and NGC 4810 (south component) combined with the r-, i-, and y-band images from the HSC-SSP (left panel). The white rectangles indicate the two FoV regions observed by MUSE. The red star represents the supernova SN2011jm. Integrated-intensity map of the attenuation-corrected Hα emission (right panel). The circles represent the identified Hα knots detected by Astrodendro. The red circles represent these knots around SN2011jm, and the blue circles show these knots in the interaction area of the two galaxy components. We also label the IDs of some large knots. |
| In the text | |
|
Fig. 2. Integrated-intensity maps of four emission lines. [O III] λ5007 (top left), [N II] λ6583 (top right), [S II] λ6731 (bottom left), and [O I] λ6300 (bottom right) are shown after correcting for attenuation. The circles indicate the locations of the identified star formation knots, which are the same as in Fig. 1. |
| In the text | |
|
Fig. 3. Spatially resolved BPT diagrams (left) of NGC 4809/4810 and their corresponding spatial distribution (right), obtained from the attenuation-corrected integrated intensity maps. The solid, dashed, and dotted lines in the [N II]-based BPT diagram are the demarcation curves that separate star formation, AGNs, and Low Ionization Nuclear Emission Regions (LINERs) as defined by Kauffmann et al. (2003), Kewley et al. (2001), and Cid Fernandes et al. (2010), respectively. In the [O I]-based BPT diagram, the solid and dashed lines separate star-forming galaxies, Seyfert galaxies, and LINERs as defined by Kewley et al. (2001, 2006). Regions dominated by star formation, AGN-type ionization, and LINERs are marked in blue, red, and green, respectively. |
| In the text | |
|
Fig. 4. Velocity (left panel) and velocity dispersion (right panel) maps of the Hα and [O III] λ5007 emission lines, respectively. The velocity dispersion was obtained by enforcing single-Gaussian profile fitting. The gray contours in the Hα velocity map represent velocity levels of −70, −35, 0, 35, and 70 km s−1. |
| In the text | |
|
Fig. 5. Gas-phase metallicity distributions of NGC 4809/4810 determined by two calibrators, O3N2 (left) and N2S2 (right). |
| In the text | |
|
Fig. 6. Maps of the SFR surface density (ΣSFR, left panel) and the ratios (right panel) of ΣSFR and the spatial resolved main-sequence relation in nearby star-forming galaxies from the MaNGA survey (rMSR; Liu et al. 2018). |
| In the text | |
|
Fig. 7. Spatially resolved main-sequence relation (rMSR) between the surface density of stellar mass (Σ*) and the surface density of star formation rate (ΣSFR) for star-forming knots in NGC 4809/4810. The sizes of the markers correspond to the sizes of the knots, and their colors indicate their gas-phase metallicity values determined by O3N2 (left panel) and N2S2 (right panel) diagnostics. The gray contours and the solid black line represent the distribution of normal star-forming galaxies and their rMSR obtained by Liu et al. (2018) from the MaNGA survey, respectively. We also provide the star formation knots around SN2011jm (red edgecolors) and at the interaction area (blue edgecolors), which are the same as in Fig. 1. The dashed lines represent different specific star formation rate (sSFR, ΣSFR/Σ*) levels. |
| In the text | |
|
Fig. 8. Spatially resolved fundamental metallicity relation (rFMR, Σ* − Z − ΣSFR) of star formation knots in NGC 4809/4810. The combined quantity μα is defined as log(Σ*) − αlog(ΣSFR). We adopt the α = 0.32, which is same to previous studies (e.g., Mannucci et al. 2010; Yao et al. 2022). The solid lines represent the best-fit relations based on orthogonal distance regression (odr). The dashed lines represent the 1σ distribution around the fitted FMR relations. The other markers are the same as in Fig. 7. |
| In the text | |
|
Fig. 9. Spatially resolved main-sequence relation (rMSR) between the surface density of stellar mass (Σ*) and the surface density of star formation rate (ΣSFR) for star-forming knots in NGC 4809/4810. The sizes of the markers correspond to the sizes of the knots. The gray contours indicate the distribution of Σ* and ΣSFR of 54 star-forming galaxy pairs selected by Steffen et al. (2021) in the MaNGA survey. We also provide the star formation knots around SN2011jm (red edgecolors) and at the interaction area (blue edgecolors), which are the same as in Fig. 1. The dashed lines represent different specific star formation rate (sSFR, ΣSFR/Σ*) levels. |
| In the text | |
|
Fig. 10. Relation between the ionized gas mass and size (MH II − RH II) and between the stellar mass and size (M∗ − RH II) for H II regions, color-coded by their SFR surface densities. The solid black lines represent the best-fit relations for MH II − RH II and M∗ − RH II. The solid colored lines indicate three different feedback mechanisms from Krumholz et al. (2019): supernovae (SNe), direct radiation pressure (DR), and photoionization feedback (ionization), with their corresponding slopes (a = 3, a = 2, and a = 1). The other markers are the same as in Fig. 7. |
| In the text | |
|
Fig. 11. Virial parameter vs. SFR surface density (αvir − ΣSFR) of H II regions (left), colored by stellar mass. The solid line represents the best-fit αvir − ΣSFR relation. Stellar mass surface density – stellar age (Σ* − age) distribution of H II regions (right), colored by SFR surface densities. The solid lines show the best-fit relations of Σ* − age in the two component galaxies NGC 4809 and NGC 4810. The other markers are the same as in Fig. 7. |
| In the text | |
|
Fig. 12. Stellar mass surface density – SFR surface density, Σ* − ΣSFR of the star formation knots (left) in NGC 4809 (marked as stars) and NGC 4810 (marked as pluses), colored by stellar age. The marker sizes are scaled to the knot sizes. Histogram of the stellar ages of the star formation knots (right). The dashed lines represent the median values of log(age/yr), about 7.3 (NGC 4810) and 7.8 (NGC 4809), respectively. |
| In the text | |
Current usage metrics show cumulative count of Article Views (full-text article views including HTML views, PDF and ePub downloads, according to the available data) and Abstracts Views on Vision4Press platform.
Data correspond to usage on the plateform after 2015. The current usage metrics is available 48-96 hours after online publication and is updated daily on week days.
Initial download of the metrics may take a while.