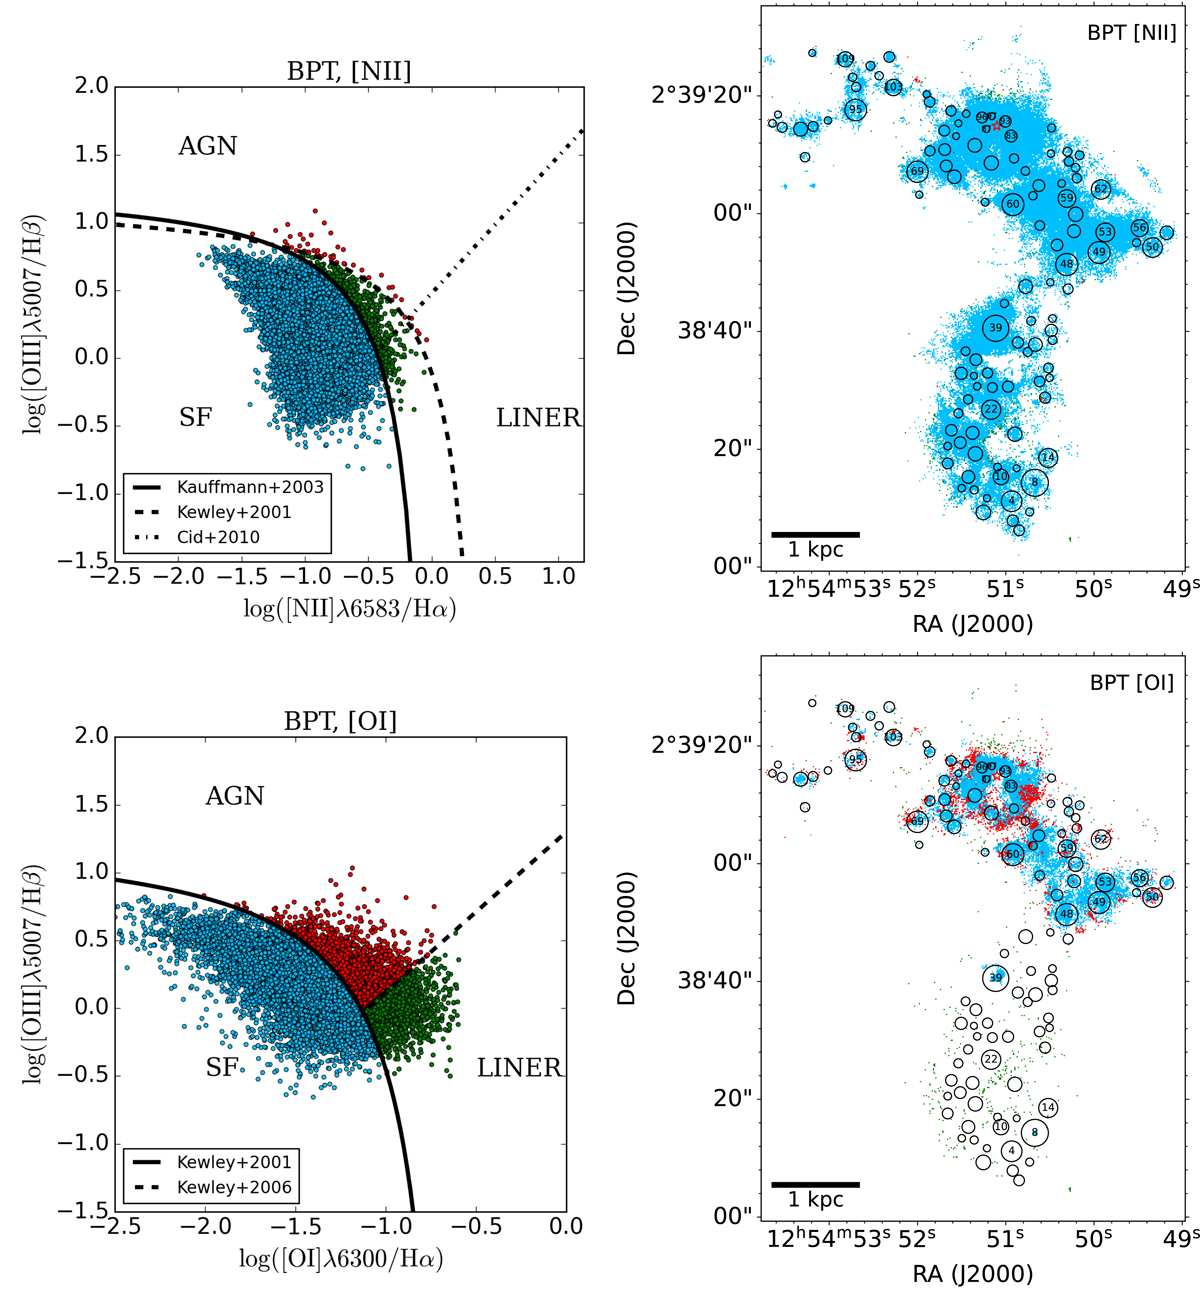
Fig. 3.
Download original image
Spatially resolved BPT diagrams (left) of NGC 4809/4810 and their corresponding spatial distribution (right), obtained from the attenuation-corrected integrated intensity maps. The solid, dashed, and dotted lines in the [N II]-based BPT diagram are the demarcation curves that separate star formation, AGNs, and Low Ionization Nuclear Emission Regions (LINERs) as defined by Kauffmann et al. (2003), Kewley et al. (2001), and Cid Fernandes et al. (2010), respectively. In the [O I]-based BPT diagram, the solid and dashed lines separate star-forming galaxies, Seyfert galaxies, and LINERs as defined by Kewley et al. (2001, 2006). Regions dominated by star formation, AGN-type ionization, and LINERs are marked in blue, red, and green, respectively.
Current usage metrics show cumulative count of Article Views (full-text article views including HTML views, PDF and ePub downloads, according to the available data) and Abstracts Views on Vision4Press platform.
Data correspond to usage on the plateform after 2015. The current usage metrics is available 48-96 hours after online publication and is updated daily on week days.
Initial download of the metrics may take a while.