Open Access
Fig. 4.
Download original image
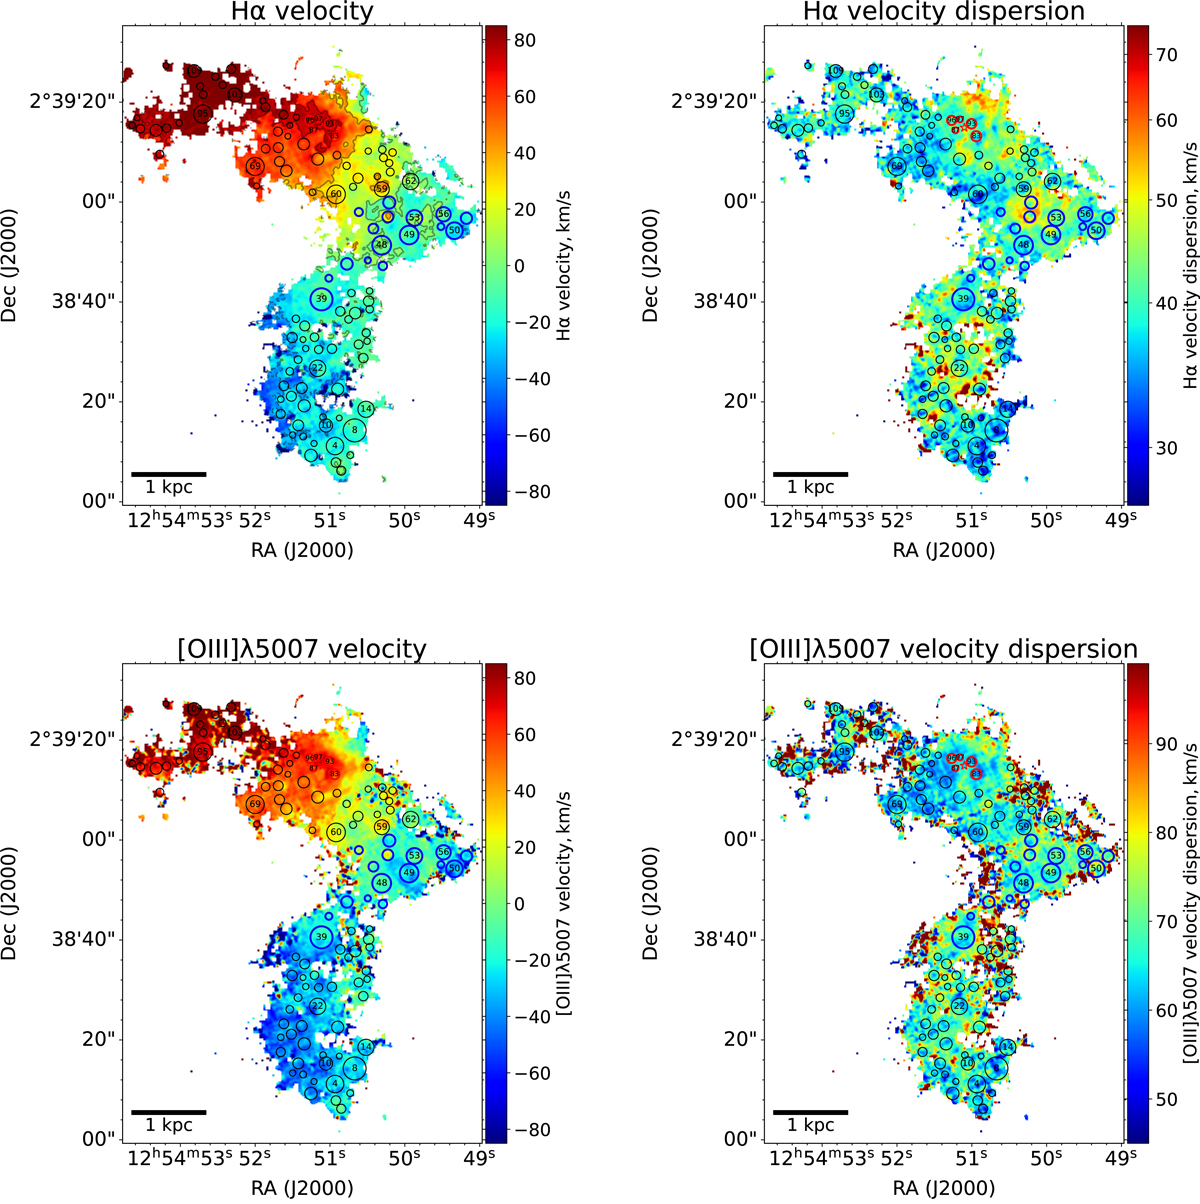
Velocity (left panel) and velocity dispersion (right panel) maps of the Hα and [O III] λ5007 emission lines, respectively. The velocity dispersion was obtained by enforcing single-Gaussian profile fitting. The gray contours in the Hα velocity map represent velocity levels of −70, −35, 0, 35, and 70 km s−1.
Current usage metrics show cumulative count of Article Views (full-text article views including HTML views, PDF and ePub downloads, according to the available data) and Abstracts Views on Vision4Press platform.
Data correspond to usage on the plateform after 2015. The current usage metrics is available 48-96 hours after online publication and is updated daily on week days.
Initial download of the metrics may take a while.