Fig. 7.
Download original image
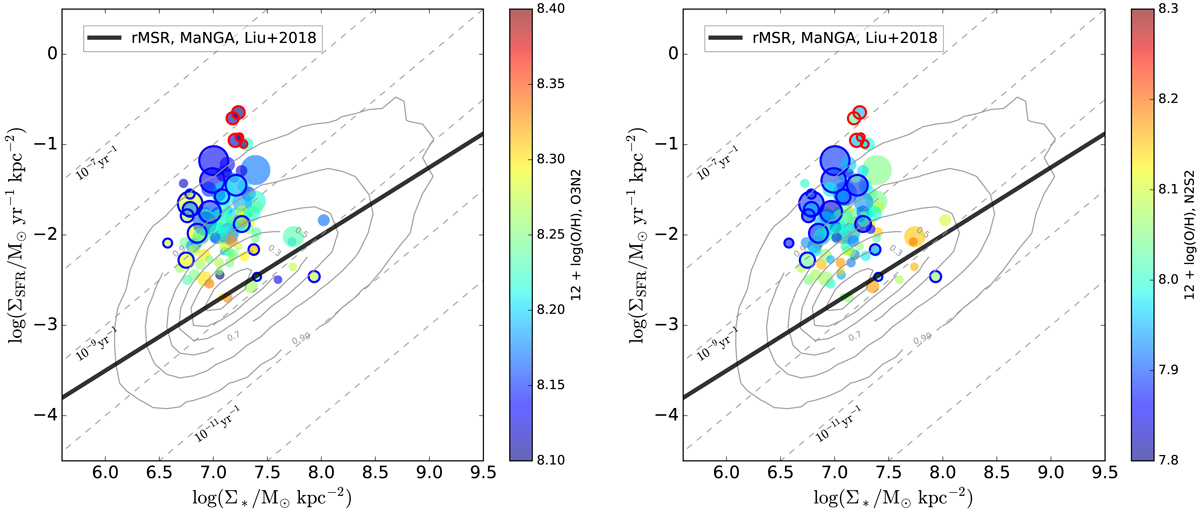
Spatially resolved main-sequence relation (rMSR) between the surface density of stellar mass (Σ*) and the surface density of star formation rate (ΣSFR) for star-forming knots in NGC 4809/4810. The sizes of the markers correspond to the sizes of the knots, and their colors indicate their gas-phase metallicity values determined by O3N2 (left panel) and N2S2 (right panel) diagnostics. The gray contours and the solid black line represent the distribution of normal star-forming galaxies and their rMSR obtained by Liu et al. (2018) from the MaNGA survey, respectively. We also provide the star formation knots around SN2011jm (red edgecolors) and at the interaction area (blue edgecolors), which are the same as in Fig. 1. The dashed lines represent different specific star formation rate (sSFR, ΣSFR/Σ*) levels.
Current usage metrics show cumulative count of Article Views (full-text article views including HTML views, PDF and ePub downloads, according to the available data) and Abstracts Views on Vision4Press platform.
Data correspond to usage on the plateform after 2015. The current usage metrics is available 48-96 hours after online publication and is updated daily on week days.
Initial download of the metrics may take a while.