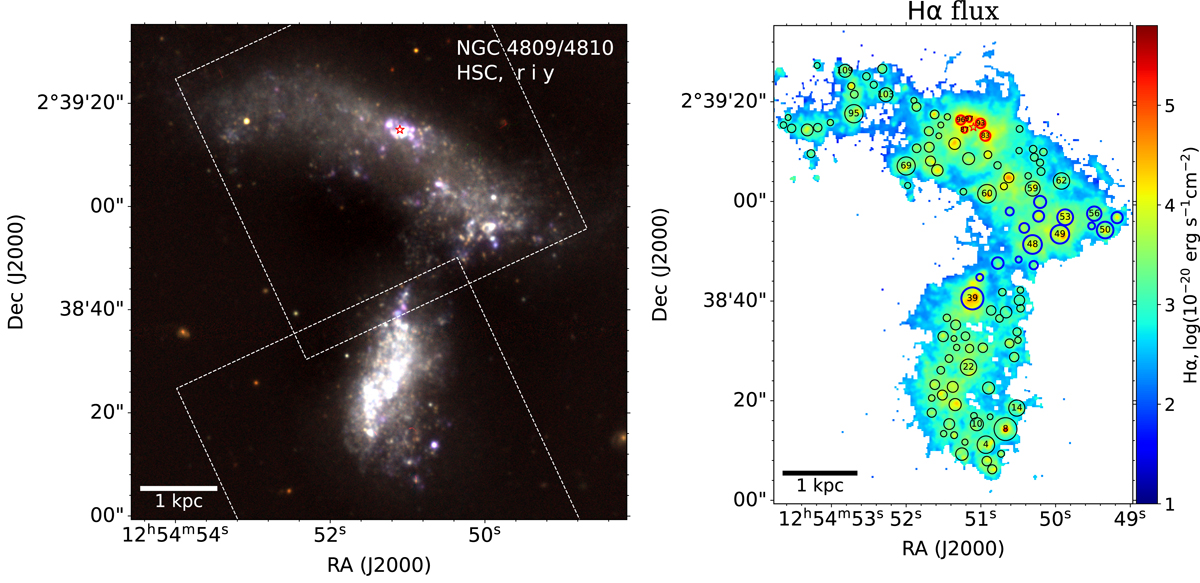
Fig. 1.
Download original image
Pseudo-color image of NGC 4809 (north component) and NGC 4810 (south component) combined with the r-, i-, and y-band images from the HSC-SSP (left panel). The white rectangles indicate the two FoV regions observed by MUSE. The red star represents the supernova SN2011jm. Integrated-intensity map of the attenuation-corrected Hα emission (right panel). The circles represent the identified Hα knots detected by Astrodendro. The red circles represent these knots around SN2011jm, and the blue circles show these knots in the interaction area of the two galaxy components. We also label the IDs of some large knots.
Current usage metrics show cumulative count of Article Views (full-text article views including HTML views, PDF and ePub downloads, according to the available data) and Abstracts Views on Vision4Press platform.
Data correspond to usage on the plateform after 2015. The current usage metrics is available 48-96 hours after online publication and is updated daily on week days.
Initial download of the metrics may take a while.