Fig. 10.
Download original image
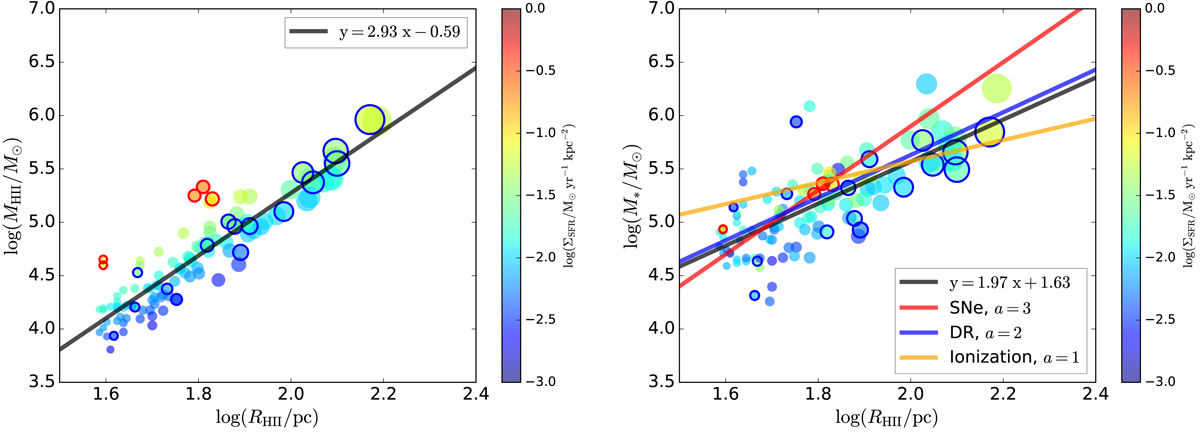
Relation between the ionized gas mass and size (MH II − RH II) and between the stellar mass and size (M∗ − RH II) for H II regions, color-coded by their SFR surface densities. The solid black lines represent the best-fit relations for MH II − RH II and M∗ − RH II. The solid colored lines indicate three different feedback mechanisms from Krumholz et al. (2019): supernovae (SNe), direct radiation pressure (DR), and photoionization feedback (ionization), with their corresponding slopes (a = 3, a = 2, and a = 1). The other markers are the same as in Fig. 7.
Current usage metrics show cumulative count of Article Views (full-text article views including HTML views, PDF and ePub downloads, according to the available data) and Abstracts Views on Vision4Press platform.
Data correspond to usage on the plateform after 2015. The current usage metrics is available 48-96 hours after online publication and is updated daily on week days.
Initial download of the metrics may take a while.