Fig. 11.
Download original image
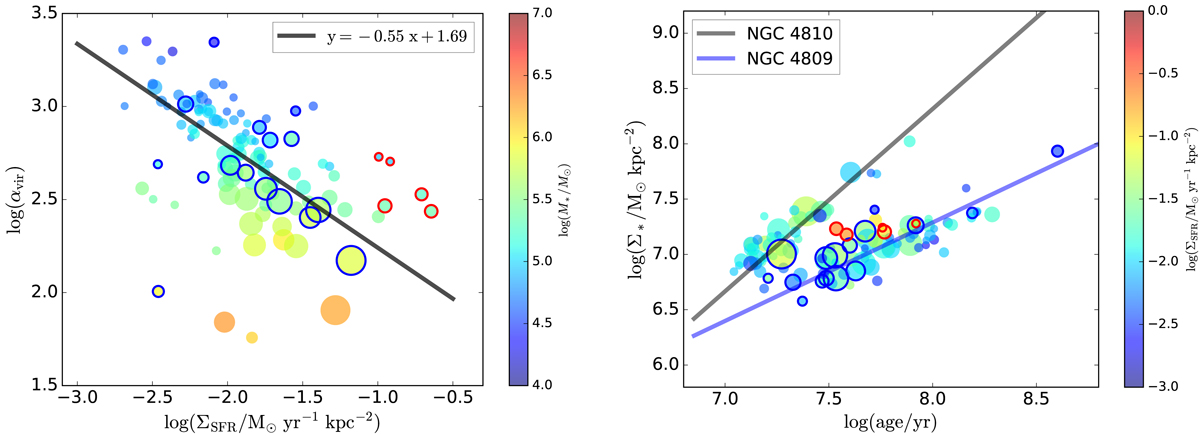
Virial parameter vs. SFR surface density (αvir − ΣSFR) of H II regions (left), colored by stellar mass. The solid line represents the best-fit αvir − ΣSFR relation. Stellar mass surface density – stellar age (Σ* − age) distribution of H II regions (right), colored by SFR surface densities. The solid lines show the best-fit relations of Σ* − age in the two component galaxies NGC 4809 and NGC 4810. The other markers are the same as in Fig. 7.
Current usage metrics show cumulative count of Article Views (full-text article views including HTML views, PDF and ePub downloads, according to the available data) and Abstracts Views on Vision4Press platform.
Data correspond to usage on the plateform after 2015. The current usage metrics is available 48-96 hours after online publication and is updated daily on week days.
Initial download of the metrics may take a while.