| Issue |
A&A
Volume 675, July 2023
|
|
|---|---|---|
| Article Number | A25 | |
| Number of page(s) | 32 | |
| Section | Atomic, molecular, and nuclear data | |
| DOI | https://doi.org/10.1051/0004-6361/202346645 | |
| Published online | 28 June 2023 | |
Photodissociation and photoionization of molecules of astronomical interest
Updates to the Leiden photodissociation and photoionization cross section database★
1
LISA UMR 7583 Université Paris-Est Créteil and Université de Paris, Institut Pierre et Simon Laplace,
61 Avenue du Général de Gaulle,
94010
Créteil, France
e-mail: hhrodmarsson@lisa.ipsl.fr
2
Laboratory for Astrophysics, Leiden Observatory, Leiden University,
PO Box 9513,
2300 RA
Leiden, The Netherlands
e-mail: hrodmarsson@strw.leidenuniv.nl
3
Leiden Observatory, Leiden University,
PO Box 9513,
2300 RA
Leiden, The Netherlands
e-mail: ewine@strw.leidenuniv.nl
4
Max-Planck-Institut für Extraterrestrische Physik,
Giessenbachstrasse 1,
85748
Garching, Germany
Received:
13
April
2023
Accepted:
16
May
2023
Context. Vacuum-ultraviolet (VUV) photons are important drivers of chemical processes in space. Thus, it is important to accurately characterize and constrain photorates in different radiation fields, via the photodissociation and photoionization cross sections of individual atoms and molecules. These have been available in the Leiden VUV photodissocation and photoionization cross section database.
Aims. Experimental and theoretical advances in the past decade or so have allowed multiple new cross sections to be obtained, particularly photoionization cross sections of radicals. The database is hereby updated by including these more recent cross sections and is also expanded with several astronomically relevant species.
Methods. The cross sections have been used to calculate photodissociation and photoionization rates in several different radiation fields as well as from cosmic-ray-induced VUV fluxes. The reduction of rates in shielded regions was calculated as a function of dust, molecular and atomic hydrogen, atomic carbon, and self-shielding column densities. The relative importance of these shielding types is molecule and atom dependent, as well as the assumed dust absorbance. All the data are publicly available from the Leiden VUV cross section database.
Results. The Leiden VUV cross section database has been updated with 14 new astrophysically relevant molecular species and 16 updates to previous entries. The database update is accompanied by a brief review of the basic physical processes, particularly photoionization processes which have not been reviewed in the context of previous database updates.
Key words: molecular data / ISM: molecules / photon-dominated region (PDR) / cosmic rays / dust, extinction / ultraviolet: ISM
Leiden photodissociation and photoionization cross section database: https://home.strw.leidenuniv.nl/~ewine/photo/
© The Authors 2023
 Open Access article, published by EDP Sciences, under the terms of the Creative Commons Attribution License (https://creativecommons.org/licenses/by/4.0), which permits unrestricted use, distribution, and reproduction in any medium, provided the original work is properly cited.
This article is published in open access under the Subscribe to Open model. Subscribe to A&A to support open access publication.
1 Introduction
At the time of writing, almost a century has passed since the first propositions that atomic and molecular abundances in interstellar environments are governed by photodissociation and photoionization processes (Eddington 1928). Today it is indeed apparent that vacuum-ultraviolet (VUV) radiation is undeniably an important driver of chemical reactions in space. The VUV regime is characterized by photons with wavelengths in the 10–200 nm range which can only propagate under vacuum (hence the name); however more importantly, VUV photons possess the unique energetic quanta capable of breaking molecular bonds and/or ionizing atoms and molecules. These characteristic photodissociations and photoionizations are both species- and wavelength-dependent, and hence, VUV-driven photodissociation and photoionization processes have been accumulated and database-formatted for wide usage in the astrochemical community. These are the principle parameters when it comes to quantifying photodestruction rates (or photorates) of molecules in different interstellar or galactic environments, which makes their implementation crucial not only in astrochemical modeling (van Dishoeck 1988; Gredel et al. 1989; Roberge et al. 1991; van Dishoeck et al. 2006; van Dishoeck & Visser 2015; Heays et al. 2017), but in combustion science as well where on average larger molecules such as hydrocarbons and complex organic molecules are typically implemented (Kameta et al. 2002; Yang et al. 2012; Keller-Rudek et al. 2013).
Recent advances in the field of astrochemistry, molecular astrophysics, and atmospheric science have allowed our understanding of molecular complexity in space to reach a veritable golden age. These fields are currently flourishing as the rate of new molecule detections has been accelerating for the past few years where a few new annual detections in the 2000s and 2010s have ballooned to tens of new detections annually in the 2020s (McGuire 2022). Thanks to dedicated large-scale facilities such as the Large Atacama Millimeter/submillimeter Array (ALMA), improvements in data treatments such as spectral stacking methods (Loomis et al. 2021), and dedicated deep surveys at long wavelengths such as GOTHAM (McGuire et al. 2020) and QUIJOTE (Agúndez et al. 2015; Cernicharo et al. 2021a), the previously large thresholds that were required to be overcome in order to detect a molecule have been significantly decreased.
Accommodating new molecules in astrochemical models is a titanic task requiring an enormous amount of reaction rates. The previous update of the Leiden VUV cross section database (Heays et al. 2017) collected photodissociation and photoionization cross sections for 102 atoms and molecules of astronomical interest. These were used to calculate dissociation and ionization rates under different radiation fields (including cosmicrays) both with and without dust attenuation. An update to the database is timely to meet the data needs of the ever-growing astrochemical user community, which also presents an opportunity to highlight recent experimental and theoretical advances that have allowed cross sections of (in particular) radicals to be measured in absolute terms and will continue to produce datasets relevant to interstellar photoprocesses.
Experimental and theoretical advances have allowed cross sections of challenging species to have been measured and computed. New developments at large-scale synchrotron facilities such as SOLEIL (Nahon et al. 2012), Swiss Light Source (SLS; Johnson et al. 2009), and the Advanced Light Source (ALS; Heimann et al. 1997) in double-imaging photoelectron photoion coincidence (i2PEPICO) spectroscopy (Garcia et al. 2013; Tang et al. 2015b; Baer & Tuckett 2017), coupled with the facile production of radicals using flow tubes (Garcia et al. 2015), pyrolysis sources (Hemberger et al. 2021, 2022), and reaction chambers (Osborn et al. 2008; Taatjes et al. 2008), have allowed the measurements of wavelength-dependent absolute photoionization cross sections of radicals (Dyke 2019), and recent theoretical advances have allowed photodissociation cross sections of diatomics to be computed at high temperatures (Pezzella et al. 2021).
Ultraviolet (UV) radiation is mostly produced by very hot objects in our Universe, principally stars in various stages of their lifespan. While dark clouds efficiently shield the material therein, cosmic-ray impacts still penetrate the opaque clouds and induce VUV photon emission from electronically excited atomic and molecular hydrogen (Prasad & Tarafdar 1983; Gredel et al. 1989; Caselli & Walmsley 2001). The cloud edges, however, are subject to irradiation by far-UV (FUV) photons with energies of 6–13.6 eV (91–207 nm) as photons with energies above 13.6 eV (the ionization threshold of hydrogen) are quickly scavenged.
In more general terms, clouds of gas and dust in which photodissociation and photoionization are the dominant destruction pathways are collectively termed photon-dominated or photodissociation regions (PDRs; Tielens & Hollenbach 1985; Wolfire et al. 2022). Therein, the formation and destruction of a large family of molecules is governed by VUV-driven photoprocesses. Chemistry is expedited by the formation of reactive radicals and ions in photodissociation and photoionization processes, respectively (Tielens 2013; van Dishoeck 2014). Thus, PDRs offer a dynamic interstellar laboratory where VUV radiation acts as the ultimate destroyer and creator; breaking down molecules but simultaneously chemically replenishing the region with reactive species.
In giant molecular clouds, EUV photons (with energies above 13.6 eV) can ionize hydrogen and create H II regions such as Eta Carinae and the Tarantula nebulae (Larsson et al. 2012). PDRs surround the H II gas, especially in active star-forming regions whose relatively short lifetimes mean that the embedded chemistry is continually reignited by UV radiation (Harada et al. 2019). These PDRs display a layered structure which manifests as a hot interface between the H II region and PDR where the strong photon flux creates highly reactive ions such as CO+ and HOC+ which are generally good tracers of these environments (Sternberg & Dalgarno 1995; Armijos-Abendano et al. 2020), as well as OH+, NH+, and CH+ (Bruderer et al. 2010; Benz et al. 2011). Other species such as c-C3H2 and C2H can also be found at these interfaces (Rizzo et al. 2005) but they are also reliable tracers of outflow cavity walls (Tychoniec et al. 2021), and the upper atmosphere of the outer disk beyond the edge of the pebble disk of protoplanetary disks where they become more stratified and thus more permeable for UV photons (Bergin et al. 2016).
We are now better equipped than ever before to use chemistry as a tool to understand and trace the multiple stages of star and planet formation, particularly in heavily processed regions such as the so-called Central Molecular Zone (CMZ) where molecules are exposed to energetic phenomena such as shock waves due to the high level of turbulence, intense UV radiation fields from nearby massive stellar clusters, X rays from the central black hole, and are even further enhanced by cosmic ray ionization rates. Some such clouds in CMZ have now been found to be a prolific repository of complex organic molecules (COMs) in the Galaxy (Zeng et al. 2020).
Protoplanetary disks themselves experience strong radiation fields which can be seven orders of magnitude stronger than the interstellar field. This invariably influences the chemical structure of disks, and particularly at high vertical heights, the principle carbon bearer becomes C+ while in the cold midplane, molecules tend to be frozen onto dust grains (Aikawa et al. 2002; Öberg & Bergin 2021).
It is well known that employing accurate photorates significantly affects the chemical structure of disks (Walsh et al. 2012). Recent synergies of models and observations have shown, for example, that HCN and CN are not as good tracers of UV fields and photodissociation-initiated chemistry in disks as previously assumed (Cazzoletti et al. 2018; Bergner et al. 2021), high UV fluxes appear to be required to replicate C2H emission features in several disks (Bergner et al. 2019; Bosman et al. 2021), and that many COMs can survive the passage through disks intact but this requires their photoprocesses to be well constrained (Bergner et al. 2021; Booth et al. 2021). Different stellar types at the respective centers of disks have also been shown to influence the disk chemistry where molecules such as HC3N have been suggested to trace the extent by which the UV field may play an important role in catalyzing the disk chemistry (Bergner et al. 2018).
On the other hand, molecules (and chemistry) can be used to constrain the UV fields in particular regions. For instance, observations of water and other hydrides in high-mass star-forming regions allow us to put constraints on the UV flux from the incumbent protostar, which can be up to a few hundred times the strength of the ISRF (Benz et al. 2016). This is important for constraining the amount of FUV and X rays across the protostellar envelope to trace the full water chemistry. Water chemistry can already be heavily impacted by UV photodissociation in bow-shocks (Tabone et al. 2021) and X-rays have also been shown to impact interstellar water chemistry (Notsu et al. 2021). The UV chemistry is also an important parameter to trace the chemical evolution of methanol in comet-forming zones around low-mass protostars (Drozdovskaya et al. 2014) and unknown or missing UV chemistry has been invoked to account for H, N, O radical species that models cannot account for (Coutens et al. 2019).
Circumstellar envelopes also possess UV-driven chemistry that originates from asymptotic giant branch (AGB), red giant branch (RGB), and supergiant stars that are subject to large mass loss through their stellar wind. The envelope is irradiated both from the central star and the interstellar radiation field, similar to protoplanetary disks, and at larger radii the shielding from dust and molecules gets less effective leading to greater intensity in photoprocesses (Cernicharo et al. 2001; Woods et al. 2003; Li et al. 2016; Decin 2021). The effect depends mainly on the extinction experienced by the UV radiation which is set by the outflow density and its structure, onset of dust extinction, and the intensity of the radiation governed by the stellar radius and blackbody temperature. In high UV outflows, photodissociation and photoionization are faster than two-body reactions which reduces the outflow to a mostly atomic and ionized state. UV photons from stellar or even planetary companions of AGB outflows have furthermore been shown to be capable of influencing the chemistry deep inside their circumstellar envelopes at low mass-loss rates in a clumpy circumstellar medium (as is observed for several AGB stars). These effects become more significant with increased effective temperatures and lower mass-loss rates (Van de Sande & Millar 2022).
UV photons from our Sun are also important to the atmospheres of the planets and moons in the Solar System. Solar photons are responsible for ionizing molecules such as CO2, N2, CO, and O2 in the upper atmosphere of Mars (Haider et al. 2009). On Venus, the UV radiation from the Sun leads to photoionization that is sufficient to create an ionosphere capable of fending off the solar wind (Russell et al. 2006). In the higher layers of Titan’s atmosphere, photoionization produces N+, CH+ (x = 1–4), H+ and most abundantly, N2+, which requires more energetic photons to produce than are available in the ISM. Photoionization processes are the principal ion generation process on Titan’s dayside and a good agreement is found between data recorded on board the Cassini orbiter and purely photochemical ion chemistry models (Robertson et al. 2009).
In the upper atmospheres of exoplanets such as hot Jupiters, photochemical reactions dominate the upper atmosphere where the UV flux is high and the densities are too low for thermo-chemical reactions to dominate (Madhusudhan 2019). The UV flux from the host star may also significantly affect thermal inversions in the atmospheres and it is suggested that high stellar UV fluxes may destroy the molecules responsible for the temperature inversions (Knutson et al. 2010). The chemistry in exoplanetary atmospheres is multiplexed and dependent on multiple other factors besides UV-flux such as pressure, temperature and composition (Madhusudhan et al. 2016; Tinetti et al. 2018; Venot et al. 2018a,b).
This paper is structured as follows. Section 2 provides background for the wavelength-dependent cross sections and photoprocesses and give an account of recent experimental and theoretical advancements that have allowed recent cross sections to be determined. Section 2 also gives an account of the radiation fields utilized to compute photodestruction rates in this work and a brief description of the dust and molecular line shielding components utilized to derive shielding functions of the computed photorates. Section 2 concludes with a description of the cosmic-ray ionization derived photorates and a brief account of the effects of temperature on cross sections and caveats concerning the applicability of the cross sections for exoplanet atmospheres. Section 3 gives an overview of all the updated cross sections in the database. And Sect. 4 is devoted to a discussion of the updates and prospects for the future.
2 Methods
2.1 Cross sections
The wavelength-dependent photoabsorption cross section, σ(λ), describes the expected rate of photoabsorption per spectral unit of an isolated molecule or atom in a photon-intensity normalized radiation field. Effectively, the cross section is a descriptor of the complex photoexcitation dynamics in molecules that are accessed via electronically excited states. Having the dimension of an area (frequently in the units of cm2 orMb which equals 10−18 cm2), the cross section can be related to the optical depth (τ) via τ = Nσ, where N is the column density.
After absorbing a VUV photon, a molecule in an electronically excited state may decay by several channels, each of which needs to be accounted for and quantified for an appropriate description of the VUV-induced photodynamics. For an electronically excited polyatomic molecule ABC*, the different processes include: (i) photodissociation (ABC* → A + BC/AB + C/AC + B), photoionization (ABC* → ABC+ + e−), and nondestructive emission (ABC* → ABC + hv). Photodissociation processes relevant to astrophysics and astrochemistry have been outlined in detail previously and we refer the reader to previous overviews and reviews (van Dishoeck 1988; Kirby & Van Dishoeck 1989; van Dishoeck & Visser 2015; Heays et al. 2017).
Briefly, photodissociation processes are split intothe following: (i) direct dissociation which generally yields a broad absorption cross section, typically peaking at values of 10−18−10−17 cm2; as well as (ii) direct and (iii) indirect predissociation, which typically yield more structured cross sections typifying the vibrational profiles of the electronically (bound) excited states which decay via state interactions with dissociative states. Typical intensities of predissociative states are usually higher than that of (directly) dissociative states and typical values are around 10−16 cm2, but these are significantly varied. Finally, (iv) spontaneous radiative dissociation is where a bound state radiates back into the vibrational continuum of a lower state with line-dependent probability. For H2, this is the dominant photodissociation pathway (Stecher & Williams 1967) and peak cross sections may reach 10−14 cm2 over a width of less than 0.1 nm, making the cross section highly structured.
Since many of the database updates outlined below concern new photoionization cross sections, it is worth formulating valence photoionization processes a bit further noting that several literature reviews of valence photoionization processes are available (Hatano 1999a,b, 2001; Dyke 2019). The excitation processes that are most relevant above the ionization energy (IE) of a molecule AB can be summarized as follows:
AB + hv → AB+ + e− (i) Direct ionization
AB + hv → A+ + B + e− (ii) Dissociative ionization
AB + hv → AB** (iii) Superexcitation
AB** → AB+ + e− (iv) Autoionization
AB** → A + B (v) Dissociation
AB** → … (vi) Others.
When a molecule AB receives energy which is larger than its IE, AB may be directly ionized (AB+) or it could be excited to form (AB**) which was named by Platzman as a superexcited molecule (Platzman 1962). If the absorbed photon energy exceeds the sum of the IE and the dissociation threshold of the ion, the molecule can undergo dissociative photoionization (A+ + B).
The superexcited molecule (AB**) can ionize (AB** → AB+ + e−), which gives rise to autoionizing resonances which typically manifest as strong and discrete peaks in photoionization cross sections. Most superexcited states are assigned to high Rydberg states which are vibrationally (and/or rotationally), doubly, or inner-core excited, and converge to each of the electronically excited states of the ion. Superexcited states can also lead to neutral dissociation (AB** → A + B) as well as ion-pair formation (AB** → A+ + B−). It should be noted that extensive studies of ion-pair formation have revealed that its cross sections are much smaller than those of photodissociation and (dissociative) photoionization (Mitsuke et al. 1993a,b; Yoshida & Mitsuke 1994, 1996). Dissociation into neutral fragments is competing with autoionization, however, and is of great importance in the observed decay of each state-assigned superexcited molecule (Hatano 1999b).
This competition can be quantified by the photoionization efficiency parameter (or ionization quantum yield), η(λ), which serves as an index for the degree of competition between ionization and dissociation. The η(λ) parameter is often assumed to be unity above the IE threshold but this is demonstrably not the case as it often does not reach unity as high as 10 eV above the first ionization potential (Hatano 2001). Secondly, η(λ) displays significant wavelength-dependent variations which depend on the molecule’s electronic structure (Hatano 1999a, 2001).
2.2 Experimental advances: Photoionization cross sections
During the past decade or so, some significant experimental developments have been successfully utilized to characterize physical chemical characteristics of astronomically relevant molecules, in particular open-shell radical species. In many cases, these instrumental advances have been achieved at (or in collaboration with) synchrotron facilities where a high flux, variable polarization, and tunable wavelengths are accessible in the VUV range. While recent advances with tunable VUV table top light sources have also been spearheaded in recording VUV photodissociation branching ratios (Gao & Ng 2019) and zero-kinetic energy electron (ZEKE) spectroscopy (Harper et al. 2022), the bandwidth achieved with lasers is still too narrow to record absolute cross sections, and their use is better suited at discrete wavelengths to obtain single absolute points which can be used to normalize synchrotron yields.
Studying such reactive species with photoelectron spectroscopy using VUV radiation from an inert gas low-pressure discharge photon source used to be an industry standard (Dyke 1987, 2019). However, using monochromized synchrotron radiation as the photon source allows more information to be obtained on molecular ionic states and the associated photoionization dynamics. Hence it is possible to identify autoionizing resonances, perform angularly resolved photoelectron measurements, and relative band intensities as a function of wavelength, and threshold (or slow) photoelectron spectra (TPES/SPES), can be obtained which involve collecting the near-zero kinetic energy electrons, thus uncovering the spectral fingerprints of cationic states in high resolution (Poully et al. 2010). Among the most prominent experimental techniques employing these state-of-the-art techniques is the double-imaging photoelectron photoion coincidence (i2PEPICO) spectroscopic method (Baer & Tuckett 2017; Hochlaf 2017). This technique involves photoionization of molecules and the acceleration of nascent photoelectrons and photoions in opposite directions with a DC electric field. The photoelectrons pass through a set of lenses for velocity map imaging (VMI; Eppink & Parker 1997), while the photoions pass through a mass spectrometer and both sets of ions are detected with imaging plates where the electrons and ions are detected in coincidence (Continetti 2001), meaning that for each electron signal detected on the electron side, there is a corresponding cation signal detected on the MS-TOF side where both particles originated from the same photoionization event (Osborn et al. 2008; Taatjes et al. 2008; Garcia et al. 2013).
The i2PEPICO technique allows for multiplex detection schemes and the separation of structural isomers by investigating the TPES/SPES that are obtained by integrating the generated photoelectrons with the lowest kinetic energies (Wu et al. 2019). While this isomer separation is expansively applicable to molecular spectra and has been utilized in the detection of multiple molecular species of a particular mass in complex combustion mixtures (Krueger et al. 2014; Felsmann et al. 2015, 2016; Pieper et al. 2018; Hemberger et al. 2020, 2022), including the formation of two- and three-ringed polycyclic aromatic hydrocarbons (PAHs; Mercier et al. 2020; Hemberger et al. 2021), there is a caveat. Namely, the ultimate resolution of TPES/SPES, in general, does not always allow for isomeric discrimination owing to the similar potential energy surfaces between the neutral and cationic forms of some molecules, which leads to similarities in the recorded TPES/SPES of some isomers. Hence, there are larger molecules that may have to be disentangled through the excited cationic states. Examples include the anilino and 4-picolyl radicals which are isomers with the same molecular formula (C6H6N) but different geometries (Reusch et al. 2017; Hrodmarsson et al. 2019b). However, these instances of similarities in the TPES/SPES of isomers are very rare in the literature so far.
To record the absolute photoionization cross sections of radicals with the i2PEPICO technique there are a few methods available that have been successfully employed at the DESIRS beamline at the SOLEIL synchrotron (Nahon et al. 2012; Garcia et al. 2013; Tang et al. 2015b), the Chemical Dynamics beamline at the ALS (Heimann et al. 1997), and the Vacuum Ultraviolet Beamline at the SLS (Johnson et al. 2009; Bodi et al. 2012). On the DESIRS beamline at SOLEIL, a flow-tube reactor has been coupled to the on-site i2PEPICO instrument (Garcia et al. 2015) while both at the Chemical Dynamics beamline at ALS and the Vacuum Ultraviolet Beamline at SLS, different types of reactors or pyrolysis sources employing a series of gas phase reaction schemes have allowed the recording of absolute photoionization cross sections of multiple species (Taatjes et al. 2008; Osborn et al. 2008; Holzmeier et al. 2016; Rosch et al. 2021; Pan et al. 2022).
The flow-tube contraption at DESIRS employs a MW discharge to create reactive F radicals that effectively abstract H-atoms from appropriate precursors to form the radicals of interest. The photoionization efficiency (or the total ion yield) is then measured by collecting all the coincident ion events for a particular mass species and is integrated as a function of photon energy or wavelength. To obtain the absolute photoionization cross section, a series of measurements are performed where the decrease in the mass signal of a parent species is monitored as well as the mass peak increase in the radical species resulting from the H-abstraction. This allows us to write the ratio of the photoionization cross section of the parent and radical as the ratio of the mass decrease of the parent and the mass increase of the radical (Hrodmarsson et al. 2019b). Thus, the absolute photoionization cross section of the radical can be isolated with the caveat that the accuracy of that cross section is (mostly) limited to that of the parent.
The real breakthrough from coupling the flow-tube to the i2PEPICO scheme to study radicals was twofold. Firstly, ion imaging allows not only the detection of dissociative ionization, but also filtering out the background when using a molecular beam (Tang et al. 2015b). Secondly, the issue of dissociative ion-ization of the precursor can be circumvented to a larger degree in comparison to using pyrolysis and photolysis to produce the radicals from suitable precursors, for instance, halogenated carbohydrates such as fluoro-, chloro-, bromo-, or iodo-hydrocarbons to produce hydrocarbon radicals with either pyrolysis or photolysis (for example, see Robinson et al. 2003; Gans et al. 2010, and references therein). For instance, the appearance energy of the dissociative ionization of CH4 to produce  is around 14.3 eV in comparison to 9.8 eV which is the ionization energy of the methyl radical (CH3). That means that there is a window spanning over 4 eV where the ionization cross section of CH3 can be recorded without interference from the dissociative ionization of the CH4 precursor. In comparison to the aforementioned halomethanes, only a less than 2 eV window is available to study the photoionization of CH3 before
  signals from the dissociative ionization of the parent, CH3X (X = F, Cl, Br, I), start mixing with the CH3 signals (Gans et al. 2010; Tang et al. 2014, 2015a, 2016).
At the Chemical Dynamics beamline at the ALS, the preferred method of forming the radicals of interest involves laser flash photolysis of appropriate precursors in a slow flow reactor. Photolysis is achieved with an excimer laser propagated along the reactor axis, collinear with the gas flow. Products are analyzed with a Multiplexed Photoionization Mass Spectrometer (MPIMS). The absolute photoionization cross sections can then be obtained relative to a reference species using gas mixtures with known concentrations of both species (Dodson et al. 2015).
2.3 Theoretical advances: Photodissociation cross sections
All the fundamental information about a molecule’s photodestruction can be revealed by the molecule’s wavefunction, f, which is the solution of the time-independent Schrödinger equation
 (1)
(1)
where x denotes the spatial and spin coordinates of the n electrons in the molecule and R denotes the positions of all N nuclei in the molecule. The total Hamiltonian, H, consists of the sum of the kinetic energy operators of the nuclei α and the electrons and all their potential energies due to mutual interactions. As the mass of atomic nuclei is much larger than that of electrons, the Born-Oppenheimer (BO) approximation is frequently used which assumes that the movement of the nuclei with respect to the electrons is negligible. This leads to the separation of nuclear and electronic coordinates:
 (2)
(2)
This separation allows the electronic eigenvalues to be extracted via:
 (3)
(3)
where the electronic energies (Eel) represent the potential energy curves or surfaces of the molecular system. When rovibrational energy levels of a diatomic molecule in a 1Σ± electronic state are treated, the solution represents a well-studied mathematical problem (Simon 2000) for which many efficient numerical methods are available (Yurchenko et al. 2016 and references therein), most notably the iterative Cooley-Numerov method (Noumerov 1924; Cooley 1961; Cashion 1963) which is used in the program LEVEL from Le Roy (2017).
The situation is, however, usually much more complicated. When multiple excited states of varying symmetries are present, there are several sources of angular momentum couplings that need to be considered, such as electronic spin, electron orbital momentum, and molecular rotational motion. Additionally, effects due to hyperfine structure caused by nuclear spin angular momentum and external fields, either electric or magnetic, must be accounted for Qu et al. (2022) as well as some additional consideration in the case of open shell (radical) diatomics that include transition metal atoms (Tennyson et al. 2016a). These multitudes of state interactions cause the BO approximation to break down and it becomes impossible treat each electronic state in isolation. A multitude of studies investigating rovibra-tional electronic state-to-state interactions in diatomics and how they influence the photodissociation dynamics exist and have been compiled in various books (see, for instance, the works of Herzberg 1950; Lefebvre-Brion & Field 1986, 2004; and Brown & Carrington 2003).
Recently a new program, DUO, was developed to solve the coupled nuclear motion problem for diatomic molecules (Yurchenko et al. 2016). The main method of solving the radial equation is called discrete variable representation (DVR) which has been independently applied to the one-dimensional Schrödinger equation (Guardiola & Ros 1982b,a). In this method the R coordinate is truncated to an interval and discretized in a grid of Np uniformly spaced points. This transforms the Schrödinger equation to an ordinary matrix eigenvalue problem where the Np × Np real symmetric Hamiltonian matrix is diagonalized. This method gives a very fast convergence of the calculated energies and wave functions with respect to the number of grid points Np.
By coupling the potential energy curves from DUO with another program developed by the same group, ExoCross (Yurchenko et al. 2018), photodissociation cross sections at various temperatures can be obtained (Pezzella et al. 2021). This methodology has been applied to HF and HCl to obtain high-temperature VUV photodissociation cross sections (Pezzella et al. 2022). This work was very quickly revisited by a different group who used a different transition dipole moment in dealing with one of the electronic transitions in HCl which led to significant differences in the cross sections at high temperatures toward longer wavelengths (Qin et al. 2022). The reasoning behind this choice is that in the work by Pezzella et al., they used a tabulated TDM value published previously (Engin et al. 2012) which appears to have a typographical error. Overall, the results are consistent with what was previously included in the database.
Other notable results making use of DUO include the updated photodissociation cross sections of CS (Xu et al. 2019). In this work, the authors used a coupled-channel Schrödinger equation (CSE) to investigate the predissociation mechanisms of CS where over twenty electronic states were accounted for, but special attention was paid to the B1Σ+ and C1Σ+ states which are found to be strongly predissociative. To calculate the photodissociation cross section they employed the program PyDiatomic (Gibson 2016) which also uses the Numerov method (Johnson 1978).
It is worth briefly noting some recent advances concerning photoionization cross sections. Provided that the electronic structure is known exactly, molecular cross sections can be calculated as described above, but this is only the case for atoms and diatomics. For larger molecules, other approximating methods are required. At photon energies below 30 eV (or above 41 nm), the additivity of atomic photoionization cross sections overestimates the molecular ionization cross sections considerably. Previously, a model inspired by the classical and quantum mechanical sum rules of oscillator strengths has been used to describe photoabsorption and photoionization cross sections which were accurate to 20% on average, for a number of (closed-shell) molecules (Bobeldijk et al. 1994).
More recently, advances using the XCHEM methodology (Marante et al. 2017a,b; González-Vázquez et al. 2023) have not only provided great accuracy in the calculation of total and partial photoionization cross sections, but also photoelectron angular distributions and asymmetry parameters. The basic concept of XCHEM involves using a hybrid Gaussian-B-spline basis (GABS; Marante et al. 2014) combining the usual basis used in bound state calculations, but unsuited to describe the continuum, with a B-spline basis that provides a good description of the highly oscillating continuum wave functions. Besides applications to atomic and diatomic species, it has now been successfully applied to a triatomic molecule, namely H2O (Fernández-Milán et al. 2023).
An interesting future avenue that could expedite experimentally and theoretically obtained cross sections is the use of machine learning algorithms. Recently, machine learning methods were used in combination with differential absorption spectroscopic methods in the VUV to develop predictive capabilities for inferring molecular structure from absorption spectra (Doner et al. 2022). By analyzing 102 absorption spectra of organic molecules such as alkanes, alkenes, ethers, and alcohols, the authors found that optimal determination of molecular structure using machine learning methods is strongly dependent on the absorption region in question. The work provides separate learning models for each molecular classification scheme which enables the identification of multifunctional species with isomerresolved speciation. The application of procedures such as these could significantly expediate cross section data for the dozens of new molecules that are detected annually in space at the time of writing.
2.4 Radiation fields
The rate of photodissociation and photoionization (s−1) per molecule or atom which is exposed to a radiation field of UV radiation is calculated thusly:
 (4)
(4)
where σ(λ) is the wavelength-dependent cross section in question, and I(λ) is the wavelength-dependent UV radiation field intensity summed over all coincidence angles. The radiation fields used are identical to those used previously (Heays et al. 2017) so only a brief summary follows here.
A total of nine different radiation fields have been used with the updated cross sections to calculate photorates to exemplify the variability in photodestruction in differing interstellar environs. The radiation fields utilized are the interstellar radiation field (ISRF) of Draine (1978), the Galactic radiation field estimate of Mathis et al. (1983), blackbody emission spectra at 4000 K, 10 000 K and 20 000 K, the Lyman-α line, the solar emission spectrum (Woods et al. 1996; Curdt et al. 2001), the TW Hya radiation field (France et al. 2014), and a cosmic ray induced UV radiation field which is described in detail below. All radiation fields are normalized to match the energy intensity (∫hcI(λ)dλ/λ) of the Draine field integrated between 91.2 and 200 nm, that is, 2.6 × 10⁻¹⁰ W cm−2. The integrated fluxes of the radiation fields used to compute the photorates when using a 0.001 nm grid are provided in Table A.1 along with the normalization factors required.
2.5 Dust and line shielding
The last database update included shielding functions and gave a detailed overview of the formulations accounting for dust and line shielding (Heays et al. 2017). These calculations are also performed for the updated cross sections, and we present a brief overview of the calculations but refer to the previous work by Heays et al. for a more detailed discussion.
Molecules embedded inside interstellar clouds, protoplanetary disks or other such objects with large densities and a high dust content, are at least partially shielded from VUV radiation. Equation (4) gave the unattenuated photodestruction rate and so to account for the shielding materials in these objects we recalculate the rate as:
![$\int {{\sigma ^{pd}}\left( \lambda \right)exp\left[ { - {\tau _{{\rm{dust}}}}\left( {\lambda ,{N_{{\rm{H + 2}}{{\rm{H}}_2}}}} \right) - \quad \left. {\sum\limits_{x = {\rm{H,}}{{\rm{H}}_2},{\rm{self}}} {{N_X}\sigma _X^{{\rm{abs}}}\left( \lambda \right)} } \right]I\left( \lambda \right)d\lambda .} \right.} $](/articles/aa/full_html/2023/07/aa46645-23/aa46645-23-eq7.png) (5)
(5)
Here, the first exponential term models the VUV absorption by dust as a function of wavelength and the column density of H nuclei (assuming it is proportional to the dust column density). The second exponential term is a summation of the shielding by atomic and molecular species (denoted by X with column density NX) where the most important cases are photoabsorption by H, H2, and self-shielding in the cases of other abundant molecules such as CO and N2.
The rate reduction due to shielding is characterized by the shielding function:
 (6)
(6)
where k0 is the photodestruction rate at the irradiated edge of the shielding region. The calculations here are appropriate for an infinite-slab geometry where the incident (isotropic) radiation is restricted to 2π sr and back-scattered radiation from the shielded region. Modeling dust shielding in other geometries will require more specific radiative transfer calculations than those used here. Shielding functions for photodissociation and photoionization have been calculated for all the species in the database and are available online in tabulated form.
The shielding functions are often plotted as a function of the visual extinction (AV) in an interstellar cloud for simpler use. These can be formulated as one-parameter exponential curves (van Dishoeck et al. 2006):
 (7)
(7)
or second order exponential integrals (Neufeld & Wolfire 2009; Roueff et al. 2014):
 (8)
(8)
A further reduction of the shielding function can be accomplished by introducing an exponential-decay parameter (γfit) and an effective unshielded rate ( ) so that the depth-dependent photodestruction rate is:
 (9)
(9)
which leads to the shielding function:
 (10)
(10)
The values of γE2, γexp, γfit, and  , for both photodissociation and photoionization are tabulated for each updated or added cross section in the database and can be downloaded online.
The dust-shielding-dependent photodissociation and photoionization rates were calculated using the optical properties of a dust population assuming one particular composition and size distribution which were obtained from the mixed grain-size and composition model built, developed and tested by Draine et al. (Draine & Lee 1984; Li & Draine 2001; Weingartner & Draine 2001a,b,c,d; Draine 2003a,b,c; Draine & Tan 2003), specifically their “RV = 3.1” model published online.
The additional terms due to atom and molecule shielding (including self-shielding) are also included. The importance of these shielding parameters were discussed in detail previously (Heays et al. 2017), but notable molecules whose self-shielding effects may have some significant astronomical relevance include N2 (Li et al. 2013), CO (Visser et al. 2009), and H2 (Wolcott-Green & Haiman 2019). H2 shielding is particularly important at atomic-to-molecular transitions in cool low-metallicity, dust-free gas (Sternberg et al. 2021), in alleviating the effect of Lyman-Werner radiation background allowing H2 formation and gas cooling (Nickerson et al. 2018; Skinner & Wise 2020), and it is crucial to accurately estimate the amount of cold dense gas that is available for star formation (Latif & Khochfar 2019). It is also cosmologically relevant to include self-shielding of H2 in simulations of supermassive black hole collapses (Luo et al. 2020).
Atomic shielding is also important, for instance, neutral atomic carbon (C I) can shield and prevent CO photodissociation, thus allowing CO gas content to build up in dust-free disks (Kral et al. 2019; Cataldi et al. 2020) and can also suppress radiation pressure (Kral et al. 2017). In such gas-rich debris disks, CO self-shielding plays an important role as well (Moor et al. 2019). Attenuation of radiation fields by C, Si, and S self-shielding has also been shown to ensure efficient formation of species such as CO, OH, SiO, and H2O in dust-free winds or jets (Tabone et al. 2020).
In and of itself, H2O self-shielding has been shown to be an important component in the ubiquity of water vapor during the early stages of terrestrial planet formation (Bethell & Bergin 2009). More recently, the importance of self-shielding by H2O has been demonstrated to enhance the abundances of species such as C2H2, CTU, HCN, CH3CN and NH3 by over 3 orders of magnitude within the inner 5 AU of disks which could have significant implications for prebiotic chemistry on nascent planets (Duval et al. 2022). Water self-shielding could also enhance the  content high up in the molecular layer of protoplanetary disks which could make
  observable with James Webb Space Telescope (Calahan et al. 2022).
Self-shielding is also found to play an important role in fractionation. In the case of CO, inefficient self-shielding affects CO isotopologue intensity profiles in the disk outer regions (Miotello et al. 2018). In the case of N2, fractionation can be completely dominated by isotope-selective photodissociation (Heays et al. 2014), which impacts the subsequent fractionation of HCN as HCN formation is closely coupled to the UV irradiated surface layers of protoplanetary disks. This leads to the column density ratio of HCN over HC15N in the disk’s inner 100 AU being sensitive to the grain size distribution where for larger grains, self-shielding of N2 becomes more important relative to dust extinction, leading to stronger isotope fractionation (Visser et al. 2018).
Self-shielding has also been theorized to contribute to the ortho-to-para ratio of H2CO observed in proto-brown dwarfs as the two spin isomers display different photodissociation yields. However, this is not confirmed and is considered speculative (Riaz et al. 2019).
2.6 Cosmic ray ionization rates
The astrochemical importance of cosmic rays cannot be overstated (Dalgarno 2006a,b). Cosmic rays penetrate deeper than photons into interstellar clouds, protostellar envelopes, proto-planetary disks, and planetary atmospheres, where they ionize H2 molecules. This ignites a cascade of rescattered electrons which further excite H2 and generate excited H atoms that radiatively decay (Cravens & Dalgarno 1978; Gredel & Dalgarno 1995). Additionally, in dark clouds, cosmic rays are solely responsible for producing atomic hydrogen (Padovani et al. 2018a). This cosmic-ray-triggered photolysis of molecular hydrogen seeds more shaded regions in the universe with smaller bubbles of VUV photons which are absorbed by the embedded material. This UV flux is highly structured with thousands of discrete emission lines between 80 and 170 nm along with continuum emission between 122 and 300nm (Prasad & Tarafdar 1983; Gredel et al. 1987; Cecchi-Pestellini & Aiello 1992). Approximately 15% of the integrated flux is due to Lyman-a emission. This flux has been quantified and here, we compute the cosmic ray ionization-driven photorates of the newly updated cross sections.
The cosmic ray induced UV flux is modeled as a rate of photons generated per unit spectral density per hydrogen nucleus
 (11)
(11)

as the relative abundance of species X with respect to total hydrogen nuclei,  is the rate at which a H2 molecule is ionized by cosmic ray collisions, and, as previously (Heays et al. 2017), denotes the wavelength-dependent probability distribution of generated photons adopted from the work of Gredel et al. (1989).
The value of  is highly uncertain given the “average” rate of cosmic-ray ionization in the ISM (Indriolo & McCall 2012), as well as the fact that it can be very strongly enhanced close to protostars (Ceccarelli et al. 2014; Podio et al. 2014) and supernova remnants (Vaupre et al. 2014). In molecular clouds, it is suggested that the cosmic-ray ionization rate decreases with increasing column densities of the cloud and so can vary from 10−16 for diffuse clouds down to 10−17 s−1 for dense clouds (Padovani et al. 2009; Indriolo & McCall 2012).
However, modeling of the chemistry of the prestellar core L1544 suggests a  value as high as 10−16 s−1, which is an order of magnitude higher than what was previously thought (Ivlev et al. 2019). It has also been found that the cosmic ray ionization rate in high-density environments such as in the inner parts of collapsing molecular clouds or the midplanes of cir-cumstellar disks have higher rates than previously assumed. Tangentially it is important to note that some processes such as stellar winds, the magnetic field structure, and even the chemical make-up can modulate cosmic ray ionization (Cleeves et al. 2013, 2014) and a sub-interstellar cosmic ray ionization rate has been observed in the disk midplane of TW Hya (Cleeves et al. 2015).
The cosmic ray ionization rate does not decline exponentially with increasing column density but follows a more complex behavior because of the interplay of different processes governing the generation and propagation of secondary particles (Padovani et al. 2018b). The same can be said of massive hot cores where the models predict significantly elevated values of  (Barger & Garrod 2020).
Meanwhile, molecular ions such as  (Indriolo 2012), OH+ (Bacalla et al. 2019), H2O+ (Indriolo et al. 2015), and ArH+ (Neufeld & Wolfire 2016) are being used to constrain the cosmic ray ionization rate which can yield values up to 10−15 s−1. At higher densities typical of starless cores, observations of HCO+, DCO+, and CO show that the cosmic ray ionization rate decreases but still displays a spread of two orders of magnitude (
 ) (Caselli et al. 1998; Maret & Bergin 2007; Fuente et al. 2016). Such a spread could be due to incompleteness of chemical models and the configuration of the magnetic field lines (Padovani & Galli 2011; Padovani et al. 2013; Silsbee et al. 2018). More recently, models have been developed estimating the cosmic ray ionization rate using observations of H2D+ and other higher deuterations of
  (Bovino et al. 2020) which have yielded values between
  (Sabatini et al. 2020).
Harmonizing all the variabilities observed in cosmic-ray ionization rates has led to a surge in our understanding the underlying astrophysical processes governing the origins and propagation of cosmic rays. As an example, it has been found that ionization rates measured inside molecular clouds could not be solely due to background cosmic rays, and if the cosmic ray spectrum measured by Voyager 1 is representative of the whole Galaxy, the predicted ionization rate in diffuse clouds fails to reproduce data by 1–2 orders of magnitude (Recchia et al. 2019). This has led researchers to suggest other possibilities that would have to be invoked such as inhomogeneous distribution of cosmic rays in the ISM, cosmic ray sources inside clouds, and others (Phan et al. 2018). Cosmic rays from supernova remnants have also been invoked to be important as they would be discrete sources of cosmic rays so that local spectra of MeV cosmic rays would generally not be representative for spectra elsewhere in the Galaxy (Phan et al. 2021). Other factors may be important for the cosmic ray ionization rate such as how cosmic ray diffusion operates in molecular clouds; through freestreaming or diffusive propagation (Silsbee & Ivlev 2019), and how diffusive shock acceleration can drive high ionization rates and synchrotron emissions toward protostellar sources (Padovani et al. 2016). These and other recent advances and current open questions concerning cosmic rays have recently been reviewed (Padovani et al. 2020; Gabici 2022).
The cosmic ray ionization rate adopted in the database is  . All cosmic ray induced photodestruction rates can be adapted to other values of
  by simple scaling. Other relevant parameters that were assumed are the following: x(H) = 10−4, x(N2) = x(CO) = 10−5, ortho-H2:para-H2 = 0:1. These are equivalent to those used in the previous database update.
Although most cosmic ray generated photons are absorbed by dust grains, there is a fraction that drives photodissociation and photoionization of atoms or molecules, X. This fraction is given by:
 (13)
(13)
Here,  is the photodissociation or photoionization cross section of species X, and the denominator sums the photoabsorption cross sections of all dust and gas species. The probability of a cosmic-ray-generated UV photon being absorbed by a dust grain or any gaseous molecule is wavelength-dependent through the relevant cross sections utilized in Eq. (13).
The rate of a particular photodestruction process for species X due to cosmic ray ionization produced photons is then:
 (14)
(14)
The integration was carried out on a 0.001 nm wavelength grid which sufficiently captures the full details of the cross sections included in the database.
2.7 Temperature effects
The original objective of the database was to provide cross sections to accurately simulate UV-driven photoprocesses in the interstellar medium where temperature effects are negligible. As such, it is worth briefly addressing limitations of the applicability of the data in this database. These concern high-temperatures in certain radiation fields, but these effects are usually molecule dependent and should be assessed on a molecule-to-molecule basis.
As shown in the works of both Pezzella et al. (2022) and Qin et al. (2022), photodissociation rates of HF and HCl under ISRF conditions are negligibly affected by the high-temperature cross sections in comparison to colder temperatures in molecular clouds. As the effects of high temperatures are principally observed as large increases in the cross sections toward longer wavelengths, the photodissociation rates are particularly temperature-sensitive in radiation fields with greater intensities toward longer wavelengths. For instance, under a 4000 K black-body radiation field, the photodissociation rates of HF and HCl derived at excitation temperatures between 0 K and 10 000 K are found to increase negligibly between 0 K and 2000 K, but by two orders of magnitude between 2000 K and 10 000 K (Qin et al. 2022).
In the cases of high-temperature exoplanet atmosphere, a caveat is therefore warranted in using the data from this database. Currently, high-temperature photodissociation cross sections are being computed and compiled in the EXOMOL database (Tennyson et al. 2016b) and UV absorption cross sections at various temperature ranges are being compiled in the HITRAN database (Gordon et al. 2022), but at the time of writing only a handful of high-temperature cross section are available. These temperature dependent limitations have also been discussed in Sect. 8.2 of Heays et al. (2017).
3 Cross section database update
All cross sections that have been added to the database (or updated) are presented. They are plotted in Figs. 1–4 and in each section their newly computed photorates are tabulated for each molecule along with comparisons to older values where applicable in Tables 1–33. In Table 34, an overview of the database updates is presented along with an estimated rating of the uncertainty of the cross sections. We give four ratings: A+, A, B, and C, which correspond to accuracy within 20%, 30%, a factor of 2 and an order of magnitude, respectively. The new cross sections are presented in the same logical order as presented in the previous database update (Heays et al. 2017).
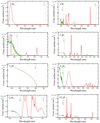 |
Fig. 1 Cross sections of |

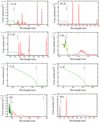 |
Fig. 2 Cross sections of c-C3H and HC3H c-C3H2, C3H3, C4H−,C6H−, OH, and HO2. Photodissociation is presented in red. Photoionization is presented in green. Dissociation and ionization thresholds are shown with broken gray lines. |
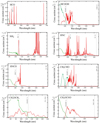 |
Fig. 3 Cross sections of HCO, HCOOH, NH2, HNC, HNCO, CH3CHO, CH3OCH3, and CH3OCHO. Photodissociation is presented in red. Photoionization is presented in green. Dissociation and ionization thresholds are shown with broken gray lines. |
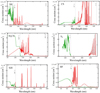 |
Fig. 4 Cross sections of SH, CS, H2CS, S2, SiH, HF. Photodissociation is presented in red. Photoionization is presented in green. Dissociation and ionization thresholds are shown with broken gray lines. |
3.1 
The VUV photodissociation of  has been investigated recently using three-dimensional imaging of the dissociation products (Urbain et al. 2019). The potential energy surfaces of
  exhibit a rich topology which results from the high degree of symmetry imposed by the indiscernibility of the protons, and the asymptotic degeneracy of its fragmentation channels which stems from it. In their seminal work on time-dependent wavepacket propagation, Kulander & Heller computed the photodissociation cross section of H3+ in its absolute ground state (Kulander & Heller 1978) in which they found a maximum around 21 eV that starts growing in above 14eV. This cross section is currently implemented in the database.
The experimental dissociation threshold of  has, however, been measured to be 4.373 eV (283.5 nm) (Cosby & Helm 1988), calculated as 4.349 eV (285.1 nm) (Mizus et al. 2019), and photodissociation of the
  ion has been observed up to 1 eV below the previously obtained thresholds using an ion storage ring (Petrignani et al. 2010). This work by Petrignani et al. (2010) found a photodissociation cross section of 7 × 10⁻²⁰ cm2 at 4.9 eV. If such a cross section is considered by introducing a 7 × 10⁻²⁰ cm2 baseline to the down the dissociation limit of 283.5 nm and from those thresholds assuming that the cross section drops linearly down to 500 nm where a cross section of approximately 3 × 10⁻²¹ cm2 was measured (Petrignani et al. 2010), this would yield significantly increased photorates as presented in Table 1.
Calculated photodissociation rates of H+ and comparisons to current entries in the database.
Calculated photoionization rates of CH and comparisons to previous entries in the database.
Calculated photoionization rates of C2 and comparisons to previous entries in the database.
Calculated photoionization rates of C2H.
Calculated photodetachment rates of C2H−.
Calculated photodissocation & photoionization rates of C2H3.
Calculated photodissociation & photoionization rates of C2H5.
Calculated photoionization rates of 1-C3H.
Calculated photoionization rates of c-C3H.
Calculated photoionization rates of HC3H.
Calculated photoionization rates of c-C3H2.
Calculated photoionization rates of C3H3.
Calculated photodetachment rates of C4H−.
Calculated photodetachment rates of C6H−.
3.2 CH (methylidyne)
In the original publication of the database, an absorption/dissociation cross section of CH is included along with a tentative photoionization cross section. The photodissociation cross section is based on ab initio calculations (van Dishoeck 1987) and the included photoionization cross section was based on a photoelectron spectrum (Barsuhn & Nesbet 1978).
Recently, the photoion efficiency curve of CH was measured by mixing a CH4 precursor diluted in He with F radicals to abstract the H atoms (Gans et al. 2016). As CH was produced by means of a series of exothermic H-abstractions, some of the excess energy populated the v = 1, 2 levels of the neutral ground state, but these contribute negligibly to the measured total ion yield above the ionization threshold which is measured at 10.640 eV (or 116.53 nm).
Recent theoretical calculations on the absolute photoionization cross section have recently been performed (Wang et al. 2021) and these are used to scale the total ion yield measured by Gans et al. Their measurements reach 103.3 nm but display a linear increase in their total ion yields. Here we extrapolate this linear trend upward to 91.2 nm.
3.3 C2 (dicarbon, carbon dimer)
As was the case with methylidyne, the photodissociation cross section of the dicarbon molecule has been computed as the molecule’s absorption spectrum is extremely difficult to measure due to its radical nature. Cross sections were previously computed by Pouilly et al. (1983) but the dissociation energy has been recently been experimentally determined as 50390.5 cm−1 (198.45 nm) (Borsovszky et al. 2021). The ionization energy from the  ground state is 11.866eV (104.49 nm) and from the first excited (a3Πu) state it is 11.790 eV (105.16 nm).
The total ion yield has been recorded by Harper et al. (2020a). It has been scaled so its intensity matches the computed cross section of C2 from the ground state where a maximum of 50 Mb at 14.5 eV (85.5 nm) was found (Toffoli & Lucchese 2004) which is on par with previous calculations (Padial et al. 1985).
3.4 C2H (ethynyl)
The photodissociation cross section of the ethynyl radical was calculated in the work of van Hemert & van Dishoeck (2008). More recently, the ionization threshold of C2H (IE = 11.641 eV = 106.50 nm) and the total ion yield have both been measured from just above threshold up to 12 eV (Gans et al. 2017). Akin to the cross section of CH3, the total ion yield is extended up to 90 nm and scaled to 50 Mb which is comparable to both C2 and C2H2.
3.5 C2H−
Inclusion of anions in astrochemical models has been done by adopting an empirical formula for the photodetachment cross sections which is dependent on the electron affinity of the neutral and the absolute cross section at large photon energies (Millar et al. 2007). The absolute photodetachment cross section of C2H has been measured with 22-pole ion trap technology at several photon energies which allows the construction of the cross sections based on the aforementioned empirical formulas with greater than 10% accuracy (Best et al. 2011).
Calculated photodissociation rates of OH and comparisons to previous entries in the database.
Calculated photoionization rates of OH.
Calculated photoionization rates of HO2.
Calculated photoionization rates of HCO.
3.6 C2H3 (vinyl)
The absorption cross section of the vinyl radical between 225 and 238 nm has been measured by Fahr et al. (1998) who obtain a maximum absorbance of 10 Mb at 225 nm. This is the only recorded cross section of the vinyl radical but an older absorption spectrum of the C2H3 radical was recorded between 360 and 500 nm (Hunziker et al. 1983). Their absorption spectrum has been fitted with several Gaussians and the highest peaks scaled to 10 Mb. The curve measured by Fahr et al. (1998), however, resembles the onset of a Gaussian peak and the curve steepness also compares well with the total ion yield recorded by Garcia et al. (2021). Here we simulate an absorption with a Gaussian using the measurements by Fahr et al. which yields a maximum at 40 Mb around 200 nm. This intensity is comparable to other hydrocarbons in the database although further calculations and measurements of this radical would be of great interest.
Other work relevant to the photodissociation of C2H3 includes a photodissociation study by Ahmed et al. (1999) who found the threshold for photodissociation of C2H3 just above 1 eV (1240 nm). Up to 6 eV (207 nm) they find that the fragments formed involve a H atom and various electronically excited states of the C2H3 planar form or the H2CC molecule. As with other photodissociation cross sections in the database that have been obtained by calculations, a baseline absorption of 0.05 Mb from the dissociation threshold up to the Lyman-a limit at 91.2 nm is added to the simulated cross section.
The adiabatic ionization energy of the vinyl radical has been measured as 8.462 eV (146.5 nm) (Wu et al. 2019). The photoionization of vinyl has been studied to include its first two excited states ( ) and its total ion yield was measured up to 12 eV (103 nm) (Garcia et al. 2021). This total ion yield has been scaled to match the intensity of the cross sections of C2H2, and C2H6 (Cooper et al. 1995; Kameta et al. 1996; Toffoli & Lucchese 2004).
3.7 C2H5 (ethyl)
The ethyl cation,  has been detected with the ROSINA probe on 67P along with
  ,
,  ,
,  , and many others (Beth et al. 2020) and is included here in the database for the first time.
While no absolute photodissociation cross section has been recorded for the ethyl radical, its absorption spectrum was recorded by Munk et al. (1986). They observed a broad absorption centered around 245 nm which originates from an excitation to the 3s Rydberg orbital whilst at smaller wavelengths, the 3p manifold is populated. No VUV absorption measurements have been recorded below 200 nm, but several studies on the photodissociation of C2H5 have been reported which showcase the main dissociation pathway to be the loss of H and then different rearrangements of the C2H4 moiety that are energy-dependent, for instance, the 3s manifold appears to produce ethene whilst the 3p manifold produces CH3CH (Chicharro et al. 2019; Marggi Poullain et al. 2019). In the work of Marggi Poullain et al., they also calculate two more excited states contributing between 200 and 160 nm, namely the  and
and  states which are expected to have onsets at approximately 6.8 eV (182 nm) and 7.2eV (172 nm), respectively. Two absorption peaks are simulated for these states with Gaussians to bridge the gap between the absorption spectrum from Munk et al. and the absolute photoionization cross section of C2H5 which was measured by Gans et al. (2011b). Further measurements and calculations of the photodissociation characteristics of the ethyl radical would be highly valued to validate the modest scaling of the intensity of our simulated photodissociation cross section which reaches 20 Mb at its maximum for dissociation via the
  and
and  states.
Calculated photodissociation & photoionization rates of HCOOH.
Calculated photoionization rates of NH2 and comparisons to previous entries in the database.
Calculated photodissociation & photoionization rates of HNC.
3.8 l-C3H and c-C3H
The photoionization dynamics of C3Hx (x = 0–3) isomers were recently investigated by Garcia et al. (2018) where C3H isomers were produced by means of H abstraction from propyne (CH3CCH) with F radicals. A total ion yield was obtained of C3H isomers, whose signal consisted both of ions of linear and cyclic C3H geometries. By using the slow photoelectron spectrum methodology, the vertical ionization energies of l-C3H and c-C3H were found to be 9.118 eV (136.0 nm) and 9.830 eV (126.1 nm), respectively. Since there are no strong autoionizing resonances present in the combined ionization efficiency spectra of the isomers, the total ion yield of the individual isomers can be convincingly synthesized by integrating over the fitted TPES of the two contributing isomers. This gives the two total ion yields simple step functions which are scaled to 30 Mb. The reasoning for this is the following. Total photoabsorption cross sections of neutral alkanes appear to follow a simple trend where the maxima of the cross sections in the VUV range scales approximately linearly with the number of carbon atoms (Kameta et al. 1992). Such a trend would predict approximately 70 Mb maximum considering the cross sections of CH and C2H. This is, however not as straight-forward when it comes to radical species as other radicals including three and four carbon atoms, for instance, propargyl (Savee et al. 2012) and 2-butyne-1-yl (Hrodmarsson et al. 2019b), have significantly smaller cross sections (between 10 and 25 Mb) in comparison to their closed-shell alkane counterparts. There are also discrepancies between calculations and measurements of the absolute maxima of the cross sections of hydrocarbon radicals (Huang et al. 2018; Hartweg et al. 2020). Hence, we cautiously give a scaling of the order 30 Mb with the caveat that the error is likely within an order of magnitude.
Calculated photodissociation & photoionization rates of HNCO.
Calculated photoionization rates of CH3CHO and comparisons to previous entries in the database.
Calculated photodissociation & photoionization rates of CH3OCH3.
3.9 HC3H (t-C3H2) and c-C3H2
The total ion yields of both HC3H and c-C3H2 have been recorded by Garcia et al. (2018). In a manner similar to the C3H isomers, both isomers were identified in the same mass channel. Again, by integrating the calculated TPES of the individual isomers, we can disentangle them and cautiously scale the photoionization efficiency maxima to 30 Mb.
Calculated photodissociation & photoionization rates of CH3OCHO.
Calculated photoionization rates of SH and comparisons to previous entries in the database.
Calculated photodissociation rates of CS and comparisons to previous entries in the database.
Calculated photoionization rates of CS and comparisons to previous entries in the database.
Calculated photodissociation & photoionization rates of H2CS.
Calculated photodissociation rates of S2 and comparisons to previous entries in the database.
Calculated photoionization rates of S2 and comparisons to previous entries in the database.
Calculated photoionization rates of SiH.
3.10 C3H3
An important intermediate in combustion chemistry, the resonantly stabilized propargyl radical is included in the database. The absolute photoionization cross section of propargyl was measured by Savee et al. (2012) and the ionization energy has been measured as 8.70053 eV (142.502nm) (Jacovella et al. 2013). The photoionization cross section measurements by Savee were significantly larger than a previous measurements (Robinson et al. 2003), but were subsequently replicated and verified (Xu & Pratt 2013).
The photodissociation cross section of propargyl has been pieced together from several studies both experimental and theoretical. An absorption cross section was recorded which peaks around 12 Mb (Fahr et al. 1997). The absorption spectrum of C3H3 was also calculated by Eisfeld (2006) who found much stronger absorption features toward longer wavelengths. Experiments have not found these absorption features, however, or photodissociation products in this wavelength range (Deyerl et al. 1999; Nguyen et al. 2001a,b; Zheng et al. 2009). The photodissociation cross section included here is, therefore, a scaled combination of the two transitions from the Eisfeld spectra which agree with experiments, and are absolutely scaled to the cross section measured previously (Fahr et al. 1997).
Calculated photodissociation & photoionization rates of HF.
Summary of all updates and new species added to the database.
3.11 C4H− and C6H−
As with C2H−, the absolute photodetachment cross sections of both C4H− and C6H− have been measured with 22-pole ion trap technology at several photon energies which allows the construction of the cross sections (Best et al. 2011). Their cross sections are included in this database now for the first time.
3.12 OH (hydroxyl
Previously, the photodissociation cross section of OH is based on the theoretical work by van Dishoeck & Dalgarno (van Dishoeck et al. 1984; van Dishoeck & Dalgarno 1984a,b). More recently, the VUV photoabsorption spectra of the A2Σ+ (v′ 0) and D2Σ− (v′ = 0, 1) bands of OH (and OD) were recorded (Heays et al. 2018) using the Fourier transform absorption cell at the DESIRS beamline at SOLEIL (de Oliveira et al. 2011, 2016). The high resolution spectra allowed the relative oscillator strengths of these bands to be determined with greater accuracy than before, and these are used to rescale the cross section previously included. This results in an increase by 12.5% of the photodissociation cross section of OH and improves the accuracy grade to A+.
More recently, however, the absolute photoionization cross section of OH has been measured by two groups (Dodson et al. 2018; Harper et al. 2019, 2020b) using i2PEPICO spectroscopy but employing different techniques in terms of preparing the OH radicals. Both cross sections are recorded in high resolution revealing a wealth of autoionizing resonances. The ionization energy is measured to be IE = 13.06198 eV = 94.9199 nm and this is the first time the OH photoionization cross section is included in the database.
3.13 HO2 (superoxide)
The photodissociation cross section of superoxide has been included in previous editions of the database. It is obtained from a combination of theory (Langhoff & Jaffe 1979) and experiments (McAdam et al. 1987). The absolute photoionization cross section has been measured by Dodson et al. (2015) and is now included in the database for the first time.
3.14 HCO(formyl)
As before, the photodissociation cross section of the formyl radical is based on the theoretical work of Bruna et al. (1976). More recently, the absolute photoionization cross section of the formyl radical was recently measured by Savee et al. (2021) up to 11.5 eV (108 nm). The ionization energy is measured as IE = 8.15022 eV (152.124nm) and we extend the photoionization cross section toward 91.2 nm.
3.15 HCOOH (formic acid)
The photodissociation dynamics of formic acid have been studied at several wavelengths (Jolly et al. 1987; Suto et al. 1988a; Singleton et al. 1989, 1990; Shin et al. 1998), but one of the first absorption (dissociation) cross sections of formic acid was measured from 195 to 250 nm by Singleton et al. (1987). However, it was found that the first dissociation threshold of HCOOH is somewhat lower, or 333 nm which corresponds to the cleavage of the HCOO-H bond whereas the dissociation threshold for the H-COOH bond is measured to be 255 nm (Langford et al. 1997). Above 200 nm we thus include the cross section measured by Singleton et al. and a 5 × 10⁻²⁰ cm2 baseline toward the photodissociation threshold of 333 nm.
Below 200 nm, the absorption cross section between 105 and 155 nm has been recorded (Tabayashi et al. 1999) and oscillator strengths have been calculated for several electronically excited states (Osted et al. 2005). Later absorption cross section measurements in higher resolution were performed by Leach et al. (2002) and Schwell et al. (2006). The photoionization cross section of formic acid was measured from threshold (11.3 eV = 110 nm) up to 12.4eV (= 100 nm) (Cool et al. 2005) and by combining all these previous measurements of absorption cross sections, photoionization yields, Fujimoto et al. (2020) could derive the photoemission decay cross section above the photoionization threshold which allowed them to appropriately derive and scale the absolute photoionization cross section with better than 10% accuracy. Cross sections for HCOOH are also available toward X-ray regimes (Boechat-Roberty et al. 2005; Tenorio et al. 2019).
3.16 NH2 (amidogen)
The photodissociation cross section of NH2 was constructed from previous calculations (Saxon et al. 1983; Koch 1997; Yamaguchi et al. 1999) and is here unchanged. The photoionization cross section that was previously included was a scaling of the photoionization efficiency curve that was measured by Gibson et al. (1985), but this cross section has recently been determined in absolute terms with an error around 5% (Harper et al. 2021). The recent measurement by Harper et al. gives a cross section whose intensity is approximately a factor of 2 smaller than the previously scaled photoion yield. Their cross section is herewith added to the database.
3.17 HNC (hydrogen isocyanide)
HNC is a very tricky molecule to work in a laboratory setting. Hence, very few experimental studies exist which have investigated its physical and chemical properties. Although theoretically challenging as well, its photoabsorption/dissociation cross sections have been calculated along with the HCN using ab initio methods up to 13.6 eV (Aguado et al. 2017). The cross section is very structured with many discrete features and is added to the database now for the first time.
The photoionization cross section has been constructed from the following experiments. By using methanimine (CH2NH) as a precursor and F radicals for H-abstraction, both HNC and HCN were created in the flow-tube contraption described previously (Gans et al. 2019). As the ionization energy of HNC is approximately 1.5 eV lower than HCN, the ionization of HNC could be comfortably studied below the ionization threshold of HCN. The ground state TPES was well reproduced by theory which was used to simulate the TPES of the first excited cationic state. By integrating the TPES in a manner similar to l-C3H, c-C3H, l-C3H2, and c-C3H2 (see above) the total ion yield curve of HNC could be constructed and scaled to give a photoionization cross section.
3.18 HNCO (isocyanic acid)
HNCO emission from G+0.693-0.03 has been used to infer two colliding gaseous components, that is, a collision of two molecular clouds which gives rise to the rich and peculiar chemistry therein (Zeng et al. 2020).
An ultraviolet absorption spectrum of HNCO was recorded in the 1960s (Dixon & Kirby 1968) covering 200–260 nm but a more extended UV absorption cross section measurement was obtained a few years later (Okabe 1970). This cross section is used here with the previous UV absorption measurement scaled to extend the cross section down to 260 nm. It has been observed, however, that the first photodissociation channel opens at 333 nm to give CO + NH, but no cross sections exist in this region. Hence, we add a baseline of 5 × 10⁻²⁰ cm2 down to the dissociation limit in a similar manner as HCOOH (see above). The photodissociation dynamics of the first three lowest-energy photodissociation channels have been investigated with VMI (Zhang et al. 2014a, 2018a,b). In brief, these three dissociation channels are the following: (i) NH(X)+CO(X) (332.67 nm), (ii) H(2S)+NCO(X) (260.62 nm), and (iii) NH(a1A)+CO(X) (236.55 nm).
The photoelectron spectrum of HNCO was initially recorded with low resolution by Eland (1970) and was more recently measured in higher resolution where the TPES of the ground state and first excited states of the cation was obtained (Holzmeier et al. 2015). To construct a photoionization cross section we integrate the lower-resolution PES which was recorded up to 19 eV (Eland 1970). This integrated PES was then scaled such that the ratio between the maximum intensity of the photoionization cross section and the photodissociation cross section was similar as those of HNC and HCN.
3.19 CH3CHO (acetaldehyde)
The VUV photoabsorption cross section of acetaldehyde was previously measured by Martinez et al. (1992) and Limão-Vieira et al. (2003) up to 11 eV (113 nm). Some work pertaining to the nature of the photodissociation dynamics have also shown the first dissociation pathway leading to cleavage of the C-C bond to form CH3 and CHO (Heazlewood et al. 2009). The wavelength-dependent VUV photodynamics of acetaldehyde, however, are rather complex and between 248 nm and 330 nm there are multiple fragmentation pathways which can lead to a variety of photoproducts such as H, H2, CO, HCO, CH4, and H2CCO (Fu et al. 2012; Hung et al. 2014; Lee et al. 2014; Morajkar et al. 2014; Zhang et al. 2014b; Li et al. 2015; Han et al. 2017; Toulson et al. 2017; Shaw et al. 2018; Harrison et al. 2019; Yang et al. 2020, 2021).
Concerning the VUV photoionization of CH3CHO, one of the first photoionization works was performed in the 1950s (Hurzeler et al. 1958). Its photoelectron spectrum and photoionization efficiency up to 20 eV was recorded by Yencha et al. (2013). Here we have taken their photoionization efficiency and scaled it in accordance to the calculations of the cross sections of high-lying Rydberg states (Vega et al. 2010). There it is assumed that the cross section drops shortly after the ionization onset.
3.20 CH3OCH3 (dimethyl ether)
The photoabsorption, photodissociation and photoionization cross sections of dimethyl ether (DME) have been studied in detail as DME is an important product species in combustion studies (Hatano 1999a). The cross sections between 50 and 95 nm were studied by Kameta et al. (1992) and from threshold up to 200 eV by Feng et al. (2000, 2001). Dissociative ionization of dimethyl ether is found to yield mostly H above 11.2 eV, and CH3 in a minor yield up to 12.5 eV (Schwell et al. 2013).
The photodissociation products of DME, however, are not well constrained. Whilst some studies have found evidence of fluorescence from the methoxy (CH3O) radical indicating a C–O bond cleavage to be the primary dissociation path (Suto et al. 1988b), it has also been found that through H-roaming, photodissociation of DME can also yield formaldehyde (HCHO) and methane (CH4) (Tranter et al. 2013).
3.21 CH3OCHO (methyl formate)
Methyl formate has been detected in young low-mass protostars (Bergner et al. 2017) and also with the FAUST survey of a three protostar system (Codella et al. 2022). It is included here in the database for the first time.
The VUV absorption spectrum of methyl formate has been recorded from 4 eV up to 11 eV by Nunes et al. (2010) who also recorded its photoelectron spectrum extending from 10.4 eV up to 17 eV. The photodissociation threshold is found to be 248 nm.
Here, we use their photoabsorption cross section as a basis for the photodissociation cross section. The dominant dissociation channel has been found to be the α-C–O bond fission through the S1 electronically excited state leading to the formation of the methoxy (CH3O) and formyl (HCO) radicals (Cui et al. 2010).
The absolute photoionization cross section of methyl formate was measured from threshold up to 11.7 eV (Wang et al. 2010) which corresponds to the peak of the ground state photoelec-tron band (Nunes et al. 2010). To construct the photoionization cross section we sum over the measured photoelectron spectrum and use the absolute photoionization cross section by Wang et al. (2010) to provide scaling for the total cross section.
3.22 SH (mercapto)
The photodissociation cross section of SH has been in included in the database previously and was obtained by combining the results of previous experimental and theoretical works (Johns & Ramsay 1961; Friedl et al. 1983; Bruna & Hirsch 1987; Lee et al. 2001; Lee & Sun 2001; Resende & Ornellas 2001). This cross section is here unchanged.
The absolute photoionization cross section of SH has been measured by recently (Hrodmarsson et al. 2019a). The error of the cross section is around 10%. Previously, the photoionization cross section of SH included in the database was arbitrarily simulated and was over an order of magnitude smaller than the recent measurements which also display a wealth of autoionizing resonances as well. The ionization energy is measured as 118.96 nm (Hrodmarsson et al. 2019a).
3.23 CS (carbon monosulfide)
CS has recently been observed to be quite abundant in hot cores (Barr et al. 2018). The photodissociation cross section of CS has been in included in the database previously and was obtained by combining the results of previous experimental and theoretical works (Bruna et al. 1975; Stark et al. 1987). More recently, high level ab initio calculations have been employed to calculate the photodissociation cross section up to 90 nm. This is here included for the first time in the database (Xu et al. 2019).
The photoionization efficiency curve of CS has been measured around the ionization threshold (109.55 nm) (Norwood et al. 1991). The photoionization efficiency has also been measured between 60 and 85 nm (Coppens & Drowart 1995). The photoionization of CS using constant ionic state spectroscopy was also investigated up to 62 nm which revealed a very structured vibrational band on the cationic ground state (Dyke et al. 1998). They found that the ground state of the ion makes the most dominant contribution to the total ion yield and the signals from excited states of the cation made more negligible contributions. Hence, we assume an approximately constant ionic contribution from 100 nm to 80 nm. To scale these measurements of the photoionization efficiency we make use of calculations which consider both initial state configuration interaction (ISCI) and final ionic state configuration interactions (FISCI; Ponzi et al. 2014). These reveal that the maximum of the photoionization cross section of the autoionizing resonance toward the ionic ground state is around 20 Mb which allows us to scale the ionization cross section.
3.24 H2CS (thioformaldehyde)
An ultraviolet absorption cross section of thioformaldehyde was initially measured at wavelengths longer than 220 nm (Drury & Moule 1982) but a more extensive absorption spectrum utilizing synchrotron radiation with higher resolution was recorded up to 130 nm (Chiang & Lin 2005). The latter measurements included ab initio calculations which gave oscillator strengths which helped scale the maxima of the absorption spectrum to the previously measured absolute cross sections. It is worth mentioning the theoretical efforts the ab initio calculations were based on which include many of the electronically excited states of H2CS (Hachey & Grein 1995a,b).
A photoelectron spectrum of H2CS was obtained via pyrolysis of CH3SSCH3 recorded by Kroto & Suffolk (1972). Although H2S and CS2 were also formed and visible in the PES, they can easily be subtracted such that the photoionization efficiency could be obtained by integrating the low-resolution PES and thus excluding the contributions from CS2 and H2S. The maximum was then scaled such that the scale of the cross section was similar to other sulfur containing molecules whose cross section has been measured in absolute terms, akin to what has been done with other carbon-based species.
The photodissociation of H2CS has been subject to several experimental and theoretical studies and as a matter of fact, H2CS has a benchmark status in theoretical studies because of the complex intersystem crossing dynamics involved in the excited states that partake in the photodissociation process (Zhang et al. 2021).
3.25 S2 (disulfur, sulfur dimer)
The previous photodissociation cross section was made from a combination of experimental and theoretical works (Smith & Liszt 1971; Pradhan & Partridge 1996; Wheeler et al. 1998; Frederix et al. 2009). Recently, the absolute photoabsorption cross sections of the predissociative B–X system of S2 has been measured in absolute terms by Stark et al. (2018) at two temperatures using the Fourier transform absorption cell at the DESIRS beamline at SOLEIL (de Oliveira et al. 2011, 2016). These measurements were accompanied by a comprehensive coupledchannel model describing the predissociative nature of the B–X system (Lewis et al. 2018). S2 vapor was produced via an H2S precursor gas in a radio frequency discharge for measurements at 370 K, or from solid elemental sulfur for spectra recorded at 823 K. These measurements have more recently been replicated computationally by Gomez et al. (in prep.). They calculated the absorption cross sections well below the dissociation threshold which has been measured as 280.6 nm by Frederix et al. (2009). Included in the database is the computational cross section which replicates the measurements at 370 K. The photoabsorption cross section corresponding to absorption by the B-X system below the dissociation threshold is included in the photoabsorption cross section available in the database online. It should be noted that the differences in the photodissociation rates from the measurements at the two temperatures (using the radiation fields in this work) were negligible.
The photoionization cross section of S2 was previously made by scaling the photoionization efficiency curve measured by Liao & Ng (1986). Recently, this curve has been measured with higher resolution which has allowed assignments of multiple autoionizing resonances present in the total ion yield (Hrodmarsson et al. 2021). The total ion yield of S2 was recorded in the same experiment which measured the absolute photoionization cross section of SH, and therein, the S2 mass signals were even more intense than that of SH (Hrodmarsson et al. 2019a). This is due both to the fast recombination of S atoms and S2 having a large PI cross section, that is to say, on par with SH. The S2 cross section is thus scaled to match the intensity of the SH cross section.
3.26 SiH
The photodissociation cross section of SiH has been obtained in the previous database update from the theoretical work by Lewerenz et al. (1983a,b). This cross section is here unchanged. The photoionization efficiency of SiH was recently measured by Chen et al. (2022) and to obtain the photoionization cross section this curve has been scaled to the absolute cross sections of silane and disilane which have been measured to be around 100 Mb between 11 and 14 eV (Kameta et al. 1998).
3.27 HF
Between this update and the previous one (Heays et al. 2017), another molecule was added to the database, namely HF. An absolute photoabsorption cross section for the continuum A–X absorption was recorded between 112 and 145 nm (Nee et al. 1985), and the entire VUV photoabsorption spectrum is measured by electron-energy-loss spectroscopy by Hitchcock et al. (1984) but with a two times greater absolute magnitude for the A-X transition. Subsequent calculations of the A–X transition (Brown & Balint-Kurti 2000a,b) clearly favor the absolute magnitude (and absorption) profile of the A–X measurement by Nee et al. (1985). Here, the entire spectrum of Hitchcock et al. (1984) was scaled down to match this (by a factor of 0.53) and the photoabsorption recorded by Nee et al. (1985) has been extrapolated linearly from 145 to 165 nm to approximately match the point where the calculated cross sections become zero (Brown & Balint-Kurti 2000a,b).
A photoionization yield measured by Berkowitz et al. (1971) was rescaled by a factor of 1.47 × 10⁻¹⁷ to match the cross section of Hitchcock et al. (1984, itself already rescaled) at its shortest wavelength (62.5 nm). It was assumed 100% for this wavelength and shorter, which is roughly consistent with the branching ratios measured by Carnovale et al. (1981).
The overall uncertainty of the photodissociation and photoionization cross sections was judged to be about 30%, but the recent aforementioned ab initio calculations of the photodissociation cross sections of both HF and HCl appear to indicate that the uncertainty of the photodissociation cross section is closer to 10% (Pezzella et al. 2022; Qin et al. 2022).
4 Discussion
The relevance of the updated cross sections may have significant implications for our understanding of VUV-driven photoprocesses, but these may be quite species dependent. In some cases, newly measured cross sections reduced the uncertainty of previous inclusions, but in others they present completely new additions whose influence have not come to light yet.
In the previous entry of the database website, the  cross section page was erroneously missing although the cross sections themselves were available in the database. This has now been rectified but here we explored a bit further the photodissociation cross section of
  in the context of the work of Petrignani et al. (2010) which indicated that the photodissociation of
  occurs at significantly longer wavelengths than was previously found by ab initio methods. We consider the effects to photorates by constructing a baseline to the cross section that accounts for the measured values. Particularly startling is the increase in the dissociation rate under a solar radiation field where the photorate increases by almost five orders of magnitude but, likewise, photodissociation under a TW Hya field and cosmic-ray induced UV photons increases by 1–2 orders of the magnitude. This is strange because our current understanding of the importance of
  chemistry in, for instance, protoplanetary disks where
  -driven chemistry is used to identify and locate CO and N2 snowlines (van’t Hoff et al. 2017, 2018, 2022) does not imply that current photorates of
  are poorly constrained. Likewise,
  abundances in diffuse clouds where
  has been used to constrain the cosmic ray ionization rate do not necessarily imply such errors either (Indriolo 2012; Padovani et al. 2013). However, further experimental work into the photodissociation of
  would be of great interest.
The photodissociation and photoionization cross sections of multiple hydrocarbon species have been updated in this work. Photoionization cross sections have been added to C2H, l-C3H, c-C3H, HC3H, c-C3H2, and new hydrocarbons have been added from scratch such as C2H3, C2H5 and C3H3. These hydrocarbons as well as some of their ions have been detected in various environments such as cold molecular clouds (Thaddeus et al. 1985a,b; Yamamoto et al. 1987; Brünken et al. 2014; Agúndez et al. 2021), protostellar envelopes (Murillo et al. 2018; van der Wiel et al. 2019), protoplanetary disks (Dutrey et al. 1997; Qi et al. 2013; Bergin et al. 2016), PDRs (Pety et al. 2012; Brünken et al. 2014), evolved carbon stars (Thaddeus et al. 1985a), and in the comet 67P (Beth et al. 2020), so understanding and having proper quantifications of their VUV-photoprocesses is important. For some of these species such as C2H3 and C2H5, the photodissociation cross sections have never been measured or calculated to the best of our knowledge and so we include absorption measurements and draw some tentative conclusions about what their cross sections look like from the wealth of photodissociation dynamics investigations that have been performed at discrete wavelengths.
The photoionization (or photodetachment) cross sections of the hydrocarbon anions C2H−, C4H−, and C6H− are also included for the first time, but anions have been receiving greater attention in recent years (Millar et al. 2017). These anions have been detected in TMC-1 (McCarthy et al. 2006), the envelope of IRC +10216 (Cernicharo et al. 2007; Agúndez et al. 2010), the protostellar source L1527 (Agúndez et al. 2008; Sakai et al. 2008), the Lupus-1A starless core (Sakai et al. 2010), various star-forming, prestellar, and quiescent cores (Cordiner et al. 2011, 2013), and perhaps surprisingly, in the atmosphere of Titan with Cassini (Cravens et al. 2006; Vuitton et al. 2006; Coates et al. 2007). The chemistry of these anions has been modeled, but without the inclusion of absolute measurements of the pho-todetachment cross sections (Desai et al. 2017; Mukundan & Bhardwaj 2018). It is important to properly constrain these photodetachment rates as, for instance, it has been observed that the abundance of C2H− is vanishingly small in comparison to C2H in IRC +10216 (Agúndez et al. 2010). This could likely be due to large C2H− photorates (Table 5), particularly in comparison to photodestruction rates of C2H (Table 4) which are on average 1–2 orders of magnitude smaller than that of C2H−. Indeed, in the study of CN−, it is suggested that VUV photodetachment is the most important destruction mechanism of anions in circumstellar envelopes (Kumar et al. 2013).
In terms of oxygen-based species, the photoionization cross sections of OH and HO2 are included for the first time. The maximum of the OH cross section can be found around 30 Mb which is similar to the maxima of the photoionization cross sections of O2 toward short wavelengths and the maximum of the H2O2 cross section around 90 nm previously included in the database (Heays et al. 2017). Curiously, the recently measured absolute cross section of the HO2 radical is measured with a somewhat smaller maximum below 10 Mb. It is noteworthy that the measurements of Dodson et al. (2015) only extend to 12 eV (103 nm) and from there a straight line is assumed for the cross section toward shorter wavelengths. It is entirely possible that the cross section is larger at shorter wavelengths so below 100 nm the included cross section presents a likely lower limit to the cross section. The HO2 radical is an elusive intermediate in interstellar solid water chemistry on dust grains (Hama & Watanabe 2013), and has so far only been detected in the ρ Oph A cloud (Parise et al. 2012) which is where gas-phase O2 was previously detected (Larsson et al. 2007). This strengthens the case of HO2 as an indicator of gas-grain chemistry (Agúndez & Wakelam 2013; van Dishoeck et al. 2013).
The absolute measurement of the cross section of NH2 measured by Harper et al. (2021) included here shows that the rates of photoionization were previously overestimated by a factor of approximately 2. The radical presents a bit of a mystery because models of dark cold clouds generally predict the NH2 abundance to be higher than NH, but observations of the cold envelope of IRAS 16293–2422 have shown the abundance to be inverted (Hily-Blant et al. 2010). Interestingly, to explain the NH:NH2 :NH3 ratio of 1:10:100 in Sgr B2, invoked PDR chemistry and/or shock chemistry were invoked to explain these abundances (Goicoechea et al. 2004). The updated high-accuracy cross section of NH2 could help shed some more light about its interstellar abundances. Concerning protoplanetary disks, the nitrogen chemistry is sensitive to whether you start out with greater abundances of NH3 or N2. If NH3 is more abundant, then a higher abundance of N-bearing species are expected in the midplane which could enhance the importance of NH2 as a reactive intermediate (Walsh et al. 2015).
Constraining the photorates of HNC is of great importance as the abundance ratio of HNC and its isomer HCN is an important chemical clock. Namely, the HNC/HCN ratio increases toward more advanced stages due the HNC isomer being more prone to destruction at higher temperatures (Jin et al. 2015). This is achieved through neutral conversion of HNC to HCN via a transition state with a barrier of 46.1 kJ mol−1 or reactions with atomic H followed by elimination of H (Talbi & Ellinger 1996). As the HNC/HCN line ratio is also robust in planetary nebulae it is important to realize that the rate of VUV-photoprocesses of HNC do not necessarily exceed those of HCN. In fact, comparisons of the photorates of HNC included here and those of HCN in the database reveal that HNC is slightly less prone to destruction under VUV. This places recent results by Bublitz et al. (2022) into some perspective as they found that the HNC/HCN ratio is anticorrelated with radial distance from the central star and, furthermore, it appears to be anticorrelated with UV emission over four orders of magnitude in incident flux. Hence, it is very important to characterize these photorates so that the HNC/HCN ratio could still be reliably used for regions experiencing harsher radiation fields, such as different layers of protoplanetary disks (Long et al. 2021).
With the recent detection of DME in a protoplanetary disk (Brunken et al. 2022), it is clear that accounting for photorates is presenting a new challenge for models. Although VUV photorates of multiple complex molecules are already known, it is also true that VUV photodissociation is a multiplex phenomenon for complex molecules and acquiring accurate branching ratios of multiple dissociation channels is a monumental experimental and theoretical challenge for the coming decade. As an example, a relatively small molecule such as methane (CH4) has at least seven different photodissociation and several more dissociative photoionization channels which are known in the VUV (Gans et al. 2011a). By doubling the number of carbon atoms and investigating ethane (CH3CH3), the number of photodissociation channels alone that are accessible below the Lyman-α limit is at least seventeen (Chang et al. 2020). Thus, in the future, to characterize the VUV-driven processes of complex molecules in space photodissociation and photoionization cross sections need to be divided according to the branching ratios of different channels that produce different products. This kind of separation is already available in the database for abundant molecules such as H2O and NH3 (Heays et al. 2017), but significant progress has already been made in measuring absolute branching ratios of different photodissociation processes in small molecules. Namely, the branching ratios of several fragmentation channels from pre-dissociative Rydberg states have been measured in CO (Gao et al. 2011a, 2012, 2013, 2020; Shi et al. 2018; Chi et al. 2020), N2 (Gao et al. 2011b; Song et al. 2016; Shi et al. 2017), and CO2 (Lu et al. 2014).
Besides molecular complexity, interstellar sulfur chemistry has been receiving more attention recently, particularly in the light of recent detections of numerous complex sulfur-bearing molecules in the ISM (Fuente et al. 2017; Agúndez et al. 2018; Cernicharo et al. 2018, 2021b,c,d; Cabezas et al. 2022; Fuentetaja et al. 2022), protostellar systems (Blake et al. 1994; Caux et al. 2011; Majumdar et al. 2016; Martín-Doménech et al. 2016; Drozdovskaya et al. 2018), as well as the detection of H2S, H2CS and CS in protoplanetary disks (Dutrey et al. 1997; Phuong et al. 2018; Le Gal et al. 2019). Here we update three fundamental sulfur bearing molecules, SH, S2 and CS and add the cross sections of H2CS, which has been used to derive temperature structures in protoplanetary disks (van’t Hoff et al. 2020).
Both SH+ and SH have observed in low-density diffuse clouds (Menten et al. 2011; Godard et al. 2012; Neufeld et al. 2012, 2015). Hence, we have added here the measured absolute photoionization cross section of the SH radical (Hrodmarsson et al. 2019a). It shows that previous photoionization rates of SH were severely underestimated by 1–2 orders of magnitude which has prompted us to rescale more recent measurements of the photoionization efficiency of S2 (Hrodmarsson et al. 2021). This is important to establish because sulfur hydride chemistry in space is quite unusual because none of simplest sulfur species, S, S+, SH, SH+, and H2S+ can react exothermically with H2(v = 0) (Goicoechea et al. 2021) and so to ignite sulfur chemistry the gas needs to be UV-irradiated followed by intense heat (Zanchet et al. 2013, 2019). Both of SH and S2 are also expected to be important heating components of atmospheres of Hot Jupiters (Zahnle et al. 2009), and both have been observed in our Solar System; SH in the solar atmosphere (Berdyugina & Livingston 2002), and S2 on Jupiter (Noll et al. 1995), in volcanic plumes on Io (Spencer et al. 2000; Jessup et al. 2007), and cometary comae (Ahearn et al. 1983; Kim et al. 2003).
The photodissociation and photoionization cross sections of CS have also been updated. Implementing the photodissociation cross sections computed by Xu et al. (2019) requires bringing up the role resolution plays when it comes to interpolating measured and computed cross sections for numerical integrations. Throughout this paper and presented in the database, all cross sections and radiation fields are computed on a 0.001 nm grid. The calculated cross section of CS, however, contains a myriad of finely resolved spectral features with FWHM that could only be fully captured using a resolution better than 0.00004 nm. Hence, some spectral features were left out by using a larger grid which resulted in slightly smaller photorates (smaller than 10%) which is still better than the 20% accuracy limit required for an A+ rating.
One interesting finding here are the computed photodissociation rates for different radiation fields of CS (Table 27). Namely, the radiation fields whose intensities are greater toward shorter wavelengths and more discrete in nature, give smaller photodissociation rates while the photorates of continuum radiation fields such as ISRF, are larger by a factor of few. These differences arise from the previous photodissociation cross section being overestimated by up to an order of magnitude between 116 and 125 nm, approximately. This results in the photorates under radiation fields with large fluxes at shorter wavelengths (particularly the Lyman-α line), being significantly smaller than the previously included cross section.
Xu et al. (2019) also computed the CS photodissociation cross section for higher temperatures up to 500 K. Although the difference in the computed photodissociation rates from 20 to 500 K was negligible in the case of CS, it is important to account for temperature effects in molecules that can be abundant components in exoplanetary atmospheres. Exoplan-ets and in particular Hot Jupiters and Hot Neptunes, require significant quantities of molecular spectroscopic data to model radiative transport in their atmospheres, interpret their spectra, and understand the underlying photo-driven chemistry to account for observed molecular abundances (Hill et al. 2013). For instance, high temperature VUV cross sections are important to chemically quantify the impact of stellar flares on exoplane-tary atmosphere compositions (Venot et al. 2016), and to quantify the contribution of VUV photon-induced processes to disequi-libria in atmospheric chemistry which can lead to changes in temperature profiles (Drummond et al. 2016).
It is also important to quantify the cross sections in terms of their shielding effects in exoplanetary atmospheres. VUV shielding of molecules such as H2O, O2, CO and CO2 allows hydrocarbon species, which exists in lower layers of the atmosphere, to survive and proliferate under the shielding effects of exoplanet atmospheres (Kawashima & Ikoma 2019). VUV-photoprocesses can also change the atmospheric composition down to depths of several bar in cool exoplanets, in part because the night sides of most cool planets are shown to host photochemical products transported from the day side by horizontal advection (Baeyens et al. 2022).
Experimental work on high-temperature VUV cross sections is challenging due to the limitations presented by the materials used in absorption cells. There is ongoing experimental work addressing these challenges by, for instance, extrapolating a series of measurements beyond 800 K, like has been done for CO2 (Venot et al. 2018a,b). There, it was shown that by including the high-temperature cross sections of CO2 in a chemical model of a Hot Neptune-like exoplanet, the abundances of multiple species are altered, some by orders of magnitude. It will be of interest to see how other newly computed high-temperature VUV cross sections of diatomics such as HCl, HF, and others (Pezzella et al. 2021, 2022) will influence the results from chemical models of exoplanet atmospheres.
Finally, the photoionization cross section of SiH is included here for the first time. As silicates are widely observed to be among the most abundant and important components of refractory materials in the ISM (van Dishoeck 2004), it is sensible that the chemistry of silicon is found to be significantly affected by depletion of Si onto grains (Herbst et al. 1989). SiH has been long observed in the spectrum of our Sun (Babcock 1945; Sauval 1969) and various cool stars (Merrill 1955), and it is predicted to be present in high-pressure exoplanetary atmospheres that contain both SiH4 and SiO in the presence of H2O (Visscher et al. 2010). While silane (SiH4) has been detected in the gas surrounding IRC +10216 (Goldhaber & Betz 1984), the interstellar presence of SiH has so far merely been hinted at (Walmsley et al. 1999), but it may still play an important role as intermediate in the chemistry leading to SiS via reactions with atomic or diatomic sulfur (Rosi et al. 2018).
5 Conclusions
The Leiden VUV cross section database has been updated and expanded with new photodissociation and photoionization cross sections of molecules of varied astronomical interest, accompanied by uncertainty estimates. The cross sections are used to compute rates of photodissociation and photoionization in several different radiation fields and are compared with previous database entries where appropriate. Many of the new cross sections have been obtained thanks to experimental and theoretical advances which have been detailed. Thanks to these advances, the newly updated cross sections generally provide excellent constraints (generally better than 30%) to the computed photorates.
Also accompanied and updated in the database are photorates computed assuming dust and line shielding and shielding functions that are suitable for use in astrochemical models that account for VUV photoprocesses, which are not easily parametrized.
The cross sections and derived data for now a total of 116 atoms and molecules are available from the Leiden VUV cross section database. These are provided in both a binary format, explicitly including all cross section features on a dense wavelength grid, and sparser text format that is more suitable for rapid calculation in a continuum radiation field. The database update includes 14 new species and updates to 16 previous entries.
Acknowledgements
Thanks to Alan Heays for assistance with the database update and computations, and Arthur Bosman for useful discussions. Thanks to Séverine Boyé-Péronne, Bérenger Gans, and Jean-Christophe Loison for providing the photoionization efficiencies and threshold photoelectron spectra of CH, C2, C2H, C2H3, C2H5, HNC and SiH. Thanks to Gustavo Garcia for the photoionization efficiencies and the separated TPES of l-C3H, c-C3H, HC3H, and c-C3H2. Thanks to Zhongxing Xu and Kyle Crabtree for providing the photodissociation cross sections of CS. Thanks to Iouli Gordon, Robert Hargreaves, and Fran Skinner for providing the photoabsorption cross sections of S2. This work was supported by the Programme National “Physique et Chimie du Milieu Interstellaire” (PCMI) of CNRS/INSU with INC/INP co-funded by CEA and CNES.
Appendix A Integrated flux of radiation fields
Integrated fluxes of the radiation fields and conversion factor used to normalize them.
References
- Aguado, A., Roncero, O., Zanchet, A., Agúndez, M., & Cernicharo, J. 2017, ApJ, 838, 33 [Google Scholar]
- Agúndez, M., & Wakelam, V. 2013, Chem. Rev., 113, 8710 [Google Scholar]
- Agúndez, M., Cernicharo, J., Guelin, M., et al. 2008, A&A, 478, L19 [NASA ADS] [CrossRef] [EDP Sciences] [Google Scholar]
- Agúndez, M., Cernicharo, J., Guelin, M., et al. 2010, A&A, 517, A2 [NASA ADS] [CrossRef] [EDP Sciences] [Google Scholar]
- Agúndez, M., Cernicharo, J., de Vicente, P., et al. 2015, A&A, 579, A10 [Google Scholar]
- Agúndez, M., Marcelino, N., Cernicharo, J., & Tafalla, M. 2018, A&A, 611, A1 [NASA ADS] [CrossRef] [EDP Sciences] [Google Scholar]
- Agúndez, M., Cabezas, C., Tercero, B., et al. 2021, A&A, 647, A10 [Google Scholar]
- Ahearn, M., Feldman, P., & Schleicher, D. 1983, ApJ, 274, L99 [CrossRef] [Google Scholar]
- Ahmed, M., Peterka, D. S., & Suits, A. G. 1999, J. Chem. Phys., 110, 4248 [NASA ADS] [CrossRef] [Google Scholar]
- Aikawa, Y., van Zadelhoff, G. J., van Dishoeck, E. F., & Herbst, E. 2002, A&A, 386, 622 [NASA ADS] [CrossRef] [EDP Sciences] [Google Scholar]
- Armijos-Abendaño, J., Martín-Pintado, J., López, E., et al. 2020, ApJ, 895, 57 [Google Scholar]
- Babcock, H. 1945, ApJ, 102, 154 [NASA ADS] [CrossRef] [Google Scholar]
- Bacalla, X. L., Linnartz, H., Cox, N. L. J., et al. 2019, A&A, 622, A31 [EDP Sciences] [Google Scholar]
- Baer, T., & Tuckett, R. P. 2017, Phys. Chem. Chem. Phys., 19, 9698 [NASA ADS] [CrossRef] [Google Scholar]
- Baeyens, R., Konings, T., Venot, O., Carone, L., & Decin, L. 2022, MNRAS, 512, 4877 [NASA ADS] [CrossRef] [Google Scholar]
- Barger, C. J., & Garrod, R. T. 2020, ApJ, 888, 38 [Google Scholar]
- Barr, A. G., Boogert, A., De Witt, C. N., et al. 2018, ApJ, 868, L2 [NASA ADS] [CrossRef] [Google Scholar]
- Barsuhn, J., & Nesbet, R. 1978, J. Chem. Phys., 68, 2783 [NASA ADS] [CrossRef] [Google Scholar]
- Benz, A. O., Bruderer, S., van Dishoeck, E. F., et al. 2011, EAS Pub. Ser., 52, 239 [NASA ADS] [CrossRef] [EDP Sciences] [Google Scholar]
- Benz, A. O., Bruderer, S., van Dishoeck, E. F., et al. 2016, A&A, 590, A105 [NASA ADS] [CrossRef] [EDP Sciences] [Google Scholar]
- Berdyugina, S. V., & Livingston, W. C. 2002, A&A, 387, L6 [NASA ADS] [CrossRef] [EDP Sciences] [Google Scholar]
- Bergin, E. A., Du, F., Cleeves, L. I., et al. 2016, ApJ, 831, 101 [Google Scholar]
- Bergner, J. B., Öberg, K. I., Garrod, R. T., & Graninger, D. M. 2017, ApJ, 841, 120 [Google Scholar]
- Bergner, J. B., Guzman, V. G., Öberg, K. I., Loomis, R. A., & Pegues, J. 2018, ApJ, 857, 69 [NASA ADS] [CrossRef] [Google Scholar]
- Bergner, J. B., Öberg, K. I., Bergin, E. A., et al. 2019, ApJ, 876, 25 [Google Scholar]
- Bergner, J. B., Öberg, K. I., Guzman, V. V., et al. 2021, ApJS, 257, 11 [NASA ADS] [CrossRef] [Google Scholar]
- Berkowitz, J., Chupka, W., Guyon, P., Holloway, J., & Spohr, R. 1971, J. Chem. Phys., 54, 5165 [NASA ADS] [CrossRef] [Google Scholar]
- Best, T., Otto, R., Trippel, S., et al. 2011, ApJ, 742, 63 [NASA ADS] [CrossRef] [Google Scholar]
- Beth, A., Altwegg, K., Balsiger, H., et al. 2020, A&A, 642, A27 [NASA ADS] [CrossRef] [EDP Sciences] [Google Scholar]
- Bethell, T., & Bergin, E. 2009, Science, 326, 1675 [NASA ADS] [CrossRef] [Google Scholar]
- Blake, G. A., van Dishoeck, E. F., Jansen, D. J., Groesbeck, T. D., & Mundy, L. G. 1994, ApJ, 428, 680 [NASA ADS] [CrossRef] [Google Scholar]
- Bobeldijk, M., van der Zande, W., & Kistemaker, P. 1994, Chem. Phys., 179, 125 [NASA ADS] [CrossRef] [Google Scholar]
- Bodi, A., Hemberger, P., Gerber, T., & Sztaray, B. 2012, Rev. Sci. Instrum., 83, 083105 [NASA ADS] [CrossRef] [Google Scholar]
- Boechat-Roberty, H. M., Pilling, S., & Santos, A. C. F. 2005, A&A, 438, 915 [NASA ADS] [CrossRef] [EDP Sciences] [Google Scholar]
- Booth, A. S., Walsh, C., Terwisscha van Scheltinga, J., et al. 2021, Nat. Astron., 5, 684 [NASA ADS] [CrossRef] [Google Scholar]
- Borsovszky, J., Nauta, K., Jiang, J., et al. 2021, PNAS, 118, e2113315118 [NASA ADS] [CrossRef] [Google Scholar]
- Bosman, A. D., Alarcon, F., Bergin, E. A., et al. 2021, ApJS, 257, 7 [NASA ADS] [CrossRef] [Google Scholar]
- Bovino, S., Ferrada-Chamorro, S., Lupi, A., Schleicher, D. R. G., & Caselli, P. 2020, MNRAS, 495, L7 [Google Scholar]
- Brown, A., & Balint-Kurti, G. G. 2000a, J. Chem. Phys., 113, 1870 [NASA ADS] [CrossRef] [Google Scholar]
- Brown, A., & Balint-Kurti, G. G. 2000b, J. Chem. Phys., 113, 1879 [NASA ADS] [CrossRef] [Google Scholar]
- Brown, J. M., & Carrington, A. 2003, Rotational Spectroscopy of Diatomic Molecules (Cambridge University Press) [CrossRef] [Google Scholar]
- Bruderer, S., Benz, A. O., Staeuber, P., & Doty, S. D. 2010, ApJ, 720, 1432 [NASA ADS] [CrossRef] [Google Scholar]
- Bruna, P. J., & Hirsch, G. 1987, Mol. Phys., 61, 1359 [NASA ADS] [CrossRef] [Google Scholar]
- Bruna, P., Kammer, W., & Vasudevan, K. 1975, Chem. Phys., 9, 91 [NASA ADS] [CrossRef] [Google Scholar]
- Bruna, P., Buenker, R., & Peyerimhoff, S. 1976, J. Mol. Struct., 32, 217 [NASA ADS] [CrossRef] [Google Scholar]
- Brünken, S., Kluge, L., Stoffels, A., Asvany, O., & Schlemmer, S. 2014, ApJ, 783, L4 [CrossRef] [Google Scholar]
- Brunken, N. G. C., Booth, A. S., Leemker, M., et al. 2022, A&A, 659, A29 [NASA ADS] [CrossRef] [EDP Sciences] [Google Scholar]
- Bublitz, J., Kastner, J. H., Hily-Blant, P., et al. 2022, A&A, 659, A197 [NASA ADS] [CrossRef] [EDP Sciences] [Google Scholar]
- Cabezas, C., Agúndez, M., Marcelino, N., et al. 2022, A&A, 657, A4 [NASA ADS] [CrossRef] [EDP Sciences] [Google Scholar]
- Calahan, J. K., Bergin, E. A., & Bosman, A. D. 2022, ApJ, 934, L14 [NASA ADS] [CrossRef] [Google Scholar]
- Carnovale, F., Tseng, R., & Brion, C. 1981, J. Phys. B., 14, 4771 [NASA ADS] [CrossRef] [Google Scholar]
- Caselli, P., & Walmsley, C. M. 2001, ASP Conf. Ser., 243, 67 [NASA ADS] [Google Scholar]
- Caselli, P., Walmsley, C. M., Terzieva, R., & Herbst, E. 1998, ApJ, 499, 234 [Google Scholar]
- Cashion, J. 1963, J. Chem. Phys., 39, 1872 [NASA ADS] [CrossRef] [Google Scholar]
- Cataldi, G., Wu, Y., Brandeker, A., et al. 2020, ApJ, 892, 99 [NASA ADS] [CrossRef] [Google Scholar]
- Caux, E., Kahane, C., Castets, A., et al. 2011, A&A, 532, A23 [NASA ADS] [CrossRef] [EDP Sciences] [Google Scholar]
- Cazzoletti, P., van Dishoeck, E. F., Visser, R., Facchini, S., & Bruderer, S. 2018, A&A, 609, A93 [NASA ADS] [CrossRef] [EDP Sciences] [Google Scholar]
- Ceccarelli, C., Dominik, C., Lopez-Sepulcre, A., et al. 2014, ApJ, 790, L1 [Google Scholar]
- Cecchi-Pestellini, C., & Aiello, S. 1992, MNRAS, 258, 125 [NASA ADS] [CrossRef] [Google Scholar]
- Cernicharo, J., Heras, A. M., Tielens, A. G. G. M., et al. 2001, ApJ, 546, L123 [Google Scholar]
- Cernicharo, J., Guélin, M., Agúndez, M., et al. 2007, A&A, 467, L37 [NASA ADS] [CrossRef] [EDP Sciences] [Google Scholar]
- Cernicharo, J., Lefloch, B., Agúndez, M., et al. 2018, ApJ, 853, L22 [CrossRef] [Google Scholar]
- Cernicharo, J., Agúndez, M., Cabezas, C., et al. 2021a, A&A, 649, L15 [EDP Sciences] [Google Scholar]
- Cernicharo, J., Cabezas, C., Agúndez, M., et al. 2021b, A&A, 648, L3 [EDP Sciences] [Google Scholar]
- Cernicharo, J., Cabezas, C., Endo, Y., et al. 2021c, A&A, 646, L3 [EDP Sciences] [Google Scholar]
- Cernicharo, J., Cabezas, C., Endo, Y., et al. 2021d, A&A, 650, L14 [NASA ADS] [CrossRef] [EDP Sciences] [Google Scholar]
- Chang, Y., Yang, J., Chen, Z., et al. 2020, Chem. Sci., 11, 5089 [CrossRef] [Google Scholar]
- Chen, N. L., Gans, B., Hartweg, S., et al. 2022, J. Chem. Phys., 157, 014303 [NASA ADS] [CrossRef] [Google Scholar]
- Chi, X., Jiang, P., Zhu, Q., et al. 2020, ApJ, 891, 16 [CrossRef] [Google Scholar]
- Chiang, S. Y., & Lin, I. F. 2005, J. Chem. Phys., 122, 094301 [NASA ADS] [CrossRef] [Google Scholar]
- Chicharro, D. V., Poullain, S. M., Zanchet, A., et al. 2019, Chem. Sci., 10, 6494 [CrossRef] [Google Scholar]
- Cleeves, L. I., Adams, F. C., & Bergin, E. A. 2013, ApJ, 772, 5 [Google Scholar]
- Cleeves, L. I., Bergin, E. A., & Adams, F. C. 2014, ApJ, 794, 123 [NASA ADS] [CrossRef] [Google Scholar]
- Cleeves, L. I., Bergin, E. A., Qi, C., Adams, F. C., & Öberg, K. I. 2015, ApJ, 799, 204 [CrossRef] [Google Scholar]
- Coates, A. J., Crary, F. J., Lewis, G. R., et al. 2007, Geophys. Res. Lett., 34, L22103 [NASA ADS] [CrossRef] [Google Scholar]
- Codella, C., Lopez-Sepulcre, A., Ohashi, S., et al. 2022, MNRAS, 515, 543 [CrossRef] [Google Scholar]
- Continetti, R. E. 2001, Annu. Rev. Phys. Chem., 52, 165 [NASA ADS] [CrossRef] [Google Scholar]
- Cool, T. A., Wang, J., Nakajima, K., Taatjes, C. A., & Mcllroy, A. 2005, Int. J. Mass Spectr., 247, 18 [NASA ADS] [CrossRef] [Google Scholar]
- Cooley, J. W. 1961, Math. Comput., 15, 363 [Google Scholar]
- Cooper, G., Burton, G., & Brion, C. 1995, J. Electron. Spectros. Relat. Phenomena, 73, 139 [CrossRef] [Google Scholar]
- Coppens, P., & Drowart, J. 1995, Chem. Phys. Lett., 243, 108 [NASA ADS] [CrossRef] [Google Scholar]
- Cordiner, M. A., Charnley, S. B., Buckle, J. V., Walsh, C., & Millar, T. J. 2011, ApJ, 730, L18 [NASA ADS] [CrossRef] [Google Scholar]
- Cordiner, M. A., Buckle, J. V., Wirstrom, E. S., Olofsson, A. O. H., & Charnley, S. B. 2013, ApJ, 770, 48 [NASA ADS] [CrossRef] [Google Scholar]
- Cosby, P., & Helm, H. 1988, Chem. Phys. Lett., 152, 71 [NASA ADS] [CrossRef] [Google Scholar]
- Coutens, A., Ligterink, N. F. W., Loison, J.-C., et al. 2019, A&A, 623, L13 [NASA ADS] [CrossRef] [EDP Sciences] [Google Scholar]
- Cravens, T., & Dalgarno, A. 1978, ApJ, 219, 750 [NASA ADS] [CrossRef] [Google Scholar]
- Cravens, T. E., Robertson, I. P., Waite, J. H., et al. 2006, Geophys. Res. Lett., 33, L07105 [NASA ADS] [CrossRef] [Google Scholar]
- Cui, G., Zhang, F., & Fang, W. 2010, J. Chem. Phys., 132, 034306 [NASA ADS] [CrossRef] [Google Scholar]
- Curdt, W., Brekke, P., Feldman, U., et al. 2001, A&A, 375, 591 [NASA ADS] [CrossRef] [EDP Sciences] [Google Scholar]
- Dalgarno, A. 2006a, PNAS, 103, 12269 [NASA ADS] [CrossRef] [Google Scholar]
- Dalgarno, A. 2006b, Faraday Discuss., 133, 9 [NASA ADS] [CrossRef] [Google Scholar]
- de Oliveira, N., Roudjane, M., Joyeux, D., et al. 2011, Nat. Photon., 5, 149 [NASA ADS] [CrossRef] [Google Scholar]
- de Oliveira, N., Joyeux, D., Roudjane, M., et al. 2016, J. Synchrotron Radiat., 23, 887 [CrossRef] [Google Scholar]
- Decin, L. 2021, ARA&A, 59, 337 [NASA ADS] [CrossRef] [Google Scholar]
- Desai, R. T., Coates, A. J., Wellbrock, A., et al. 2017, ApJ, 844, L18 [NASA ADS] [CrossRef] [Google Scholar]
- Deyerl, H.-J., Fischer, I., & Chen, P. 1999, J. Chem. Phys., 111, 3441 [NASA ADS] [CrossRef] [Google Scholar]
- Dixon, R. N., & Kirby, G. H. 1968, Trans. Faraday Soc., 64, 2002 [CrossRef] [Google Scholar]
- Dodson, L. G., Shen, L., Savee, J. D., et al. 2015, J. Phys. Chem. A., 119, 1279 [NASA ADS] [CrossRef] [Google Scholar]
- Dodson, L. G., Savee, J. D., Gozem, S., et al. 2018, J. Chem. Phys., 148, 184302 [NASA ADS] [CrossRef] [Google Scholar]
- Doner, A. C., Moran, H. A., Webb, A. R., et al. 2022, J. Quant. Spectr. Rad. Transf., 108438 [Google Scholar]
- Draine, B. 1978, ApJS, 36, 595 [NASA ADS] [CrossRef] [Google Scholar]
- Draine, B. T. 2003a, ARA&A, 41, 241 [NASA ADS] [CrossRef] [Google Scholar]
- Draine, B. T. 2003b, ApJ, 598, 1017 [NASA ADS] [CrossRef] [Google Scholar]
- Draine, B. T. 2003c, ApJ, 598, 1026 [Google Scholar]
- Draine, B., & Lee, H. 1984, ApJ, 285, 89 [NASA ADS] [CrossRef] [Google Scholar]
- Draine, B. T., & Tan, J. C. 2003, ApJ, 594, 347 [NASA ADS] [CrossRef] [Google Scholar]
- Drozdovskaya, M. N., Walsh, C., Visser, R., Harsono, D., & van Dishoeck, E. F. 2014, MNRAS, 445, 913 [NASA ADS] [CrossRef] [Google Scholar]
- Drozdovskaya, M. N., van Dishoeck, E. F., Jorgensen, J. K., et al. 2018, MNRAS, 476, 4949 [NASA ADS] [CrossRef] [Google Scholar]
- Drummond, B., Tremblin, P., Baraffe, I., et al. 2016, A&A, 594, A69 [NASA ADS] [CrossRef] [EDP Sciences] [Google Scholar]
- Drury, C., & Moule, D. 1982, J. Mol. Spectr., 92, 469 [NASA ADS] [CrossRef] [Google Scholar]
- Dutrey, A., Guilloteau, S., & Guelin, M. 1997, A&A, 317, L55 [NASA ADS] [Google Scholar]
- Duval, S. E., Bosman, A. D., & Bergin, E. A. 2022, ApJ, 934, L25 [NASA ADS] [CrossRef] [Google Scholar]
- Dyke, J. 1987, J. Chem. Soc. Faraday Trans., 83, 69 [CrossRef] [Google Scholar]
- Dyke, J. M. 2019, Phys. Chem. Chem. Phys., 21, 9106 [NASA ADS] [CrossRef] [Google Scholar]
- Dyke, J. M., Gamblin, S. D., Haggerston, D., et al. 1998, J. Chem. Phys., 108, 6258 [NASA ADS] [CrossRef] [Google Scholar]
- Eddington, A. S. 1928, MNRAS, 88, 352 [NASA ADS] [CrossRef] [Google Scholar]
- Eisfeld, W. 2006, J. Phys. Chem. A., 110, 3903 [NASA ADS] [CrossRef] [Google Scholar]
- Eland, J. H. D. 1970, Philos. Trans. Roy. Soc. A., 268, 87 [NASA ADS] [Google Scholar]
- Engin, S., Sisourat, N., & Carniato, S. 2012, J. Chem. Phys., 137, 154304 [NASA ADS] [CrossRef] [Google Scholar]
- Eppink, A., & Parker, D. H. 1997, Rev. Sci. Instrum., 68, 3477 [NASA ADS] [CrossRef] [Google Scholar]
- Fahr, A., Hassanzadeh, P., Laszlo, B., & Huie, R. E. 1997, Chem. Phys., 215, 59 [NASA ADS] [CrossRef] [Google Scholar]
- Fahr, A., Hassanzadeh, P., & Atkinson, D. B. 1998, Chem. Phys., 236, 43 [NASA ADS] [CrossRef] [Google Scholar]
- Felsmann, D., Moshammer, K., Krueger, J., et al. 2015, Proc. Combust. Inst., 35, 779 [CrossRef] [Google Scholar]
- Felsmann, D., Lucassen, A., Kruger, J., et al. 2016, Z. Phys. Chem. Intern. J. Res. Phys. Chem., 230, 1067 [Google Scholar]
- Feng, R. F., Cooper, G., & Brion, C. E. 2000, Chem. Phys., 260, 391 [NASA ADS] [CrossRef] [Google Scholar]
- Feng, R. F., Cooper, G., & Brion, C. E. 2001, Chem. Phys., 270, 319 [NASA ADS] [CrossRef] [Google Scholar]
- Fernández-Milán, P., Borràs, V. J., González-Vázquez, J., & Martín, F. 2023, J. Chem. Phys., 158, 134305 [CrossRef] [Google Scholar]
- France, K., Schindhelm, E., Bergin, E. A., Roueff, E., & Abgrall, H. 2014, ApJ, 784, 127 [NASA ADS] [CrossRef] [Google Scholar]
- Frederix, P. W. J. M., Yang, C.-H., Groenenboom, G. C., et al. 2009, J. Phys. Chem. A., 113, 14995 [NASA ADS] [CrossRef] [Google Scholar]
- Friedl, R., Brune, W., & Anderson, J. 1983, J. Chem. Phys., 79, 4227 [NASA ADS] [CrossRef] [Google Scholar]
- Fu, B., Han, Y., & Bowman, J. M. 2012, Faraday Discuss., 157, 27 [NASA ADS] [CrossRef] [Google Scholar]
- Fuente, A., Cernicharo, J., Roueff, E., et al. 2016, A&A, 593, A94 [NASA ADS] [CrossRef] [EDP Sciences] [Google Scholar]
- Fuente, A., Goicoechea, J. R., Pety, J., et al. 2017, ApJ, 851, L49 [NASA ADS] [CrossRef] [Google Scholar]
- Fuentetaja, R., Agúndez, M., Cabezas, C., et al. 2022, A&A, 667, A4 [Google Scholar]
- Fujimoto, M. M., Tanaka, H. K., Marinho, R. R. T., et al. 2020, J. Phys. Chem. A., 124, 6478 [NASA ADS] [CrossRef] [Google Scholar]
- Gabici, S. 2022, A&ARv„ 30, 4 [CrossRef] [Google Scholar]
- Gans, B., Mendes, L. A. V., Boye-Peronne, S., et al. 2010, J. Phys. Chem. A., 114, 3237 [NASA ADS] [CrossRef] [Google Scholar]
- Gans, B., Boyé-Péronne, S., Broquier, M., et al. 2011a, Phys. Chem. Chem. Phys., 13, 8140 [NASA ADS] [CrossRef] [Google Scholar]
- Gans, B., Garcia, G. A., Boyé-Péronne, S., et al. 2011b, J. Phys. Chem. A., 115, 5387 [NASA ADS] [CrossRef] [Google Scholar]
- Gans, B., Holzmeier, F., Krüger, J., et al. 2016, J. Chem. Phys., 144, 204307 [NASA ADS] [CrossRef] [Google Scholar]
- Gans, B., Garcia, G. A., Holzmeier, F., et al. 2017, J. Chem. Phys., 146, 011101 [NASA ADS] [CrossRef] [Google Scholar]
- Gans, B., Garcia, G. A., Boyé-Péronne, S., et al. 2019, Phys. Chem. Chem. Phys., 21, 2337 [NASA ADS] [CrossRef] [Google Scholar]
- Gao, H., & Ng, C.-Y. 2019, Chin. J. Chem. Phys., 32, 23 [NASA ADS] [CrossRef] [Google Scholar]
- Gao, H., Song, Y., Yang, L., et al. 2011a, J. Chem. Phys., 135, 221101 [Google Scholar]
- Gao, H., Yang, L., Pan, Y., et al. 2011b, J. Chem. Phys., 135, 134319 [NASA ADS] [CrossRef] [Google Scholar]
- Gao, H., Song, Y., Yang, L., et al. 2012, J. Chem. Phys., 137, 034305 [Google Scholar]
- Gao, H., Song, Y., Chang, Y.-C., et al. 2013, J. Phys. Chem. A., 117, 6185 [NASA ADS] [CrossRef] [Google Scholar]
- Gao, H., Song, Y., Jackson, W. M., & Ng, C.-Y. 2020, Chin. J. Chem. Phys., 33, 91 [Google Scholar]
- Garcia, G. A., Cunha de Miranda, B. K., Tia, M., Daly, S., & Nahon, L. 2013, Rev. Sci. Instrum., 84, 053112-053112-11 [Google Scholar]
- Garcia, G. A., Tang, X., Gil, J.-F., et al. 2015, J. Chem. Phys., 142, 164201 [NASA ADS] [CrossRef] [Google Scholar]
- Garcia, G. A., Gans, B., Krüger, J., et al. 2018, Phys. Chem. Chem. Phys., 20, 8707 [NASA ADS] [CrossRef] [Google Scholar]
- Garcia, G. A., Loison, J.-C., Holzmeier, F., et al. 2021, Mol. Phys., 119, e1825851 [NASA ADS] [CrossRef] [Google Scholar]
- Gibson, S. 2016, https://zenodo.org/record/56871 [Google Scholar]
- Gibson, S. T., Greene, J. P., & Berkowitz, J. 1985, J. Chem. Phys., 83, 4319 [NASA ADS] [CrossRef] [Google Scholar]
- Godard, B., Falgarone, E., Gerin, M., et al. 2012, A&A, 540, A87 [NASA ADS] [CrossRef] [EDP Sciences] [Google Scholar]
- Goicoechea, J. R., Rodriguez-Fernandez, N. J., & Cernicharo, J. 2004, ApJ, 600, 214 [CrossRef] [Google Scholar]
- Goicoechea, J. R., Aguado, A., Cuadrado, S., et al. 2021, A&A, 647, A10 [EDP Sciences] [Google Scholar]
- Goldhaber, D. M., & Betz, A. L. 1984, ApJ, 279, L55 [NASA ADS] [CrossRef] [Google Scholar]
- González-Vázquez, J., Marante, C., Klinker, M., et al. 2023, XChem_v1, e-cienciaDatos, V3 [Google Scholar]
- Gordon, I. E., Rothman, L. S., Hargreaves, R. J., et al. 2022, J. Quant. Spectr. Rad. Transf., 277, 107949 [NASA ADS] [CrossRef] [Google Scholar]
- Gredel, R., & Dalgarno, A. 1995, ApJ, 446, 852 [NASA ADS] [CrossRef] [Google Scholar]
- Gredel, R., Lepp, S., & Dalgarno, A. 1987, ApJ, 323, L137 [Google Scholar]
- Gredel, R., Lepp, S., Dalgarno, A., & Herbst, E. 1989, ApJ, 347, 289 [Google Scholar]
- Guardiola, R., & Ros, J. 1982a, J. Comput. Phys., 45, 374 [NASA ADS] [CrossRef] [Google Scholar]
- Guardiola, R., & Ros, J. 1982b, J. Comput. Phys., 45, 390 [NASA ADS] [CrossRef] [Google Scholar]
- Hachey, M., & Grein, F. 1995a, Can. J. Phys., 73, 18 [NASA ADS] [CrossRef] [Google Scholar]
- Hachey, M. & Grein, F. 1995b, Chem. Phys., 197, 61 [NASA ADS] [CrossRef] [Google Scholar]
- Haider, S. A., Abdu, M. A., Batista, I. S., et al. 2009, J. Geophys. Res., 114, A03311 [NASA ADS] [Google Scholar]
- Hama, T., & Watanabe, N. 2013, Chem. Rev., 113, 8783 [Google Scholar]
- Han, Y.-C., Tsai, P.-Y., Bowman, J. M., & Lin, K.-C. 2017, Phys. Chem. Chem. Phys., 19, 18628 [NASA ADS] [CrossRef] [Google Scholar]
- Harada, N., Nishimura, Y., Watanabe, Y., et al. 2019, ApJ, 871, 238 [NASA ADS] [CrossRef] [Google Scholar]
- Harper, O. J., Hassenfratz, M., Loison, J. C., et al. 2019, J. Chem. Phys., 150 [Google Scholar]
- Harper, O. J., Boyé-Péronne, S., Garcia, G. A., et al. 2020a, J. Chem. Phys., 152, 041105 [NASA ADS] [CrossRef] [Google Scholar]
- Harper, O. J., Hassenfratz, M., Loison, J.-C., et al. 2020b, J. Chem. Phys., 152, 189903 [NASA ADS] [CrossRef] [Google Scholar]
- Harper, O. J., Gans, B., Loison, J.-C., et al. 2021, J. Phys. Chem. A., 125, 2764 [NASA ADS] [CrossRef] [Google Scholar]
- Harper, O. J., Chen, N. L., Boye-Peronne, S., & Gans, B. 2022, Phys. Chem. Chem. Phys., 24, 2777 [NASA ADS] [CrossRef] [Google Scholar]
- Harrison, A. W., Kharazmi, A., Shaw, M. F., et al. 2019, Phys. Chem. Chem. Phys., 21, 14284 [NASA ADS] [CrossRef] [Google Scholar]
- Hartweg, S., Loison, J.-C., Boyé-Péronne, S., et al. 2020, J. Phys. Chem. A., 124, 6050 [NASA ADS] [CrossRef] [Google Scholar]
- Hatano, Y. 1999a, Radiat. Environ. Biophys., 38, 239 [CrossRef] [Google Scholar]
- Hatano, Y. 1999b, Phys. Rep, 313, 110 [Google Scholar]
- Hatano, Y. 2001, J. Electron. Spectros. Relat. Phenomena, 119, 107 [CrossRef] [Google Scholar]
- Heays, A. N., Visser, R., Gredel, R., et al. 2014, A&A, 562, A61 [NASA ADS] [CrossRef] [EDP Sciences] [Google Scholar]
- Heays, A. N., Bosman, A. D., & van Dishoeck, E. F. 2017, A&A, 602, A105 [NASA ADS] [CrossRef] [EDP Sciences] [Google Scholar]
- Heays, A. N., de Oliveira, N., Gans, B., et al. 2018, J. Quant. Spectr. Rad. Transf., 204, 12 [NASA ADS] [CrossRef] [Google Scholar]
- Heazlewood, B. R., Rowling, S. J., Maccarone, A. T., Jordan, M. J. T., & Kable, S. H. 2009, J. Chem. Phys., 130, 054310 [NASA ADS] [CrossRef] [Google Scholar]
- Heimann, P. A., Koike, M., Hsu, C. W., et al. 1997, Rev. Sci. Instrum., 68, 1945 [NASA ADS] [CrossRef] [Google Scholar]
- Hemberger, P., van Bokhoven, J. A., Perez-Ramirez, J., & Bodi, A. 2020, Catal. Sci. Technol., 10, 1975 [CrossRef] [Google Scholar]
- Hemberger, P., Bodi, A., Bierkandt, T., et al. 2021, Energy Fuels, 35, 16265 [CrossRef] [Google Scholar]
- Hemberger, P., Wu, X., Pan, Z., & Bodi, A. 2022, J. Phys. Chem. A., 126, 2196 [NASA ADS] [CrossRef] [Google Scholar]
- Herbst, E., Millar, T., Wlodek, S., & Bohme, D. 1989, A&A, 222, 205 [NASA ADS] [Google Scholar]
- Herzberg, G. 1950, Molecular Spectra and Molecular Structure I. Spectra of Diatomic Molecules (Princeton: Van Nostrand) [Google Scholar]
- Hill, C., Yurchenko, S. N., & Tennyson, J. 2013, Icarus, 226, 1673 [NASA ADS] [CrossRef] [Google Scholar]
- Hily-Blant, P., Maret, S., Bacmann, A., et al. 2010, A&A, 521, A52 [Google Scholar]
- Hitchcock, A., Williams, G., Brion, C., & Langhoff, P. 1984, Chem. Phys., 88, 65 [NASA ADS] [CrossRef] [Google Scholar]
- Hochlaf, M. 2017, Phys. Chem. Chem. Phys., 19, 21236 [NASA ADS] [CrossRef] [Google Scholar]
- Holzmeier, F., Lang, M., Fischer, I., et al. 2015, J. Chem. Phys., 142, 184306 [NASA ADS] [CrossRef] [Google Scholar]
- Holzmeier, F., Fischer, I., Kiendl, B., et al. 2016, Phys. Chem. Chem. Phys., 18, 9240 [NASA ADS] [CrossRef] [Google Scholar]
- Hrodmarsson, H. R., Garcia, G. A., Nahon, L., Loison, J.-C., & Gans, B. 2019a, Phys. Chem. Chem. Phys., 21, 25907 [NASA ADS] [CrossRef] [Google Scholar]
- Hrodmarsson, H. R., Garcia, G. A., Nahon, L., Loison, J.-C., & Gans, B. 2019b, J. Phys. Chem. A, 123, 9193 [NASA ADS] [CrossRef] [Google Scholar]
- Hrodmarsson, H. R., Garcia, G. A., Nahon, L., Loison, J.-C., & Gans, B. 2021, J. Mol. Spectr., 381, 111533 [NASA ADS] [CrossRef] [Google Scholar]
- Huang, C., Yang, B., Zhang, F., & Tian, G. 2018, Combust. Flame, 198, 334 [CrossRef] [Google Scholar]
- Hung, K.-C., Tsai, P.-Y., Li, H.-K., & Lin, K.-C. 2014, J. Chem. Phys., 140, 064313 [NASA ADS] [CrossRef] [Google Scholar]
- Hunziker, H., Kneppe, H., McLean, A., Siegbahn, P., & Wendt, H. 1983, Can. J. Chem., 61, 993 [CrossRef] [Google Scholar]
- Hurzeler, H., Inghram, M., & Morrison, J. 1958, J. Chem. Phys., 28, 76 [NASA ADS] [CrossRef] [Google Scholar]
- Indriolo, N. 2012, Philos. Trans. Roy. Soc. A., 370, 5142 [NASA ADS] [CrossRef] [Google Scholar]
- Indriolo, N., & McCall, B. J. 2012, ApJ, 745, 91 [NASA ADS] [CrossRef] [Google Scholar]
- Indriolo, N., Neufeld, D. A., DeWitt, C. N., et al. 2015, ApJ, 802, L14 [NASA ADS] [CrossRef] [Google Scholar]
- Ivlev, A. V., Silsbee, K., Sipilae, O., & Caselli, P. 2019, ApJ, 884, 176 [NASA ADS] [CrossRef] [Google Scholar]
- Jacovella, U., Gans, B., & Merkt, F. 2013, J. Chem. Phys., 139, 084308 [NASA ADS] [CrossRef] [Google Scholar]
- Jessup, K. L., Spencer, J., & Yelle, R. 2007, Icarus, 192, 24 [NASA ADS] [CrossRef] [Google Scholar]
- Jin, M., Lee, J.-E., & Kim, K.-T. 2015, ApJS, 219, 2 [Google Scholar]
- Johns, J., & Ramsay, D. 1961, Can. J. Phys., 39, 210 [NASA ADS] [CrossRef] [Google Scholar]
- Johnson, B. 1978, J. Chem. Phys., 69, 4678 [NASA ADS] [CrossRef] [Google Scholar]
- Johnson, M., Bodi, A., Schulz, L., & Gerber, T. 2009, Nucl. Instrum. Methods. Phys. Res. A., 610, 597 [CrossRef] [Google Scholar]
- Jolly, G. S., Singleton, D. L., & Paraskevopoulos, G. 1987, J. Phys. Chem., 91, 3463 [CrossRef] [Google Scholar]
- Kameta, K., Ukai, M., Kamosaki, T., et al. 1992, J. Chem. Phys., 96, 4911 [NASA ADS] [CrossRef] [Google Scholar]
- Kameta, K., Machida, S., Kitajima, M., et al. 1996, J. Electron. Spectros. Relat. Phenomena, 79, 391 [CrossRef] [Google Scholar]
- Kameta, K., Ukai, M., Chiba, R., et al. 1998, J. Chem. Phys., 95, 1456 [Google Scholar]
- Kameta, K., Kouchi, N., Ukai, M., & Hatano, Y. 2002, J. Electron. Spectros. Relat. Phenomena, 123, 225 [CrossRef] [Google Scholar]
- Kawashima, Y., & Ikoma, M. 2019, ApJ, 877, 109 [NASA ADS] [CrossRef] [Google Scholar]
- Keller-Rudek, H., Moortgat, G. K., Sander, R., & Sörensen, R. 2013, Earth Syst. Sci. Data, 5, 365 [NASA ADS] [CrossRef] [Google Scholar]
- Kim, S. J., Ah’earn, M. F., Wellnitz, D. D., Meier, R., & Lee, Y. S. 2003, Icarus, 166, 157 [NASA ADS] [CrossRef] [Google Scholar]
- Kirby, K. P., & Van Dishoeck, E. F. 1989, in Advances in Atomic and Molecular Physics, eds. D. Bates, & B. Bederson (Elsevier), 25, 437 [NASA ADS] [CrossRef] [Google Scholar]
- Knutson, H. A., Howard, A. W., & Isaacson, H. 2010, ApJ, 720, 1569 [NASA ADS] [CrossRef] [Google Scholar]
- Koch, A. 1997, J. Phys. Chem. A., 101, 1460 [NASA ADS] [CrossRef] [Google Scholar]
- Kral, Q., Matra, L., Wyatt, M. C., & Kennedy, G. M. 2017, MNRAS, 469, 521 [NASA ADS] [CrossRef] [Google Scholar]
- Kral, Q., Marino, S., Wyatt, M. C., Kama, M., & Matra, L. 2019, MNRAS, 489, 3670 [NASA ADS] [Google Scholar]
- Kroto, H., & Suffolk, R. 1972, Chem. Phys. Lett., 15, 545 [NASA ADS] [CrossRef] [Google Scholar]
- Krueger, J., Garcia, G. A., Felsmann, D., et al. 2014, Phys. Chem. Chem. Phys., 16, 22791 [NASA ADS] [CrossRef] [Google Scholar]
- Kulander, K. C., & Heller, E. J. 1978, J. Chem. Phys., 69, 2439 [NASA ADS] [CrossRef] [Google Scholar]
- Kumar, S. S., Hauser, D., Jindra, R., et al. 2013, ApJ, 776, 25 [NASA ADS] [CrossRef] [Google Scholar]
- Langford, S. R., Batten, A. D., Kono, M., & Ashfold, M. N. R. 1997, J. Chem. Soc. Faraday Trans., 93, 3757 [CrossRef] [Google Scholar]
- Langhoff, S. R., & Jaffe, R. L. 1979, J. Chem. Phys., 71, 1475 [NASA ADS] [CrossRef] [Google Scholar]
- Larsson, B., Liseau, R., Pagani, L., et al. 2007, A&A, 466, 999 [NASA ADS] [CrossRef] [EDP Sciences] [Google Scholar]
- Larsson, M., Geppert, W. D., & Nyman, G. 2012, Rep. Prog. Phys., 75, 066901 [NASA ADS] [CrossRef] [Google Scholar]
- Latif, M. A., & Khochfar, S. 2019, MNRAS, 490, 2706 [NASA ADS] [CrossRef] [Google Scholar]
- Leach, S., Schwell, M., Dulieu, F., et al. 2002, Phys. Chem. Chem. Phys., 4, 5025 [NASA ADS] [CrossRef] [Google Scholar]
- Lee, S., & Sun, H. S. 2001, Bull. Korean Chem. Soc., 22, 210 [Google Scholar]
- Lee, S., Sun, H., Kim, B., & Freed, K. F. 2001, J. Chem. Phys., 114, 5537 [NASA ADS] [CrossRef] [Google Scholar]
- Lee, K. L. K., Quinn, M. S., Maccarone, A. T., et al. 2014, Chem. Sci., 5, 4633 [CrossRef] [Google Scholar]
- Lefebvre-Brion, H., & Field, R. W. 1986, Perturbations in the Spectra of Diatomic Molecules (Academic Press) [Google Scholar]
- Lefebvre-Brion, H., & Field, R. W. 2004, The Spectra and Dynamics of Diatomic Molecules (Academic Press) [Google Scholar]
- Le Gal, R., Oberg, K., Loomis, R. A., Pegues, J., & Bergner, J. B. 2019, ApJ, 876, 72 [NASA ADS] [CrossRef] [Google Scholar]
- Le Roy, R. J. 2017, J. Quant. Spectr. Rad. Transf., 186, 167 [NASA ADS] [CrossRef] [Google Scholar]
- Lewerenz, M., Bruna, P., Peyerimhoff, S., & Buenker, R. 1983a, J. Phys. B., 16, 4511 [NASA ADS] [CrossRef] [Google Scholar]
- Lewerenz, M., Bruna, P., Peyerimhoff, S., & Buenker, R. 1983b, Mol. Phys., 49, 1 [NASA ADS] [CrossRef] [Google Scholar]
- Lewis, B. R., Gibson, S. T., Stark, G., & Heays, A. N. 2018, J. Chem. Phys., 148, 244303 [NASA ADS] [CrossRef] [Google Scholar]
- Li, A., & Draine, B. T. 2001, ApJ, 550, L213 [NASA ADS] [CrossRef] [Google Scholar]
- Li, X., Heays, A. N., Visser, R., et al. 2013, A&A, 555, A14 [NASA ADS] [CrossRef] [EDP Sciences] [Google Scholar]
- Li, H.-K., Tsai, P.-Y., Hung, K.-C., Kasai, T., & Lin, K.-C. 2015, J. Chem. Phys., 142, 041101 [NASA ADS] [CrossRef] [Google Scholar]
- Li, X., Millar, T. J., Heays, A. N., et al. 2016, A&A, 588, A4 [NASA ADS] [CrossRef] [EDP Sciences] [Google Scholar]
- Liao, C. L., & Ng, C. Y. 1986, J. Chem. Phys., 84, 778 [NASA ADS] [CrossRef] [Google Scholar]
- Limão-Vieira, P., Eden, S., Mason, N., & Hoffmann, S. 2003, Chem. Phys. Lett., 376, 737 [CrossRef] [Google Scholar]
- Long, F., Bosman, A. D., Cazzoletti, P., et al. 2021, A&A, 647, A118 [NASA ADS] [CrossRef] [EDP Sciences] [Google Scholar]
- Loomis, R. A., Burkhardt, A. M., Shingledecker, C. N., et al. 2021, Nat. Astron., 5, 188 [NASA ADS] [CrossRef] [Google Scholar]
- Lu, Z., Chang, Y. C., Gao, H., et al. 2014, J. Chem. Phys., 140, 231101 [NASA ADS] [CrossRef] [Google Scholar]
- Luo, Y., Shlosman, I., Nagamine, K., & Fang, T. 2020, MNRAS, 492, 4917 [NASA ADS] [CrossRef] [Google Scholar]
- Madhusudhan, N. 2019, ARA&A, 57, 617 [NASA ADS] [CrossRef] [Google Scholar]
- Madhusudhan, N., Agúndez, M., Moses, J. I., & Hu, Y. 2016, Space Sci. Rev., 205, 285 [Google Scholar]
- Majumdar, L., Gratier, P., Vidal, T., et al. 2016, MNRAS, 458, 1859 [NASA ADS] [CrossRef] [Google Scholar]
- Marante, C., Argenti, L., & Martin, F. 2014, Phys. Rev. A., 90, 012506 [CrossRef] [Google Scholar]
- Marante, C., Klinker, M., Corral, I., et al. 2017a, J. Chem. Theory Comput., 13, 499 [CrossRef] [Google Scholar]
- Marante, C., Klinker, M., Kjellsson, T., et al. 2017b, Phys. Rev. A., 96, 022507 [CrossRef] [Google Scholar]
- Maret, S., & Bergin, E. A. 2007, ApJ, 664, 956 [Google Scholar]
- Marggi Poullain, S., Chicharro, D. V., Zanchet, A., et al. 2019, Phys. Chem. Chem. Phys., 21, 23017 [NASA ADS] [CrossRef] [Google Scholar]
- Martín-Doménech, R., Jiménez-Serra, I., Muñoz Caro, G. M., et al. 2016, A&A, 585, A112 [NASA ADS] [CrossRef] [EDP Sciences] [Google Scholar]
- Martinez, R., Buitrago, A., Howell, N., Hearn, C., & Joens, J. 1992, Atmos. Environ. A. Gen. Top., 26, 785 [CrossRef] [Google Scholar]
- Mathis, J., Mezger, P., & Panagia, N. 1983, A&A, 128, 212 [NASA ADS] [Google Scholar]
- McAdam, K., Veyret, B., & Lesclaux, R. 1987, Chem. Phys. Lett., 133, 39 [NASA ADS] [CrossRef] [Google Scholar]
- McCarthy, M. C., Gottlieb, C. A., Gupta, H., & Thaddeus, P. 2006, ApJ, 652, L141 [NASA ADS] [CrossRef] [Google Scholar]
- McGuire, B. A. 2022, ApJS, 259, 30 [NASA ADS] [CrossRef] [Google Scholar]
- McGuire, B. A., Burkhardt, A. M., Loomis, R. A., et al. 2020, ApJ, 900, L10 [Google Scholar]
- Menten, K. M., Wyrowski, F., Belloche, A., et al. 2011, A&A, 525, A77 [CrossRef] [EDP Sciences] [Google Scholar]
- Mercier, X., Faccinetto, A., Batut, S., et al. 2020, Phys. Chem. Chem. Phys., 22, 15926 [NASA ADS] [CrossRef] [Google Scholar]
- Merrill, P. 1955, PASP, 67, 199 [NASA ADS] [CrossRef] [Google Scholar]
- Millar, T. J., Walsh, C., Cordiner, M. A., Ní Chuimín, R., & Herbst, E. 2007, ApJ, 662, L87 [NASA ADS] [CrossRef] [Google Scholar]
- Millar, T. J., Walsh, C., & Field, T. A. 2017, Chem. Rev., 117, 1765 [CrossRef] [Google Scholar]
- Miotello, A., Facchini, S., van Dishoeck, E. F., & Bruderer, S. 2018, A&A, 619, A113 [NASA ADS] [CrossRef] [EDP Sciences] [Google Scholar]
- Mitsuke, K., Hattori, H., & Yoshida, H. 1993a, J. Chem. Phys., 99, 6642 [NASA ADS] [CrossRef] [Google Scholar]
- Mitsuke, K., Yoshida, H., & Hattori, H. 1993b, Z. Phys. D., 27, 267 [NASA ADS] [CrossRef] [Google Scholar]
- Mizus, I. I., Polyansky, O. L., McKemmish, L. K., et al. 2019, Mol. Phys., 117, 1663 [NASA ADS] [CrossRef] [Google Scholar]
- Moor, A., Kral, Q., Abraham, P., et al. 2019, ApJ, 884, 108 [CrossRef] [Google Scholar]
- Morajkar, P., Bossolasco, A., Schoemaecker, C., & Fittschen, C. 2014, J. Chem. Phys., 140, 214308 [NASA ADS] [CrossRef] [Google Scholar]
- Mukundan, V., & Bhardwaj, A. 2018, ApJ, 856, 168 [NASA ADS] [CrossRef] [Google Scholar]
- Munk, J., Pagsberg, P., Ratajczak, E., & Sillesen, A. 1986, J. Phys. Chem., 90, 2752 [CrossRef] [Google Scholar]
- Murillo, N. M., van Dishoeck, E. F., van der Wiel, M. H. D., et al. 2018, A&A, 617, A120 [NASA ADS] [CrossRef] [EDP Sciences] [Google Scholar]
- Nahon, L., de Oliveira, N., Garcia, G. A., et al. 2012, J. Synchrotron Radiat., 19, 508 [CrossRef] [PubMed] [Google Scholar]
- Nee, J., Suto, M., & Lee, L. 1985, J. Phys. B., 18, L293 [NASA ADS] [CrossRef] [Google Scholar]
- Neufeld, D. A., & Wolfire, M. G. 2009, ApJ, 706, 1594 [Google Scholar]
- Neufeld, D. A., & Wolfire, M. G. 2016, ApJ, 826, 183 [Google Scholar]
- Neufeld, D. A., Falgarone, E., Gerin, M., et al. 2012, A&A, 542, A6 [Google Scholar]
- Neufeld, D. A., Godard, B., Gerin, M., et al. 2015, A&A, 577, A49 [NASA ADS] [CrossRef] [EDP Sciences] [Google Scholar]
- Nguyen, T. L., Mebel, A. M., & Kaiser, R. I. 2001a, J. Phys. Chem. A., 105, 3284 [NASA ADS] [CrossRef] [Google Scholar]
- Nguyen, T. L., Mebel, A. M., Lin, S. H., & Kaiser, R. I. 2001b, J. Phys. Chem. A., 105, 11549 [NASA ADS] [CrossRef] [Google Scholar]
- Nickerson, S., Teyssier, R., & Rosdahl, J. 2018, MNRAS, 479, 3206 [NASA ADS] [CrossRef] [Google Scholar]
- Noll, K., Mcgrath, M., Trafton, L., et al. 1995, Science, 267, 1307 [CrossRef] [Google Scholar]
- Norwood, K., Nourbakhsh, S., He, G., & Ng, C. 1991, Chem. Phys. Lett., 184, 147 [NASA ADS] [CrossRef] [Google Scholar]
- Notsu, S., van Dishoeck, E. F., Walsh, C., Bosman, A. D., & Nomura, H. 2021, A&A, 650, A180 [NASA ADS] [CrossRef] [EDP Sciences] [Google Scholar]
- Noumerov, B. V. 1924, MNRAS, 84, 592 [NASA ADS] [CrossRef] [Google Scholar]
- Nunes, Y., Martins, G., Mason, N. J., et al. 2010, Phys. Chem. Chem. Phys., 12, 15734 [CrossRef] [Google Scholar]
- Öberg, K. I., & Bergin, E. A. 2021, Phys. Rep., 893, 1 [Google Scholar]
- Okabe, H. 1970, J. Chem. Phys., 53, 3507 [NASA ADS] [CrossRef] [Google Scholar]
- Osborn, D. L., Zou, P., Johnsen, H., et al. 2008, Rev. Sci. Instrum., 79, 104103 [NASA ADS] [CrossRef] [Google Scholar]
- Osted, A., Kongsted, J., & Christiansen, O. 2005, J. Phys. Chem. A., 109, 1430 [NASA ADS] [CrossRef] [Google Scholar]
- Padial, N., Collins, L., & Schneider, B. 1985, ApJ, 298, 369 [NASA ADS] [CrossRef] [Google Scholar]
- Padovani, M., & Galli, D. 2011, A&A, 530, A109 [NASA ADS] [CrossRef] [EDP Sciences] [Google Scholar]
- Padovani, M., Galli, D., & Glassgold, A. E. 2009, A&A, 501, 619 [NASA ADS] [CrossRef] [EDP Sciences] [Google Scholar]
- Padovani, M., Hennebelle, P., & Galli, D. 2013, A&A, 560, A114 [NASA ADS] [CrossRef] [EDP Sciences] [Google Scholar]
- Padovani, M., Marcowith, A., Hennebelle, P., & Ferrière, K. 2016, A&A, 590, A8 [NASA ADS] [CrossRef] [EDP Sciences] [Google Scholar]
- Padovani, M., Galli, D., Ivlev, A., Caselli, P., & Ferrara, A. 2018a, A&A, 619, A144 [NASA ADS] [CrossRef] [EDP Sciences] [Google Scholar]
- Padovani, M., Ivlev, A. V., Galli, D., & Caselli, P. 2018b, A&A, 614, A111 [NASA ADS] [CrossRef] [EDP Sciences] [Google Scholar]
- Padovani, M., Ivlev, A. V., Galli, D., et al. 2020, Space Sci. Rev., 216, 29 [CrossRef] [Google Scholar]
- Pan, Z., Bodi, A., Bokhoven, V. J. A., & Hemberger, P. 2022, Phys. Chem. Chem. Phys., 24, 3655 [NASA ADS] [CrossRef] [Google Scholar]
- Parise, B., Bergman, P., & Du, F. 2012, A&A, 541, A11 [NASA ADS] [CrossRef] [EDP Sciences] [Google Scholar]
- Petrignani, A., Bing, D., Novotny, O., et al. 2010, J. Phys. Chem. A., 114, 4864 [NASA ADS] [CrossRef] [Google Scholar]
- Pety, J., Gratier, P., Guzmán, V., et al. 2012, A&A, 548, A68 [NASA ADS] [CrossRef] [EDP Sciences] [Google Scholar]
- Pezzella, M., Yurchenko, S. N., & Tennyson, J. 2021, Phys. Chem. Chem. Phys., 23, 16390 [NASA ADS] [CrossRef] [Google Scholar]
- Pezzella, M., Tennyson, J., & Yurchenko, S. N. 2022, MNRAS, 514, 4413 [NASA ADS] [CrossRef] [Google Scholar]
- Phan, V. H. M., Morlino, G., & Gabici, S. 2018, MNRAS, 480, 5167 [NASA ADS] [Google Scholar]
- Phan, V. H. M., Schulze, F., Mertsch, P., Recchia, S., & Gabici, S. 2021, Phys. Rev. Lett., 127, 141101 [NASA ADS] [CrossRef] [Google Scholar]
- Phuong, N. T., Chapillon, E., Majumdar, L., et al. 2018, A&A, 616, A5 [NASA ADS] [CrossRef] [EDP Sciences] [Google Scholar]
- Pieper, J., Schmitt, S., Hemken, C., et al. 2018, Z. Phys. Chem. Intern. J. Res. Phys. Chem., 232, 153 [Google Scholar]
- Platzman, R. 1962, Radiat. Res., 16, 419 [NASA ADS] [CrossRef] [Google Scholar]
- Podio, L., Lefloch, B., Ceccarelli, C., Codella, C., & Bachiller, R. 2014, A&A, 565, A64 [NASA ADS] [CrossRef] [EDP Sciences] [Google Scholar]
- Ponzi, A., Angeli, C., Cimiraglia, R., Coriani, S., & Decleva, P. 2014, J. Chem. Phys., 140, 204304 [NASA ADS] [CrossRef] [Google Scholar]
- Pouilly, B., Robbe, J., Schamps, J., & Roueff, E. 1983, J. Phys. B., 16, 437 [NASA ADS] [CrossRef] [Google Scholar]
- Poully, J. C., Schermann, J. P., Nieuwjaer, N., et al. 2010, Phys. Chem. Chem. Phys., 12, 3566 [CrossRef] [Google Scholar]
- Pradhan, A. D., & Partridge, H. 1996, Chem. Phys. Lett., 255, 163 [NASA ADS] [CrossRef] [Google Scholar]
- Prasad, S., & Tarafdar, S. 1983, ApJ, 267, 603 [NASA ADS] [CrossRef] [Google Scholar]
- Qi, C., Öberg, K. I., Wilner, D. J., & Rosenfeld, K. A. 2013, ApJ, 765, L14 [NASA ADS] [CrossRef] [Google Scholar]
- Qin, Z., Bai, T., & Liu, L. 2022, MNRAS, 516, 550 [NASA ADS] [CrossRef] [Google Scholar]
- Qu, Q., Yurchenko, S. N., & Tennyson, J. 2022, J. Chem. Theory Comput., 18, 1808 [CrossRef] [Google Scholar]
- Recchia, S., Phan, V. H. M., Biswas, S., & Gabici, S. 2019, MNRAS, 485, 2276 [NASA ADS] [CrossRef] [Google Scholar]
- Resende, S. M., & Ornellas, F. R. 2001, J. Chem. Phys., 115, 2178 [NASA ADS] [CrossRef] [Google Scholar]
- Reusch, E., Holzmeier, F., Constantinidis, P., Hemberger, P., & Fischer, I. 2017, Angew. Chem. Int. Ed., 56, 8000 [CrossRef] [Google Scholar]
- Riaz, B., Thi, W.-F., & Caselli, P. 2019, MNRAS, 483, 1139 [NASA ADS] [CrossRef] [Google Scholar]
- Rizzo, J. R., Fuente, A., & Garcia-Burillo, S. 2005, ASP Conf. Ser., 344, 184 [NASA ADS] [Google Scholar]
- Roberge, W. G., Jones, D., Lepp, S., & Dalgarno, A. 1991, ApJS, 77, 287 [Google Scholar]
- Robertson, I. P., Cravens, T. E., Waite, J. H., et al. 2009, Planet. Space Sci., 57, 1834 [NASA ADS] [CrossRef] [Google Scholar]
- Robinson, J. C., Sveum, N. E., & Neumark, D. M. 2003, J. Chem. Phys., 119, 5311 [NASA ADS] [CrossRef] [Google Scholar]
- Rosch, D., Caravan, R. L., Taatjes, C. A., et al. 2021, J. Phys. Chem. A., 125, 7920 [NASA ADS] [CrossRef] [Google Scholar]
- Rosi, M., Mancini, L., Skouteris, D., et al. 2018, Chem. Phys. Lett., 695, 87 [NASA ADS] [CrossRef] [Google Scholar]
- Roueff, E., Alekseyev, A. B., & Le Bourlot, J. 2014, A&A, 566, A30 [NASA ADS] [CrossRef] [EDP Sciences] [Google Scholar]
- Russell, C. T., Luhmann, J. G., & Strangeway, R. J. 2006, Planet. Space Sci., 54, 1482 [Google Scholar]
- Sabatini, G., Bovino, S., Giannetti, A., et al. 2020, A&A, 644, A34 [EDP Sciences] [Google Scholar]
- Sakai, N., Sakai, T., & Yamamoto, S. 2008, ApJ, 673, L71 [NASA ADS] [CrossRef] [Google Scholar]
- Sakai, N., Shiino, T., Hirota, T., Sakai, T., & Yamamoto, S. 2010, ApJ, 718, L49 [NASA ADS] [CrossRef] [Google Scholar]
- Sauval, A. 1969, Solar Phys., 10, 319 [NASA ADS] [CrossRef] [Google Scholar]
- Savee, J. D., Soorkia, S., Welz, O., et al. 2012, J. Chem. Phys., 136, 134307 [NASA ADS] [CrossRef] [Google Scholar]
- Savee, J. D., Sztáray, B., Welz, O., Taatjes, C. A., & Osborn, D. L. 2021, J. Phys. Chem. A., 125, 3874 [NASA ADS] [CrossRef] [Google Scholar]
- Saxon, R., Lengsfield, B., & Liu, B. 1983, J. Chem. Phys., 78, 312 [NASA ADS] [CrossRef] [Google Scholar]
- Schwell, M., Jochims, H.-W., Baumgärtel, H., Dulieu, F., & Leach, S. 2006, Planet. Space Sci., 54, 1073 [NASA ADS] [CrossRef] [Google Scholar]
- Schwell, M., Gaie-Levrel, F., Benilan, Y., et al. 2013, EAS Publ. Ser., 58, 301 [Google Scholar]
- Shaw, M. F., Sztaray, B., Whalley, L. K., et al. 2018, Nat. Commun., 9, 2584 [NASA ADS] [CrossRef] [Google Scholar]
- Shi, X., Yin, Q.-Z., Gao, H., et al. 2017, ApJ, 850, 48 [NASA ADS] [CrossRef] [Google Scholar]
- Shi, X., Gao, H., Yin, Q.-Z., et al. 2018, J. Phys. Chem. A., 122, 8136 [NASA ADS] [CrossRef] [Google Scholar]
- Shin, S. K., Han, E. J., & Kim, H. L. 1998, J. Photochem. Photobiol. A, 118, 71 [CrossRef] [Google Scholar]
- Silsbee, K., & Ivlev, A. V. 2019, ApJ, 879, 14 [NASA ADS] [CrossRef] [Google Scholar]
- Silsbee, K., Ivlev, A. V., Padovani, M., & Caselli, P. 2018, ApJ, 863, 188 [Google Scholar]
- Simon, B. 2000, J. Math. Phys., 41, 3523 [NASA ADS] [CrossRef] [Google Scholar]
- Singleton, D., Paraskevopoulos, G., & Irwin, R. 1987, J. Photochem., 37, 209 [CrossRef] [Google Scholar]
- Singleton, D. L., Paraskevopoulos, G., & Irwin, R. S. 1989, Res. Chem. Intermed., 12, 1 [CrossRef] [Google Scholar]
- Singleton, D. L., Paraskevopoulos, G., & Irwin, R. S. 1990, J. Phys. Chem., 94, 695 [CrossRef] [Google Scholar]
- Skinner, D., & Wise, J. H. 2020, MNRAS, 492, 4386 [NASA ADS] [CrossRef] [Google Scholar]
- Smith, W., & Liszt, H. 1971, J. Quant. Spectr. Rad. Transf., 11, 45 [NASA ADS] [CrossRef] [Google Scholar]
- Song, Y., Gao, H., Chang, Y. C., et al. 2016, ApJ, 819, 23 [Google Scholar]
- Spencer, J. R., Jessup, K. L., McGrath, M. A., Ballester, G. E., & Yelle, R. 2000, Science, 288, 1208 [Google Scholar]
- Stark, G., Yoshino, K., & Smith, P. 1987, J. Mol. Spectr., 124, 420 [NASA ADS] [CrossRef] [Google Scholar]
- Stark, G., Herde, H., Lyons, J. R., et al. 2018, J. Chem. Phys., 148, 244302 [NASA ADS] [CrossRef] [Google Scholar]
- Stecher, T., & Williams, D. 1967, ApJ, 149, L29 [NASA ADS] [CrossRef] [Google Scholar]
- Sternberg, A., & Dalgarno, A. 1995, ApJS, 99, 565 [NASA ADS] [CrossRef] [Google Scholar]
- Sternberg, A., Gurman, A., & Bialy, S. 2021, ApJ, 920, 83 [NASA ADS] [CrossRef] [Google Scholar]
- Suto, M., Wang, X., & Lee, L. C. 1988a, J. Phys. Chem., 92, 3764 [CrossRef] [Google Scholar]
- Suto, M., Ye, C., & Lee, L. C. 1988b, J. Chem. Phys., 89, 6555 [NASA ADS] [CrossRef] [Google Scholar]
- Taatjes, C. A., Hansen, N., Osborn, D. L., et al. 2008, Phys. Chem. Chem. Phys., 10, 20 [CrossRef] [Google Scholar]
- Tabayashi, K., Aoyama, J.-I., Matsui, M., Hino, T., & Saito, K. 1999, J. Chem. Phys., 110, 9547 [NASA ADS] [CrossRef] [Google Scholar]
- Tabone, B., Godard, B., des Forets, G. P., Cabrit, S., & van Dishoeck, E. F. 2020, A&A, 636, A60 [NASA ADS] [CrossRef] [EDP Sciences] [Google Scholar]
- Tabone, B., van Hemert, M. C., van Dishoeck, E. F., & Black, J. H. 2021, A&A, 650, A192 [NASA ADS] [CrossRef] [EDP Sciences] [Google Scholar]
- Talbi, D., & Ellinger, Y. 1996, Chem. Phys. Lett., 263, 385 [NASA ADS] [CrossRef] [Google Scholar]
- Tang, X., Zhou, X., Sun, Z., et al. 2014, J. Chem. Phys., 140, 044312 [NASA ADS] [CrossRef] [Google Scholar]
- Tang, X., Garcia, G. A., & Nahon, L. 2015a, J. Phys. Chem. A., 119, 5942 [NASA ADS] [CrossRef] [Google Scholar]
- Tang, X., Garcia, G. A., Gil, J.-F., & Nahon, L. 2015b, Rev. Sci. Instrum., 86 [Google Scholar]
- Tang, X., Lin, X., Zhang, W., Garcia, G. A., & Nahon, L. 2016, Phys. Chem. Chem. Phys., 18, 23923 [NASA ADS] [CrossRef] [Google Scholar]
- Tennyson, J., Lodi, L., McKemmish, L. K., & Yurchenko, S. N. 2016a, J. Phys. B., 49, 102001 [NASA ADS] [CrossRef] [Google Scholar]
- Tennyson, J., Yurchenko, S. N., Al-Refaie, A. F., et al. 2016b, J. Mol. Spectr., 327, 73 [NASA ADS] [CrossRef] [Google Scholar]
- Tenorio, B. N. C., Nascimento, M. A. C., & Rocha, A. B. 2019, J. Chem. Phys., 150, 154308 [NASA ADS] [CrossRef] [Google Scholar]
- Thaddeus, P., Gottlieb, C. A., Hjalmarson, A., et al. 1985a, ApJ, 294, L49 [NASA ADS] [CrossRef] [Google Scholar]
- Thaddeus, P., Vrtilek, J. M., & Gottlieb, C. A. 1985b, ApJ, 299, L63 [NASA ADS] [CrossRef] [Google Scholar]
- Tielens, A. G. G. M. 2013, Rev. Mod. Phys., 85, 1021 [NASA ADS] [CrossRef] [Google Scholar]
- Tielens, A., & Hollenbach, D. 1985, ApJ, 291, 722 [NASA ADS] [CrossRef] [Google Scholar]
- Tinetti, G., Drossart, P., Eccleston, P., et al. 2018, Exp. Astron., 46, 135 [NASA ADS] [CrossRef] [Google Scholar]
- Toffoli, D., & Lucchese, R. R. 2004, J. Chem. Phys., 120, 6010 [NASA ADS] [CrossRef] [Google Scholar]
- Toulson, B. W., Kapnas, K. M., Fishman, D. A., & Murray, C. 2017, Phys. Chem. Chem. Phys., 19, 14276 [NASA ADS] [CrossRef] [Google Scholar]
- Tranter, R. S., Lynch, P. T., & Yang, X. 2013, Proc. Combust. Inst., 34, 591 [CrossRef] [Google Scholar]
- Tychoniec, L., van Dishoeck, E. F., van’t Hoff, M. L. R., et al. 2021, A&A, 655, A65 [NASA ADS] [CrossRef] [EDP Sciences] [Google Scholar]
- Urbain, X., Dochain, A., Marion, R., Launoy, T., & Loreau, J. 2019, Philos. Trans. Royal Soc. A, 377, 20180399 [NASA ADS] [CrossRef] [Google Scholar]
- van der Wiel, M. H. D., Jacobsen, S. K., Jorgensen, J. K., et al. 2019, A&A, 626, A93 [NASA ADS] [CrossRef] [EDP Sciences] [Google Scholar]
- Van de Sande, M., & Millar, T. J. 2022, MNRAS, 510, 1204 [Google Scholar]
- van Dishoeck, E. F. 1987, J. Chem. Phys., 86, 196 [NASA ADS] [CrossRef] [Google Scholar]
- van Dishoeck, E. F. 1988, Astrophys. Space Sci. Lib., 146, 49 [NASA ADS] [CrossRef] [Google Scholar]
- van Dishoeck, E. F. 2004, ARA&A, 42, 119 [NASA ADS] [CrossRef] [Google Scholar]
- van Dishoeck, E. F. 2014, Faraday Discuss., 168, 9 [NASA ADS] [CrossRef] [Google Scholar]
- van Dishoeck, E. F., & Dalgarno, A. 1984a, Icarus, 59, 305 [NASA ADS] [CrossRef] [Google Scholar]
- van Dishoeck, E. F., & Dalgarno, A. 1984b, ApJ, 277, 576 [NASA ADS] [CrossRef] [Google Scholar]
- van Dishoeck, E. F., & Visser, R. 2015, in Laboratory Astrochemistry: From Molecules through Nanoparticles to Grains (Weinheim: Wiley-VCH) [Google Scholar]
- van Dishoeck, E., van Hemert, M., Allison, A., & Dalgarno, A. 1984, J. Chem. Phys., 81, 5709 [NASA ADS] [CrossRef] [Google Scholar]
- van Dishoeck, E. F., Jonkheid, B., & van Hemert, M. C. 2006, Faraday Discuss., 133, 231 [Google Scholar]
- van Dishoeck, E. F., Herbst, E., & Neufeld, D. A. 2013, Chem. Rev., 113, 9043 [Google Scholar]
- van Hemert, M., & van Dishoeck, E. 2008, Chem. Phys., 343, 292 [NASA ADS] [CrossRef] [Google Scholar]
- van ‘t Hoff, M. L. R., Walsh, C., Kama, M., Facchini, S., & van Dishoeck, E. F. 2017, A&A, 599, A101 [CrossRef] [EDP Sciences] [Google Scholar]
- van ‘t Hoff, M. L. R., Persson, M. V., Harsono, D., et al. 2018, A&A, 613, A29 [NASA ADS] [CrossRef] [EDP Sciences] [Google Scholar]
- van ‘t Hoff, M. L. R., Dishoeck, V. E. F., Jørgensen, J. K., & Calcutt, H. 2020, A&A, 633, A7 [CrossRef] [EDP Sciences] [Google Scholar]
- van ‘t Hoff, M. L. R., Harsono, D., van Gelder, M. L., et al. 2022, ApJ, 924, 5 [CrossRef] [Google Scholar]
- Vaupre, S., Hily-Blant, P., Ceccarelli, C., et al. 2014, A&A, 568, A50 [NASA ADS] [CrossRef] [EDP Sciences] [Google Scholar]
- Vega, M. V., Lavín, C., Velasco, A. M., & Martín, I. 2010, Theor. Chem. Acc., 127, 411 [CrossRef] [Google Scholar]
- Venot, O., Rocchetto, M., Carl, S., Hashim, A. R., & Decin, L. 2016, ApJ, 830, 77 [NASA ADS] [CrossRef] [Google Scholar]
- Venot, O., Bénilan, Y., Fray, N., et al. 2018a, A&A, 609, A34 [NASA ADS] [CrossRef] [EDP Sciences] [Google Scholar]
- Venot, O., Drummond, B., Miguel, Y., et al. 2018b, Exp. Astron., 46, 101 [NASA ADS] [CrossRef] [Google Scholar]
- Visscher, C., Lodders, K., & Fegley, B. 2010, ApJ, 716, 1060 [NASA ADS] [CrossRef] [Google Scholar]
- Visser, R., van Dishoeck, E. F., & Black, J. H. 2009, A&A, 503, 323 [NASA ADS] [CrossRef] [EDP Sciences] [Google Scholar]
- Visser, R., Bruderer, S., Cazzoletti, P., et al. 2018, A&A, 615, A75 [NASA ADS] [CrossRef] [EDP Sciences] [Google Scholar]
- Vuitton, V., Yelle, R. V., & Anicich, V. G. 2006, ApJ, 647, L175 [NASA ADS] [CrossRef] [Google Scholar]
- Walmsley, C. M., Pineau des Forêts, G., & Flower, D. R. 1999, A&A, 342, 542 [NASA ADS] [Google Scholar]
- Walsh, C., Nomura, H., Millar, T. J., & Aikawa, Y. 2012, ApJ, 747, 114 [NASA ADS] [CrossRef] [Google Scholar]
- Walsh, C., Nomura, H., & van Dishoeck, E. F. 2015, A&A, 582, A88 [NASA ADS] [CrossRef] [EDP Sciences] [Google Scholar]
- Wang, J., Yang, B., Cool, T. A., & Hansen, N. 2010, Int. J. Mol., 292, 14 [Google Scholar]
- Wang, K., Liu, J., Wang, Y., Yang, C., & Liu, Y. 2021, A&A, 654, A172 [NASA ADS] [CrossRef] [EDP Sciences] [Google Scholar]
- Weingartner, J. C., & Draine, B. T. 2001a, ApJ, 548, 296 [Google Scholar]
- Weingartner, J. C., & Draine, B. T. 2001b, ApJ, 553, 581 [NASA ADS] [CrossRef] [Google Scholar]
- Weingartner, J. C., & Draine, B. T. 2001c, ApJ, 563, 842 [NASA ADS] [CrossRef] [Google Scholar]
- Weingartner, J. C., & Draine, B. T. 2001d, ApJS, 134, 263 [CrossRef] [Google Scholar]
- Wheeler, M. D., Newman, S. M., & Orr-Ewing, A. J. 1998, J. Chem. Phys., 108, 6594 [NASA ADS] [CrossRef] [Google Scholar]
- Wolcott-Green, J., & Haiman, Z. 2019, MNRAS, 484, 2467 [NASA ADS] [CrossRef] [Google Scholar]
- Wolfire, M. G., Vallini, L., & Chevance, M. 2022, ARA&A, 60, 247 [NASA ADS] [CrossRef] [Google Scholar]
- Woods, T. N., Prinz, D. K., Rottman, G. J., et al. 1996, J. Geophys. Res. Atmos., 101, 9541 [CrossRef] [Google Scholar]
- Woods, P. M., Millar, T. J., Herbst, E., & Zijlstra, A. A. 2003, A&A, 402, 189 [NASA ADS] [CrossRef] [EDP Sciences] [Google Scholar]
- Wu, X., Zhou, X., Hemberger, P., & Bodi, A. 2019, Phys. Chem. Chem. Phys., 21, 22238 [NASA ADS] [CrossRef] [Google Scholar]
- Xu, H., & Pratt, S. T. 2013, J. Phys. Chem. A., 117, 9331 [NASA ADS] [CrossRef] [Google Scholar]
- Xu, Z., Luo, N., Federman, S. R., et al. 2019, ApJ, 882, 86 [NASA ADS] [CrossRef] [Google Scholar]
- Yamaguchi, Y., Hoffman, B. C., Stephens, J. C., & Schaefer, H. F. 1999, J. Phys. Chem. A., 103, 7701 [NASA ADS] [CrossRef] [Google Scholar]
- Yamamoto, S., Saito, S., Ohishi, M., et al. 1987, ApJ, 322, L55 [Google Scholar]
- Yang, B., Wang, J., Cool, T. A., et al. 2012, Int. J. Mol., 309, 118 [Google Scholar]
- Yang, C.-H., Bhattacharyya, S., Liu, L., Fang, W.-H., & Liu, K. 2020, Chem. Sci., 11, 6423 [CrossRef] [Google Scholar]
- Yang, C.-H., Bhattacharyya, S., & Liu, K. 2021, J. Phys. Chem. A., 125, 6450 [NASA ADS] [CrossRef] [Google Scholar]
- Yencha, A. J., Siggel-King, M. R., King, G. C., Malins, A. E., & Eypper, M. 2013, J. Electron. Spectros. Relat. Phenomena, 187, 65 [CrossRef] [Google Scholar]
- Yoshida, H., & Mitsuke, K. 1994, J. Chem. Phys., 100, 8817 [NASA ADS] [CrossRef] [Google Scholar]
- Yoshida, H., & Mitsuke, K. 1996, J. Electron. Spectros. Relat. Phenomena, 79, 487 [CrossRef] [Google Scholar]
- Yurchenko, S. N., Lodi, L., Tennyson, J., & Stolyarov, A. V. 2016, Comput. Phys. Commun., 202, 262 [NASA ADS] [CrossRef] [Google Scholar]
- Yurchenko, S. N., Al-Refaie, A. F., & Tennyson, J. 2018, A&A, 614, A131 [NASA ADS] [CrossRef] [EDP Sciences] [Google Scholar]
- Zahnle, K., Marley, M. S., Freedman, R. S., Lodders, K., & Fortney, J. J. 2009, ApJ, 701, L20 [Google Scholar]
- Zanchet, A., Agúndez, M., Herrero, V. J., Aguado, A., & Roncero, O. 2013, AJ, 146, 125 [NASA ADS] [CrossRef] [Google Scholar]
- Zanchet, A., Lique, F., Roncero, O., Goicoechea, J. R., & Bulut, N. 2019, A&A, 626, A103 [NASA ADS] [CrossRef] [EDP Sciences] [Google Scholar]
- Zeng, S., Zhang, Q., Jiménez-Serra, I., et al. 2020, MNRAS, 497, 4896 [NASA ADS] [CrossRef] [Google Scholar]
- Zhang, Z., Chen, Z., Huang, C., et al. 2014a, J. Phys. Chem. A., 118, 2413 [NASA ADS] [CrossRef] [Google Scholar]
- Zhang, Z.-G., Chen, Z.-C., Zhan, C.-M., et al. 2014b, Chin. J. Chem. Phys., 27, 249 [NASA ADS] [CrossRef] [Google Scholar]
- Zhang, Z.-G., Xin, M., Wu, Y.-N., et al. 2018a, Chin. J. Chem. Phys., 31, 735 [NASA ADS] [CrossRef] [Google Scholar]
- Zhang, Z.-G., Xin, M., Zhao, S.-T., & Chen, Y. 2018b, Chin. J. Chem. Phys., 31, 27 [NASA ADS] [CrossRef] [Google Scholar]
- Zhang, L., Shu, Y., Sun, S., & Truhlar, D. G. 2021, J. Chem. Phys., 154, 094310 [NASA ADS] [CrossRef] [Google Scholar]
- Zheng, X., Song, Y., & Zhang, J. 2009, J. Phys. Chem. A., 113, 4604 [NASA ADS] [CrossRef] [Google Scholar]
All Tables
Calculated photodissociation rates of H+ and comparisons to current entries in the database.
Calculated photoionization rates of CH and comparisons to previous entries in the database.
Calculated photoionization rates of C2 and comparisons to previous entries in the database.
Calculated photodissociation rates of OH and comparisons to previous entries in the database.
Calculated photoionization rates of NH2 and comparisons to previous entries in the database.
Calculated photoionization rates of CH3CHO and comparisons to previous entries in the database.
Calculated photoionization rates of SH and comparisons to previous entries in the database.
Calculated photodissociation rates of CS and comparisons to previous entries in the database.
Calculated photoionization rates of CS and comparisons to previous entries in the database.
Calculated photodissociation rates of S2 and comparisons to previous entries in the database.
Calculated photoionization rates of S2 and comparisons to previous entries in the database.
Integrated fluxes of the radiation fields and conversion factor used to normalize them.
All Figures
|
Fig. 1 Cross sections of |
| In the text | |
|
Fig. 2 Cross sections of c-C3H and HC3H c-C3H2, C3H3, C4H−,C6H−, OH, and HO2. Photodissociation is presented in red. Photoionization is presented in green. Dissociation and ionization thresholds are shown with broken gray lines. |
| In the text | |
|
Fig. 3 Cross sections of HCO, HCOOH, NH2, HNC, HNCO, CH3CHO, CH3OCH3, and CH3OCHO. Photodissociation is presented in red. Photoionization is presented in green. Dissociation and ionization thresholds are shown with broken gray lines. |
| In the text | |
|
Fig. 4 Cross sections of SH, CS, H2CS, S2, SiH, HF. Photodissociation is presented in red. Photoionization is presented in green. Dissociation and ionization thresholds are shown with broken gray lines. |
| In the text | |
Current usage metrics show cumulative count of Article Views (full-text article views including HTML views, PDF and ePub downloads, according to the available data) and Abstracts Views on Vision4Press platform.
Data correspond to usage on the plateform after 2015. The current usage metrics is available 48-96 hours after online publication and is updated daily on week days.
Initial download of the metrics may take a while.