| Issue |
A&A
Volume 673, May 2023
|
|
|---|---|---|
| Article Number | A54 | |
| Number of page(s) | 17 | |
| Section | Stellar structure and evolution | |
| DOI | https://doi.org/10.1051/0004-6361/202345916 | |
| Published online | 04 May 2023 | |
What governs the spin distribution of very young < 1 Myr low-mass stars
1
Department of Astrophysics, University of Vienna, Türkenschanzstrasse 17, 1180 Vienna, Austria
e-mail: This email address is being protected from spambots. You need JavaScript enabled to view it.
2
Research Institute of Physics, Southern Federal University, Stachki Ave. 194, Rostov-on-Don 344090, Russia
Received:
16
January
2023
Accepted:
18
March
2023
Abstract
Context. The origin of the stellar spin distribution at young ages is still unclear. Even in very young clusters (∼1 Myr), a significant spread is observed in rotational periods ranging from ≲1 to ∼10 days.
Aims. We study the parameters that might govern the spin distribution of low-mass stars (≲1.0 M⊙) during the first million years of their evolution.
Methods. We compute the evolution and rotational periods of young stars, using the MESA code, starting from a stellar seed, and take protostellar accretion, stellar winds, and magnetic star–disk interaction into account. Furthermore, we add a certain fraction of the energy of accreted material into the stellar interior as additional heat and combine the resulting effects on stellar evolution with the stellar spin model.
Results. For different combinations of parameters, stellar periods at an age of 1 Myr range between 0.6 days and 12.9 days. Thus, during the relatively short time period of 1 Myr, a significant amount of stellar angular momentum can already be removed by the interaction between the star and its accretion disk. The amount of additional heat added into the stellar interior, the accretion history, and the presence of a disk and stellar winds have the strongest impact on the stellar spin evolution during the first million years. The slowest stellar rotations result from a combination of strong magnetic fields, a large amount of additional heat, and effective winds. The fastest rotators combine weak magnetic fields and ineffective winds or result from a small amount of additional heat added to the star. Scenarios that could lead to such configurations are discussed. Different initial rotation periods of the stellar seed, on the other hand, quickly converge and do not affect the stellar period at all.
Conclusions. Our model matches up to 90% of the observed rotation periods in six young clusters (≲3 Myr). Based on these intriguing results, we were motivated to combine our model with a hydrodynamic disk evolution code to self-consistently include several important aspects, such as episodic accretion events, magnetic disk winds, and internal and external photoevaporation. This combined model could replace the widely used disk-locking model during the lifetime of the accretion disk, and could provide valuable insights into the origin of the rotational period distribution of young clusters.
Key words: accretion / accretion disks / stars: protostars / stars: rotation / stars: formation
© The Authors 2023
 Open Access article, published by EDP Sciences, under the terms of the Creative Commons Attribution License (https://creativecommons.org/licenses/by/4.0), which permits unrestricted use, distribution, and reproduction in any medium, provided the original work is properly cited.
This article is published in open access under the Subscribe to Open model. This email address is being protected from spambots. You need JavaScript enabled to view it. to support open access publication.
1. Introduction
The origin of the stellar spin and angular momentum (AM) distribution of young stars still poses problems for stellar evolution models. Observations of stellar rotation in young clusters over the last decade have provided valuable insights into the evolution of the stellar spin and AM (e.g., Herbst et al. 2002; Rebull et al. 2006; Irwin et al. 2008; Irwin & Bouvier 2009; Hartmann 2009; Affer et al. 2013; Gallet & Bouvier 2013; Rebull et al. 2020; Serna et al. 2021). In particular, the early distribution (≲10 Myr) of stellar spin and AM is an important benchmark for gyrochronology studies (e.g., Barnes 2007) and can affect stellar high-energy radiation of low-mass stars (e.g., Pallavicini et al. 1981; Micela et al. 1985; Wright et al. 2011; France et al. 2018).
We want to focus on the first million years of stellar evolution, in which the star is embedded in an envelope and surrounded by an accretion disk. During the accretion disk phase, it is assumed that the accretion disk plays an important role in regulating the stellar spin distribution. Mass and AM can be exchanged between the star and the disk via magnetic field lines, influencing the stellar rotation period (e.g., Armitage & Clarke 1996; Matt & Pudritz 2005b; Matt et al. 2010). Early models propose that the star rotates at the orbital period of the inner disk boundary (disk-locking; e.g., Ghosh & Lamb 1979; Koenigl 1991). However, because of a limited region in which the magnetic field lines can connect to the accretion disk, the disk-locking mechanisms cannot remove enough AM from the star to counteract accretion and contraction, and does not explain the existence of slowly rotating stars (e.g., Matt & Pudritz 2005a,b; Zanni & Ferreira 2013). Since then additional mechanisms have been proposed that can remove AM from the star during the accretion disk phase. The process of accretion itself can drive accretion-powered stellar winds (APSWs; Matt & Pudritz 2005a), and disk material, called magnetospheric ejections (MEs), can be ejected along magnetic field lines (e.g., Zanni & Ferreira 2013) removing AM from the star.
Even at a very young age of ∼1 Myr, young clusters already show a significant spread in stellar rotation periods. Observations in the Orion Nebular Cluster (ONC, e.g., Herbst et al. 2002; Serna et al. 2021), NGC 2264 (e.g., Venuti et al. 2017), Taurus (Rebull et al. 2020), NGC 6530 (Henderson & Stassun 2012), and other young clusters (YSOVAR, Rebull et al. 2014) show rotation periods ranging from < 1 to ∼10 days. We note that there is a small number of stars rotating even faster or slower than this range at a young age (e.g., Rebull et al. 2014). To date, the parameters responsible for this large spread have not been constrained. Bouvier et al. (2014) argues that processes during the cloud collapse or the embedded phase might govern the rotational distribution at ∼1 Myr. Later studies have not solved for the very early stellar spin evolution and adopted the observed spread from ∼1 day to ∼10 days as initial conditions (e.g., Gallet 2019; Roquette et al. 2021).
To explore the parameter and processes responsible for the rotational distribution of low-mass stars (≲1 M⊙), we combine Modules for Experiments in Stellar Astrophysics (MESA Paxton et al. 2011, 2013, 2015, 2018, 2019) with a recent stellar spin evolution model presented by Ireland et al. (2021). Similar to current stellar evolution models, we start with a stellar seed (M⋆ = 0.05 M⊙) that accretes mass from the surrounding disk (e.g., Baraffe et al. 2012; Vorobyov et al. 2017b; Kunitomo et al. 2017; Steindl et al. 2021). A fraction of the gravitational energy of the accreted material is deposited into the stellar interior as additional heat, which can lead to an inflation of the stellar radius and affect the stellar evolution significantly (e.g., Vorobyov et al. 2017b; Kunitomo et al. 2017). The amount of additional heat depends on the fraction of energy deposited in the stellar interior, the region, in which the energy is deposited, and the accretion rate onto the star. The effect of these parameters on the stellar spin evolution is not clear, however, and has been tested in this study. Our model considers the influence of stellar inflation on the spin evolution of stars. It also takes into account different rotation rates of the stellar seed for the spin evolution of these stars. Furthermore, we can test a wide parameter space including the stellar magnetic field strength, the initial angular velocity distribution of the stellar seed, winds originating from the star and the disk, and the initial radii of the stellar seed.
Our results suggest that certain mechanisms and parameters have a major impact on the early stellar spin evolution, while others are virtually unimportant. Distinct slow and fast rotating models differ in the rotation period at an age of 1 Myr by up to two orders of magnitude. A comparison with observed rotational periods of six young clusters allows us to test these model results. This study is structured as follows. Section 2 summarizes the model highlights and defines the parameter space used in our simulations. The results are presented in Sect. 3, and discussed and compared to observations in Sect. 4. Finally, we summarize our conclusions in Sect. 5.
2. Model and parameter space
In this study we combine version v12778 of MESA with the stellar spin evolution model of Ireland et al. (2021). In the following we highlight important aspects of the respective models and provide the respective references for additional information. The adopted micro-physics and the treatment of rotation in MESA are summarized in Appendices A and B, respectively. The MESA input files for recreating our results are publicly available1.
2.1. Stellar evolution with MESA
Similar to recent stellar evolution studies (e.g., Kunitomo et al. 2017; Steindl et al. 2021), we start our simulations with a stellar seed with an initial stellar mass of Minit = 0.05 M⊙2, solar metallicity, Z⋆ = 0.014, and a deuterium abundance of 20 ppm. During the initial stages of stellar evolution, disk material is accreted onto the star. The associated energy of the accreted material is partly radiated away in the form of accretion luminosity
 (1)
(1)
and partly added to the stellar interior as additional heat
 (2)
(2)
with the stellar mass M⋆, the stellar radius R⋆, the gravitational constant G, and the accretion rate onto the star Ṁ⋆. The geometry of the accretion process is described by ϵ. Accretion from a thin accretion disk is described with ϵ ≤ 0.5 (Hartmann et al. 1997), and we chose ϵ = 0.5 for this study (e.g., Baraffe et al. 2009; Steindl et al. 2021). The amount of additional energy added to the star is controlled by β and is assumed to depend on the accretion rate (e.g., Baraffe et al. 2012; Vorobyov et al. 2017b; Kunitomo et al. 2017; Elbakyan et al. 2019; Steindl et al. 2021). During phases of low accretion rates, the disk is truncated at several stellar radii by magnetic field lines anchored in the star (e.g., Bessolaz et al. 2008; Hartmann et al. 2016). The disk material is channeled through “funnels” and is accreted onto the star at nearly free-fall speeds. Close to the stellar surface a shock front develops, and most of the material’s energy is radiated away (e.g., Koenigl 1991). As a result, only a small fraction of the accreted energy is added to the stellar interior and β is low. During phases of high accretion rates, the disk material is pushed toward the star and the stellar magnetic field is no longer able to channel the disk material into the funnel flows. Without the radiative loss of energy at the shocks close to the stellar surface a larger amount of energy can be added to the star. Based on previous studies, accretion rates of Ṁ⋆ ≳ 10−5 M⊙ yr−1 result in high values of β = βup and accretion rates of Ṁ⋆ ≲ 10−7 M⊙ yr−1 result in low values of β = βlow (e.g., Baraffe et al. 2012; Vorobyov et al. 2017b; Jensen & Haugbølle 2018). The value of β transitions smoothly between βup and βlow according to
 (3)
(3)
with the accretion rates in units of M⊙ yr−1. In this study we use βlow = 0.005 and vary βup between 0.005 (corresponding to the case of cold accretion, β = const. = 0.005) and 0.5 (corresponding to the case of warm or hybrid accretion). The additional heat Ėadd is distributed linearly starting from the stellar surface, down to a relative mass coordinate Madd (e.g., Kunitomo et al. 2017; Steindl et al. 2021). We chose Madd to be in the range of 0.01 − 0.1, meaning that Ėadd is distributed within the outer 1 − 10% of the stellar mass; Ėadd can cause the star to inflate, depending on the value of β and the position in the stellar interior up to which this energy is added Madd (e.g., Baraffe et al. 2009, 2012; Vorobyov et al. 2017b; Kunitomo et al. 2017; Steindl et al. 2021).
The outer atmospheric boundary condition is chosen according to Kunitomo et al. (2017). For stellar radii larger than 0.7 R⊙, we choose the photospheric table with an optical depth of τs = 2/3, a surface temperature Ts = Teff, and the surface pressure Ps obtained from PHOENIX (Hauschildt et al. 1999a,b) and ATLAS9 (Castelli & Kurucz 2003) model atmospheres. For smaller stellar radii, we adopt the τs = 100 model, in which Ps and Ts are calculated at τs = 100 from ATLAS9 and COND (Allard et al. 2001) model atmospheres.
2.2. Stellar spin evolution
In the scope of our model, the star rotates as a solid body with the stellar AM, J⋆ = I⋆Ω⋆; I⋆ and Ω⋆ are the stellar moment of inertia and angular velocity Ω⋆, respectively. External torques Γext change J⋆ according to  . This results in a stellar spin evolution according to
 (4)
(4)
The moment of inertia I⋆ is calculated by the MESA code and the external torque contributions Γext are calculated according to the description provided by Ireland et al. (2021). The contributions to Γext is composed of the influence of accretion Γacc, magnetospheric ejections Γme, and stellar winds Γw. The internal contributions due to accretion, mass loss, and changes in the stellar radius are combined in Γint = −İ⋆Ω⋆. An increase in stellar mass or stellar radius results in a positive İ⋆ and the star spins down, for example, during phases of stellar radius inflation. On the other hand, the star spins up if the star contracts. According to Ireland et al. (2021), the external torque contributions depend on different stellar parameters and disk parameters. We want to highlight the general dependencies and specific trends of the individual torque values. The applicability of the spin model presented in Ireland et al. (2021) for this study is discussed in Sect. 4.1. For additional information, we refer to the original article.
Accretion torqueΓacc. Material that accretes onto the star usually adds the AM of the disk material at the inner disk boundary to the star (e.g., Matt et al. 2010; Gallet 2019; Ireland et al. 2021), increasing the stellar AM, and causing a stellar spin-up according to
 (5)
(5)
with the disk rotation rate at the truncation radius Rr, Ω(Rt)3. The truncation radius in units of the stellar radius can be written as
 (6)
(6)
with Kt = 0.756, mt = 0.34, the stellar dipole field strength B⋆, and the escape velocity from the stellar surface vesc = (2GM⋆/R⋆)1/2. The disk at the truncation radius is assumed to rotate more slowly than the Keplerian velocity (e.g., Bessolaz et al. 2008; Zanni & Ferreira 2013) because of the removal of AM from the disk due to the magnetic star-disk interaction (e.g., Zanni & Ferreira 2013) or disk winds (e.g., Zhang et al. 2017). Thus, Ω(Rt) can be written as
 (7)
(7)
with the correction factor for the non-Keplerian rotation Kacc = 0.775, macc = −0.147, and the Keplerian rotation rate at the truncation radius ΩK(Rt).
Magnetic star-disk interaction. The influence of the magnetic star-disk interaction in Ireland et al. (2021) is modeled as magnetospheric ejections (MEs; Matt & Pudritz 2005b). MEs can transfer angular momentum between the star and the disk due to the twist of magnetic field lines that are rooted at the stellar surface and coupled to the disk material (e.g., Armitage & Clarke 1996; Matt & Pudritz 2005b; Zanni & Ferreira 2013; Ireland et al. 2021). The amount of angular momentum transferred to or away from the star depends on the relation between the truncation radius Rt and the co-rotation radius
![Mathematical equation: $$ \begin{aligned} R_\mathrm{co} = \left[ K_\mathrm{acc} \left( \frac{R_\mathrm{t} }{R_\star }\right)^{m_\mathrm{acc} } \right]^{2/3} \left( \frac{G M_\star }{\Omega ^2} \right)^{1/3} , \end{aligned} $$](/articles/aa/full_html/2023/05/aa45916-23/aa45916-23-eq9.gif) (8)
(8)
which includes the effect of non-Keplerian rotation. Disk material, which is coupled to the stellar magnetic field lines inside (outside) Rco rotates faster (slower) than the star and increases (decreases) the stellar angular momentum. This process is highly dynamic and complex. Thus, the following formulation should be treated with caution and interpreted as a time-averaged approximation. Following Ireland et al. (2021), the total torque due to MEs can be written as
![Mathematical equation: $$ \begin{aligned} \Gamma _\mathrm{ME} = K_\mathrm{ME} B_\star ^2 R_\star ^3 \left( \frac{R_\mathrm{t} }{R_\star } \right)^{m_\mathrm{ME} } \left[ 1 - \left(\frac{R_\mathrm{t} }{R_\mathrm{co} } \right)^{3/2} \right] , \end{aligned} $$](/articles/aa/full_html/2023/05/aa45916-23/aa45916-23-eq10.gif) (9)
(9)
with numerical fit parameters KME = 0.00772 and mME = −2.54. If Rt < Rco (Rt > Rco), the total torque due to MEs is positive (negative) and the star spins up (spins down).
Accretion-powered stellar wind (APSW). In the picture of an accretion-powered stellar wind, a certain fraction W of the accretion rate is ejected by the star; Ṁw = WṀ⋆. According to Weber & Davis (1967), the torque due to such a stellar outflow can be written as
 (10)
(10)
with the Alfvén radius rA. The Alfvén radius can be related to the open stellar magnetic flux (Réville et al. 2015) and based on numerical best-fit parameters (Ireland et al. 2021), the torque due to an APSW can be written as
![Mathematical equation: $$ \begin{aligned} \Gamma _\mathrm{w} = -K_\mathrm{w1} |{M}_\star | (G M_\star R_\star )^{1/2} W^{m_\mathrm{w1} } f^{m_\mathrm{w2} } \left[ 1+ \left( \frac{f}{K_\mathrm{w2} } \right)^2 \right]^{-m_\mathrm{w3} } \left( \frac{R_\mathrm{t} }{R_\star } \right)^{m_\mathrm{w4} } , \end{aligned} $$](/articles/aa/full_html/2023/05/aa45916-23/aa45916-23-eq12.gif) (11)
(11)
with best-fit parameters Kw1 = 57.92, mw1 = 0.254, mw2 = 1.092, Kw2 = 0.0356, mw3 = 0.373, mw4 = 0.195, and the fraction of the break-up rotation rate f = Ω⋆/Ωcrit. The torque due to stellar winds Γw always removes AM from the star.
2.3. Effects of different stellar rotation rates
Based on the spin evolution model presented above, we can predict the behavior of a star that rotates at a certain rate Ωold and spins up to Ωnew > Ωold, with all other parameters unchanged. First, the accretion torque Γacc is reduced (see Eq. (5)). Second, the torque due to the magnetic star-disk interaction ΓME is smaller as the co-rotation radius moves closer to the truncation radius for fast rotation rates (see Eq. (9)). Third, the rate of angular momentum that is removed by the APSW, Γw, increases (see Eq. (10)). An increasing stellar rotation rate (Ωnew > Ωold) would thus result in a spin-down torque, and the star would return to Ωold. Based on the same principles, a decreasing stellar rotation rate (Ωnew < Ωold) would result in a spin-up torque. Hence, Ωnew evolves back to Ωold; the timescale on which this change occurs is studied in Sect. 3.2.
2.4. Accretion rate onto the star
In this study we start from an initial mass of Minit = 0.05 and consider three different stellar masses at an age of 1 Myr: Mfinal = 0.3, 0.7, and 1.0 M⊙. The accretion rate is defined in two regimes. Initially, we assume a high constant accretion rate of Ṁinit = 5 × 10⁻⁶ M⊙ yr−1, which is equivalent to the mass infall rate  with the isothermal sound speed cs and an external temperature of ≈21 K (e.g., Vorobyov et al. 2017b). Thus, an initial stellar mass of Minit = 0.05 corresponds to an age of ∼104 years, assuming a roughly constant accretion rate during this time. After a specific time tacc, the accretion rate decreases according to a power law with an exponent of −1.5, Ṁ⋆(t)∝t−1.5. A stellar mass of 0.3, 0.7, and 1.0 M⊙ can be obtained at 1 Myr for tacc = 21.4, 54.5, and 81.5 kyr, respectively. Fig. 1 shows the evolution of the stellar accretion rate (Panel a) and the stellar mass (Panel b) for a final stellar mass of 0.3, 0.7, and 1.0 M⊙ (solid colored lines). To study the influence of a different accretion history, we increase the initial accretion rate to Ṁinit = 2 × 10⁻⁵ M⊙ yr−1 and decrease the power-law exponent to −2 (Ṁhigh dashed line). The final stellar mass at 1 Myr is also 0.7 M⊙ when using Ṁhigh.
 |
Fig. 1. Parameterized illustration of the stellar accretion rate and stellar mass during the first million years of stellar evolution. Panel a shows the accretion rate and Panel b shows the stellar mass over time. The yellow, black, and blue lines represent a final stellar mass of 0.3, 0.7, and 1.0 M⊙, respectively. The black dashed line (Ṁhigh) represents a different accretion history, which also results in a final stellar mass of 0.7 M⊙ at 1 Myr. |
2.5. Parameter space
Finding reasonable ranges for stellar and accretion parameters for very young embedded objects is challenging, due to the theoretical and observational uncertainties and the limited number of observations. The ranges for the free parameters presented below are based on previous studies, theoretical models, and observational results.
Magnetic field strengths. One important stellar parameter that influences the spin evolution model presented above is the magnetic field strength. It is assumed that the large-scale dipole field components control the spin evolution of young stars (e.g., Finley & Matt 2018). Small-scale field components, on the other hand, play only a minor role. We note that the results presented in Finley & Matt (2018) do not cover very young embedded objects with high accretion rates (see Sect. 4.1). Due to observational limitations, there is only a limited number of magnetic field estimates for Class I (0) objects. Based on the observation of magnetically sensitive line broadening (Zeeman effect), a total magnetic field strength of 2.9 ± 0.4 kG for WL 17 (Johns-Krull et al. 2009) and 1.36 ± 0.06 kG for V347 Aur (Flores et al. 2019) can be inferred. Unfortunately, the total field strength combines the small- and large-scale features of the magnetic field, and a distinction is only possible with additional (more precise) measurement (e.g., Zeeman-Doppler imaging, ZDI, Johnstone et al. 2014). Such observations are currently not available for embedded Class I (0) objects. In addition, the small number of available measurements does not have to be representative. There are, however, estimates on the magnetic field strength of Class I (0) objects ranging from ∼0.1 kG to ∼1 kG based on flux conservation during the core collapse (Tsukamoto et al. 2022), near-infrared K-band spectra (Laos et al. 2021), and laboratory plasma experiments (Burdonov et al. 2021). These estimates match the inferred field strengths for WL 17 and V347 Aur. Furthermore, Laos et al. (2021) argue that Class I (0) objects should have similar accretion mechanisms and magnetic field strengths to Class II objects. For these objects, which are slightly further evolved, the large-scale field component ranges from ∼0.1 kG to ≳1 kG (e.g., Johnstone et al. 2014). Thus, we chose a range for the large-scale magnetic field strength, B⋆, in the range from 0.1 kG to 2.0 kG. These values are kept constant throughout the simulations in Sect. 3. In addition, we explore the possibility of mass-dependent magnetic field strengths, as presented in Browning et al. (2016, see Sect. 4.5).
Initial rotation rates. While there are rotational studies of young (∼1 Myr) T Tauri stars in NGC 2264 (Venuti et al. 2017), ONC (Rebull et al. 2006), σ Ori (Cody & Hillenbrand 2010), and Taurus (Rebull et al. 2020), there are no large-scale surveys of stellar rotation periods of Class I (0) objects. Similar to magnetic fields, there are only singular estimates for individual stars. The Class I object Elias 29 has a rotation period of ∼2 days (Pillitteri et al. 2019). Furthermore, White et al. (2007) suggest that Class I objects rotate slightly faster than their Class II counterparts. This would result in rotation periods of ∼1 day during the Class I phase. The initial rotation periods at the beginning of the Class I (0) phase, however, are not well constrained. Thus, we explore a wide range of initial rotation rates from very slow-rotating stars with Ωinit = 0.01Ωcrit to fast-rotating stars with Ωinit = 0.9Ωcrit, with Ωcrit being the critical or break-up rotation rate, which is usually estimated as (e.g., Maeder 2009)
 (12)
(12)
Initial stellar radius. Studies of early stellar evolutionary stages that start shortly after the second collapse and the formation of the second hydrostatic core (with an initial stellar mass of 0.01 M⊙) assume stellar radii of 0.25 R⊙ to 3.0 R⊙ (e.g., Hosokawa et al. 2011; Kunitomo et al. 2017; Steindl et al. 2021). According to Kunitomo et al. (2017), initial stellar radii of ≳1.5 R⊙ are required to explain the most luminous stars and small initial radii can explain the low luminosities, and the observed luminosity spread in young clusters (Hillenbrand 2009; Soderblom et al. 2014). Although we start with slightly further evolved initial stellar models (with an initial mass of 0.05 M⊙), we assume similar initial stellar radii ranging from 0.6 R⊙ to 2.5 R⊙.
Accretion powered stellar wind efficiency. In this study winds originating from the star are represented by accretion-powered stellar winds (APSWs). Such winds extract a certain amount of angular momentum from the star and cause a spin-down (see Eq. (10)). The exact driving mechanisms of these winds are still under debate (see, e.g., the discussion in Gallet 2019). We adapt the driving mechanisms proposed by Decampli (1981) and Matt & Pudritz (2005a). Angular momentum can be removed from the star by Alfvén waves, excited by the accreting material at the stellar surface and traveling outward. The mass-loss rates of such winds are assumed to be on the order of one percent of the accretion rate onto the star (W ∼ 1%; e.g., Cranmer 2008; Pantolmos et al. 2020). Thus, the APSW efficiency value W ranges from 0% to 5% in this study. We note that there are also other wind-driving mechanisms affecting the star-disk system (e.g., jets launched at the inner disk). We discuss the possible impact of such winds or jets on the rotational evolution of the young star in Sect. 3.4.
2.6. Reference model
We define a reference model, to qualitatively show how each parameter affects the rotational evolution of young stars. In the following sections, the reference values are marked in boldface. The reference parameters are summarized in Table 1.
Reference model parameters used in this study.
3. Results
3.1. Evolution of the reference value
Before going into detail on the individual parameters, we want to show the evolution of the reference model (see Fig. 2). The choice of initial conditions leads to an initial rotation period of six days. During the first few thousand years, the star spins up to ≈4 days. This initial spin-up can be explained by adjusting the rotation period to the accretion rate when starting the simulation. Starting from the initial stellar radius of Rinit = 1.1 R⊙, the star inflates due to the energy of the accreting material added into the stellar interior and the onset of deuterium burning. Up to an age of ≈18 kyr, the inflation of the star (combined with the APSW) can counteract the spin-up influence of accretion and the star-disk interaction, and the star spins down toward 6 days (Γtot < 0, in panel c in Fig. 2). With increasing stellar radius, the spin-up influence of the MEs increases as well, and the stellar period decreases toward four days up to an age of 80 kyr. At ∼80 kyr, the stellar inflation increases for a short period of time, resulting in a brief spin-down. Afterward, the star contracts for the remaining simulation, reaching a final stellar radius of 1.84 R⊙ after 1 Myr. During contraction, Γint increases the stellar spin-up and the star reaches a period of 1.6 days after 1 Myr.
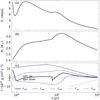 |
Fig. 2. Evolution of the reference model. The stellar rotation period and radius are shown in panels a and b, respectively. The different torque contributions are shown in panel c. The accretion torque Γacc, the influence of the magnetic star-disk interaction ΓME, the APSW torque ΓW, and the internal contributions due to variation of the stellar moment of inertia Γint are shown as a solid blue line, dashed blue line, dotted blue line, and dash-dotted blue line, respectively. The total torque Γtot, defined as the sum of the other torque contributions, is shown as a solid black line. A gray dashed line marks the change between the spin-up and spin-down regimes. |
3.2. Effects of individual parameters
Now we examine how the stellar rotational evolution is affected by the initial rotation rate Ωinit, the stellar magnetic field strength B⋆, the APSW efficiency W, the initial stellar radius Rinit, the final stellar mass at 1 Myr M⋆, and the amount of energy of the infalling material added into the star, βup (see Fig. 3). For a clear description of the different effects, we show, in addition to the stellar rotation period, the evolution of the stellar radius in Fig. 4, the individual torque contributions in Appendix C, and the HRD for each model in Fig. E.1.
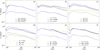 |
Fig. 3. Evolution of the stellar rotation period P⋆ for each parameter variation: initial rotation rate Ωinit (panel a), stellar magnetic field strength B⋆ (panel b), APSW efficiency W (panel c), amount of energy of the infalling material added into the star βup (panel d), the final stellar mass at 1 Myr M⋆ (panel e), and the initial stellar radius Rinit (panel f). The reference values are in boldface. For comparison, the critical rotation period is shown for each evolution as dotted lines. |
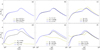 |
Fig. 4. Evolution of the stellar radius R⋆ for each parameter variation (as in Fig. 3). The reference values are marked in boldface. |
The initial rotation rate. First, we want to show the effects of different initial rotation rates, Ωinit (panel a in Figs. 3 and 4). We vary Ωinit from 1% to 90% of the critical (or break-up) velocity. The black, blue, and yellow lines symbolize the reference, fast, and slow rotating models. Within the first ∼5 kyr, the initial difference in the stellar periods of ≈59 days converges toward a common value (see Sect. 2.3). As a consequence of the fast initial rotation and strong centrifugal forces, the initial stellar radius for a star with Ωinit = 0.9 Ωcrit is slightly larger compared to the other models. However, this difference disappears after a few thousand years and the stellar evolution toward 1 Myr is completely unaffected by the initial rotation rate Ωinit.
Stellar magnetic field strength. The stellar magnetic field strength affects all external torque contributions, such as Γacc, ΓME, and ΓW. The torque due to MEs, however, is affected most strongly (see Eq. (9) in Sect. 2.2). As shown in panel b in Fig. 3, a strong magnetic field causes the star to spin up during the first ∼100 kyr. After ∼100 kyr, a strong magnetic field causes a spin-down. The strong and weak magnetic field strengths are shown as the blue and yellow lines, respectively. This behavior can be explained with Eq. (9). During the initial ∼100 kyr the star is still heavily embedded and the accretion rates can be assumed to be high (see Fig. 1). The truncation radius Rt is pushed inward toward the star (regardless of the magnetic field strengths used in this study), and the ratio of Rt to the co-rotation radius Rco is low. Thus, the torque due to the magnetic star-disk interaction ΓME is positive, and a stronger magnetic field strength results in a stronger spin-up torque. After ∼100 kyr, the accretion rate decreases, and a stronger magnetic field pushes the truncation radius outward closer to the co-rotation radius. The disk’s rotation at the truncation radius Ω(Rt) and the difference between Ω(Rt) and Ω⋆ decreases. Consequently, stronger magnetic fields result in a weaker accretion spin-up torque (see Eq. (5)), a weaker torque due to the magnetic star-disk interaction, ΓME (see Eq. (9)), and a slower rotation period compared to weak magnetic field strengths. The differences in the rotation periods are relatively small (∼1 day) and the stellar radius evolution is almost unaffected (see panel b in Fig. 4).
APSW efficiency W. In the current spin evolution model, a stellar wind removes angular momentum from the star and causes a spin-down. The amount of AM that is removed scales with the mass loss, which is proportional to the APSW efficiency W (see Eq. (10)). Thus, a higher efficiency value results in a stronger spin-down torque, and the star slows down compared to a weaker APSW or none at all (see panel d in Fig. 3). The difference, especially during the early evolution (≲105 years) can be significant. With no angular momentum removed by an APSW (W = 0%), the star spins up to 81.7% of the critical rotation rate (see the dotted lines in Fig. 3). The stellar rotation period differs by more than seven days, equivalent to a factor of ≈4. The stellar radius is also affected by the different rotation periods. A fast-rotating star shows a larger radius (panel c in Fig. 4) and a lower effective temperature (see panel c in Fig. E.1). Thus, the first nuclear reactions ignite at a later age (see the shifted radius evolution in panel c in Fig. 4), while toward an age of 1 Myr the rotation periods still show a difference of a factor of ∼2, the stellar radii converge to a similar value.
Maximum amount of additional heat Ėadd. The amount of additional heat can be controlled by the free parameter βup4. The value of βup has a significant impact on stellar evolution. While the evolution of most stars can be explained by a substantial amount of additional heat added to the star (corresponding to βup ≳ 0.1; e.g., Vorobyov & Pavlyuchenkov 2017; Kunitomo et al. 2017; Steindl et al. 2021), objects with very low luminosity require β ∼ βlow (Kunitomo et al. 2017; Vorobyov et al. 2017a). The amount of additional heat affects the evolution of the stellar radius. The more energy added to the stellar interior, the more quickly the star inflates (see panel d in Fig. 4). In the cold accretion scenario (β = βlow), the stellar radius does not inflate and remains approximately constant at a value of ∼1 R⊙. These different evolution tracks influence stellar rotation (see panel d in Fig. 3). The strong initial inflation to R⋆ > 3 R⊙ for βup = 0.5 results in a spin-down to 9.2 days. With larger radii, MEs become more effective and the star starts to spin up slowly. After 1 Myr, the stellar period has reached ∼2 days. Without the initial inflation, the star continuously spins up during its evolution (excluding the short period of inflation due to the first nuclear reactions). After 1 Myr, the stellar period has reached ∼0.57 days. Within the parameter ranges studied so far, a variation in βup has the largest impact on the stellar rotation period.
Stellar mass at 1 Myr. To reach different stellar masses at 1 Myr, we vary the age at which the initially constant accretion rate decreases (see Fig. 1). During the first ∼105 years, lower final stellar masses result in faster-rotating stars (see panel e in Fig. 3). To explain this behavior, the amount of additional heat has to be considered. For a decreasing accretion rate, βup decreases, and consequently Ėadd decreases as well. Thus, the stellar inflation stops and the star starts contracting, resulting in stellar spin-up. After 105 years, the influence of the additional heat diminishes as accretion rates decrease further. A lower accretion rate results in less accretion torque Γacc, and a smaller stellar radius results in less effective MEs. As a consequence, lower accretion rates cause slower rotation compared to higher accretion rates.
Initial stellar radii. Finally, we show the impact of different initial stellar radii on the spin evolution. For a given stellar mass, a larger radius results in a cooler temperature throughout the star. Starting at a large initial stellar radius, gravity prevails over the inflation due to the additional heat, and the star contracts slightly (see panel f in Fig. 4). After ∼20 kyr, the inflation of the stellar radius has balanced the initial differences. The temperature deep in the stellar interior, however, is still cooler in the case of an initially larger radius and the first nuclear reactions start slightly later (maximum radii are reached later). Reaching 1 Myr, the stellar radii converge toward a common value and the initial differences are erased. A similar picture emerges for the stellar rotation periods. Initial differences converge quickly and throughout the evolution; small differences only arise due to different stellar radii. After 1 Myr the rotation period evolved independently of the initial stellar radius. In our reference case we chose βup = 0.2, which corresponds to a warm accretion scenario. Kunitomo et al. (2017), however, points out that the importance of the initial stellar radius increases when the amount of additional heat decreases. Hence, additional simulations have been carried out with different initial radii and βup = 0.005 (see Appendix D). Without the additional heat and the resulting stellar inflation, the stellar radii maintain a significant difference throughout their evolution and after 1 Myr, the stellar radii differ by a factor of ∼2 (see panel b in Fig. D.1). As a result, the stellar rotation period does not converge and shows a dependence on the initial stellar radius. Smaller stellar radii result in faster-rotating stars and after 1 Myr, the rotation periods differ by a factor of 2.6 (see panel a in Fig. D.1).
3.3. Other factors affecting Ėadd
The additional heat Ėadd is not only controlled by β. The region in which Ėadd is added and the accretion history can influence the stellar evolution. We reduce the region in which the additional heat Ėadd is distributed to Madd = 0.01. With more additional heat injected close to the stellar surface, the initial stellar inflation increases (see the sharp increase in stellar radius in Col. a in Fig. 5). During the whole evolution the stellar radius remains slightly larger compared to the reference model. Reaching 1 Myr, the stellar radius converges toward the reference value as the influence of Ėadd becomes less important as the accretion rate decreases. As discussed before, larger inflated stars tend to rotate more slowly. During the strong initial inflation, the difference to the reference model is the largest (∼3 days). Similarly to the stellar radius, when it reaches an age of 1 Myr the stellar period converges toward the reference value.
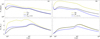 |
Fig. 5. Evolution of the stellar rotation period P⋆ and the stellar radius R⋆ for different variations from the reference model. Column a: region in which Ėadd is distributed, Madd = 0.01 (blue line), and using a different accretion history Ṁhigh (see Fig. 1, yellow line). Column b: low metallicity, Z⋆ = 0.1 Z⊙ (blue line), and including the influence of disk winds (model DW, yellow line). The reference model is marked in boldface. |
Next, we change the accretion history. Starting from an initial accretion rate of 2 × 10⁵ M⊙ yr−1, which is larger than the reference value by a factor of 4, the accretion rate drops earlier and faster to reach the same stellar mass (0.7 M⊙) compared to the reference model (see Fig. 1). The strong accretion rate injects a large amount of additional heat into the stellar interior and the star inflates rapidly to > 4 R⊙ (see Col. a in Fig. 5). Due to this immense expansion, the star slows down to over ten days. After the accretion rate drops, the stellar expansion stops and the star contracts toward the reference value, reaching the end of the simulation. In contrast to the previous model with Madd = 0.01, the lower accretion rate at ages > 105 years reduces the accretion torque and the torque due to MEs and the star spins down. At the age of 1 Myr, the stellar rotation period differs by a factor of 1.9.
While the region in which the additional heat is injected plays only a minor role in the stellar spin evolution, the accretion history significantly affects the stellar period. In our model the accretion rate is assumed to be smooth, without short-term variations. This idealistic assumption, however, should merely be considered as an average over time. In hydrodynamic disk simulations, the embedded phase (< 105 years) in partiular show episodic outbursts with peak accretion rates of > 105 M⊙ yr−1 (e.g., Vorobyov & Basu 2015; Vorobyov et al. 2017b; Hsieh et al. 2019; Kadam et al. 2021). During such an outburst, a huge amount of additional heat is injected into the stellar interior, the star inflates, and the rotation period increases. The nature of these outbursts depends, among other things, on the stellar mass. More massive stars undergo more and stronger outbursts over a greater period of their early life. If each outburst spins down the star slightly, more massive stars should tend to rotate more slowly compared to low-mass stars. This trend is, in fact, reported in Henderson & Stassun (2012) for young (≲5 Myr) clusters.
3.4. Disk winds
In the presence of a large-scale magnetic field in the accretion disk, disk winds, launched by magnetorotational processes in the inner disk regions, can remove a significant amount of angular momentum from the disk (e.g., Zhang et al. 2017). The exact regions in which the wind is launched and the total amount of mass and angular momentum transported away depend on a variety of factors (e.g., Guilet & Ogilvie 2014; Steiner et al., in prep.). A detailed description of this process would go beyond the scope of this work. However, we can approximate the effect of a strong disk wind on the stellar rotation. The loss of angular momentum in the inner disk region causes the disk material to slow down and reduces the accretion torque. For our simulation, we extend Eq. (7) by a factor of KDW = 0.5. We note that this factor is most likely not constant and depends on different parameters, but for showing the qualitative effect of a disk wind, this assumption should be viable. The rotational evolution including a disk wind is shown in Col. b in Fig. 5 (yellow line). As expected, the reduced accretion torque leads to a rapid spin-down during the radius inflation. Reaching 1 Myr, the rotational period is still slower by a factor of 2.0 compared to the reference model, which is similar to the effect of the model with Ṁhigh.
3.5. Stellar metallicity
Finally, stellar metallicity can affect the rotational evolution of the star during the pre-main sequence and the main sequence. Low-metallicity stars are expected to rotate more quickly than to their solar-metallicity counterparts (e.g., Amard et al. 2019, 2020; Amard & Matt 2020; Gehrig et al. 2023). As low-metallicity stars are more compact compared to those of solar metallicities, mechanisms that remove angular momentum from the star and scale with the stellar radius are less effective in a low-metallicity environment during the Class II phase and beyond the main sequence (e.g., Amard & Matt 2020; Gehrig et al. 2023). In addition, the disk lifetime of low-metallicity stars is shorter compared to those of solar metallicities, and the pre-main sequence spin-up due to contraction starts at an earlier age (Yasui et al. 2016, 2021; Guarcello et al. 2021; Gehrig et al. 2023). We find similar results for the evolution during the first million years for a metallicity of Z⋆ = 0.1 Z⊙ (see Col. b in Fig. 5, blue line). The initial inflation is weaker and the star is more compact during the whole simulation time compared to the reference model. Thus, the star spins up during the embedded phase. Reaching the age of 1 Myr, the APSW is less effective in removing angular momentum from the star due to the smaller stellar radius and the star continues to spin up compared to the reference model.
3.6. Summarizing the effects on P⋆
In this work we study the influence of various stellar and disk parameters on the stellar spin evolution during the first million years of stellar evolution. We summarize our results in an illustrative way in Table 2. We divide the stellar evolution into two phases: the embedded phase (≲105 years) and the later phase (≳105 years), which corresponds to the Class II or T Tauri phase. For each parameter variation, we indicate if the star rotates faster (red) or slower (blue), or is approximately unchanged (gray) compared to the reference model.
Summary of the influence of different stellar and disk parameters on the stellar spin evolution.
4. Discussion
4.1. Applicability of the spin model for embedded stars
In this study we use the stellar spin evolution model presented in Ireland et al. (2021), which depends strongly on best-fit parameters and proportionality constants (see Eqs. (5)–(11)). These parameters are based on models with lower accretion rates Ṁacc ≲ 10−8 M⊙ yr−1. Such accretion rates are typically found in older, further evolved systems with ages of ∼1 Myr, which marks the end of our simulations. In their work Ireland et al. (2021) recommend the use of their formulation for R⋆ ≤ Rt ≤ Rco, which is the case for all our models. However, the high accretion rates can result in effects not considered by Ireland et al. (2021).
Disk truncation radius. The disk truncation radius Rt depends on the balance between stellar magnetic pressure and ram pressure of the infalling material (e.g., Hartmann et al. 2016). For accretion rates of Ṁacc ≲ 10−8 M⊙ yr−1, the truncation radius is usually located at several stellar radii and the dipolar magnetic field component dominates the magnetic field strength at this position (e.g., Finley & Matt 2018; Ireland et al. 2021). During phases of higher accretion rates, however, the truncation radius is pushed toward the star and can reach Rt = R⋆. Close to the stellar surface, the importance of high-order magnetic field components increases. Quadro- or octopole components can have field strengths of several kilogauss (e.g., Kochukhov et al. 2020), which could also affect the position of the truncation radius close to the star. On the other hand, trends in the evolution of the stellar magnetic field suggest that young, fully convective stars have axisymmetric fields dominated by a dipole component (e.g., Folsom et al. 2016). Thus, we assume that the calculation of the truncation radius as presented in Ireland et al. (2021) provides a good approximation for young, fully convective stars.
Accretion torque. The accretion torque Γacc depends on the “Keplerianity” of the disk material at the truncation radius. Angular momentum removed by MEs or stellar magnetic torques results in sub-Keplerian rotation of the disk material (e.g., Bessolaz et al. 2008; Matt et al. 2012; Ireland et al. 2021). In the current formulation, these effects depend on the proportionality constant Kacc = 0.775 and the position of the truncation radius (see Eq. (7)). While the formulation should provide reasonable estimates for the accretion torque for Rt > R⋆, Γacc could be underestimated if the truncation radius were located inside the stellar radius, due to strong accretion rates or, for example, weak magnetic field strengths. In such cases, we set Rt = R⋆. As a result, the ram pressure of the accreting material exceeds the stellar magnetic pressure, and the accreting material could be close to Keplerian rotation.
Magnetospheric ejections. The torque due to magnetospheric ejections ΓME depends, similarly to the truncation radius, on the stellar magnetic field strength and the location of the truncation radius (see Eq. (9)). For truncation radii close to the stellar surface, small-scale magnetic field components could affect the magnitude of ΓME. Assuming primarily axisymmetric fields dominated by a dipole component (e.g., Folsom et al. 2016), the current formulation should provide reasonable estimates for ΓME.
APSW torque. In the current model, accretion-powered stellar winds (APSW) remove angular momentum from the star (see Eq. (11) and, e.g., Matt & Pudritz 2005a; Gallet 2019; Ireland et al. 2021). These studies, however, do not consider the very early embedded stages in their formulations. It is unclear how winds emerging from the stellar surface interact with an envelope falling onto the disk and how much angular momentum can be transported away from the star under these circumstances. In the case that the envelope around the young star has little or no influence on the APSW, the current formulation with efficiency rates of W ∼ 2% provides a realistic estimate for the torque due to APSW. If, on the other hand, the infalling envelope interferes with the APSW, the efficiency rate could be reduced significantly, which is demonstrated in this study by W = 0%.
In summary, the model presented in Ireland et al. (2021) should provide reasonable estimates for the torques acting on the young protostar during the embedded phase with high accretion rates. The individual relations between stellar and disk parameters are assumed to be valid. We note, however, that the proportionality constants used in Eqs. (5)–(11) could change when repeating the calculations presented in Ireland et al. (2021) with higher accretion rates.
4.2. Magnitude and distribution of βup
The evolution of young stars strongly depends on the amount of additional heat Ėadd added into the stellar interior (e.g., Baraffe et al. 2012; Vorobyov et al. 2017a,b; Kunitomo et al. 2017). Usually, Ėadd is assumed to be a certain fraction β of the energy of the accreted material. In the hybrid accretion scenario (e.g., Vorobyov et al. 2017b) β depends on the accretion rate on the star, ranging from low values βlow, during phases of low accretion rates, to high values βup, during phases of high accretion rates (e.g., Jensen & Haugbølle 2018; Elbakyan et al. 2019; Steindl et al. 2021). According to Kunitomo et al. (2017), relatively high values of β ≳ 0.1 are necessary to explain the evolution of a majority of stars in young clusters5. Low values of β (e.g., β = βlow), on the other hand, result in stellar luminosities of ≲0.1 L⊙ and can explain very low-luminosity objects (VeLLOs, e.g., Vorobyov et al. 2017a). To explain the luminosity spread in a young cluster, a distribution of βup has to be assumed. The exact processes that constrain the magnitude of βup are still unknown and more detailed modeling of the accretion process and the distribution of the additional heat is required to formulate reasonable limits. Our results show that the amount of additional heat affects the stellar spin evolution significantly. Low values of βup result in very fast rotating stars (see panel d in Fig. 3). It would be interesting to test if low-luminosity stars tend to rotate faster compared to objects with higher luminosities. Unfortunately, the available observational data do not allow any conclusions to be drawn.
4.3. External influences
The previous results are valid for a single star without any external or environmental influences. Recently, Roquette et al. (2021) studied the influence of external photoevaporation caused by massive stars in young regions. The presence of a high-mass star can remove mass from the disk due to high-energy radiation and reduce the disk’s lifetime. The timescale on which the star and the disk can exchange angular momentum is reduced, and the stars start to spin up due to contraction at an early age. Thus, such stars show faster rotation periods after several million years. During the initial stellar evolution, however, Roquette et al. (2021) assume disk-locking, meaning that the stellar rotation period is kept constant as long as the accretion disk is present. The effect of external photoevaporation on the stellar spin evolution during the first million years can be summarized as follows: During the embedded phase the disk material is effectively shielded by the envelope and external photoevaporation is assumed to have little effect on the disk evolution (e.g., Winter et al. 2020). Without the envelope, on the other hand, the high-energy radiation removes material from the disk, and the disk accretion rate decreases for ≳105 years. As shown in the previous models with reduced accretion rates at ≳105 years (e.g., model Ṁhigh; see Sect. 4.2), the star spins down. While assuming disk-locking, this effect is not seen in Roquette et al. (2021). To model the extent of the spin-down due to lower accretion rates and the spin-up due to shorter disk lifetimes in a high-energy radiation environment, a combination of our early spin evolution model and a hydrodynamic disk model including the effects of external photoevaporation will provide valuable insights into the early spin evolution.
Another environmental factor is the tidal interaction between different stars in close encounters, binaries, or multiple systems. Tidal interactions in close encounters can remove disk material and reduce the disk accretion rate and lifetime (e.g., Winter et al. 2018). In contrast to external photoevaporation, these close encounters can act on the star-disk system during all phases of its evolution. The amount of mass removed depends on the mass of the intruding object (e.g., Vorobyov et al. 2020) and the number of encounters (e.g., Winter et al. 2018). After the embedded phase, a reduced accretion rate results in a stellar spin-down (similar to the effect of external photoevaporation). During the embedded phase, a reduced accretion rate reduces Ėadd and the stellar inflation. As a consequence, the star rotates faster (see our model with M⋆ = 0.3 M⊙, panel e in Fig. 3). On the other hand, close encounters can ignite outburst events (e.g., Vorobyov et al. 2021) that result in a stellar spin-down. Which of the two mechanisms predominates is unclear and requires a combined model.
Binaries or multiple stellar companions can have different effects on the disk’s lifetime, and thus on the stellar spin evolution. Accretion disks truncated by a wide binary companion are assumed to have shorter lifetimes as mass is removed from the accretion disk (e.g., Kraus et al. 2011). As a consequence, the star spins up during the embedded phase and spins down afterward compared to a single star. On the other hand, circumbinary disks have longer lifetimes compared to single stars (e.g., Alexander 2012). In multiple stellar systems certain configurations can also result in long disk lifetimes (e.g., Ronco et al. 2021).
4.4. Rotational distributions in young clusters
Our results show the impact of different parameters on stellar spin evolution. Here we present an overview of the observed rotational distributions of young clusters, and estimate how quickly (or slowly) a ∼1 Myr old star probably spins. In the next step we infer the parameters necessary to reproduce the observed distribution and discuss the physical consequences of these choices (see Sect. 4.5). We selected the rotational period distribution of six young (≲3 Myr) clusters: NGC 6530 (Henderson & Stassun 2012), Orion SFR (Serna et al. 2021), Taurus (Rebull et al. 2020), NGC 2264 (Venuti et al. 2017), σ Ori (Cody & Hillenbrand 2010), and ONC (Rebull et al. 2006). In Fig. 6 we show the 5th (left-facing triangle), 50th (diamond), and 95th (right-facing triangle) percentiles for each cluster. For all six clusters, the 95th percentiles indicating the slow-rotating stars are located at ≳10 days with a mean value of 13.0 days (vertical dashed line). The fast-rotating boundary is at ≲1 day with the exception of Taurus, which contains faster-rotating stars with the 5th percentile at 0.15 days. The mean value of the 5th percentile is 0.76 days (vertical dotted line). One explanation for the rapidly rotating stars in Taurus could be its age and the evolutionary stage of the star-disk systems. With an age of ∼3 Myr, the sample of Taurus consists of disk-bearing stars and stars without an accretion disk (Rebull et al. 2020). In addition, the ages of these young clusters are subjected to large scatters of up to ∼1 Myr (e.g., Testi et al. 2022). Some stars might be significantly older than the final age of our models (1 Myr). During this additional time the accretion disk could be dissolved due to accretion, winds, or photoevaporative effects, and the star starts to spin up due to contraction. This theory is supported by a comparison of stars with and without an accretion disk in Rebull et al. (2020). Stars that are still surrounded by an accretion disk tend to rotate slower than stars without a disk. The fastest disk-bearing stars have rotation periods slightly below 1 day, which matches the 5th percentiles of the other five clusters in our selection.
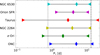 |
Fig. 6. Comparison between rotational distribution in young clusters and rotation period range at 1 Myr of our fast and slow-rotating models (blue area). The diamonds, left-pointing triangles, and right-pointing triangles are the 50th, 5th, and 95th percentile of the rotational distribution for the respective cluster. The mean values of the 95th (5th) percentiles are indicated by the vertical dashed (dotted) line. See text for references. |
4.5. Slow and fast rotating configurations
Based on the rotational distribution of young star-forming regions (see Sect. 4.4), 90% of the stars in young clusters show rotation periods between 0.76 days and 13.0 days. While the rotation periods of our models match the fast-rotating stars in observed clusters (especially in the case of β = 0.005 and W = 0%, see Fig. 3), observed slow-rotating stars have rotation periods that are higher compared to our model results by a factor of ≳4. We want to explore possible scenarios that can lead to these rotation periods.
A rising number of observed rotational distributions of young clusters allows us to derive empirical relations between the stellar rotation period and other parameters. For accreting T Tauri stars, a positive correlation between the rotation period and the stellar magnetic field strength has been reported (e.g., Vidotto et al. 2014). For Class II stars, a strong magnetic field result in a stellar spin-down. This relation agrees with our results (see Panel b in Fig. 3) and other studies (e.g., Matt et al. 2010; Ireland et al. 2021; Gehrig et al. 2022). Since the magnetic field strength alone does not cause spin-down in the star sufficient to match the observed slow-rotating stellar periods (see Fig. 3), the question arises of whether strong magnetic fields (in the star or the disk) might affect other parameters. Bu & Mosallanezhad (2018) report that disk winds in a strongly magnetized environment are more powerful compared to a weakly magnetized outflow. Similarly, Bai et al. (2016) explored the relation between angular momentum loss in protoplanetary disks due to the disk winds and the magnetic field strength. The higher the magnetic field strength, the more effective the wind in removing angular momentum from the disk and the higher the accretion rate induced by the wind. A stronger accretion rate increases the amount of additional heat Ėadd that is added to the star. In addition, a strong magnetic field affects the accretion-powered stellar wind. The Alfvén radius rA, which acts as the lever arm of the APSW, grows with increasing stellar magnetic field strength (e.g., Gallet 2019; Ireland et al. 2021). The effect of the magnetic field strength on the mass-loss rate of the APSW, however, is poorly constrained by both theory and observations. To summarize, a strong magnetic field strength in the star and the disk can result in an effective disk wind, APSW, and can increase the accretion rate onto the star. On the other hand, a weak magnetic field strength would be accompanied by weak winds (APSW and disk winds).
To test the effects of these configurations on the stellar spin evolution, two models called slow and fast are constructed. Model slow is characterized by a magnetic field strength of B⋆ = 2.0 kG, the inclusion of disk winds removing angular momentum from the inner disk (see Sect. 3.4), and Ṁhigh (see Sect. 3.3). All other values match the reference model. Model fast combines a weak magnetic field strength, B⋆ = 0.1 kG, with an ineffective wind (no disk winds and W = 0%). In Fig. 7 the evolution of the rotation periods for models slow (blue line) and fast (yellow line) are shown in comparison to the reference model (black line). The slow-rotating model spins down during the initial inflation to 22 days. After spinning up to ∼10 days during the embedded phase, the strong magnetic field strength spins down the star, reaching 1 Myr with a period of 12.9 days. The fast-rotating model spins up initially to a rotation period of 1.7 days due to the weak APSW wind. This period is kept roughly constant during the embedded phase. During the Class II phase, the weak magnetic field strength results in a further spin-up to a rotation period of 0.68 days at an age of 1 Myr. Thus, the effect of the magnetic fields in the young star-disk system on other parameters like the effectiveness of winds or the accretion rate can result in rotation periods that agree with the observed range in young clusters (blue shaded area in Fig. 7). We note that the influence of magnetic fields on the amount of additional energy controlled by β is unclear. Additionally, the magnetic field strength itself is a free parameter in our model. The generation of the magnetic field and its evolution is still unclear. One possible evolution scenario for the magnetic field strength is given by Browning et al. (2016). The magnetic energy is scaled with the convective energy in the stellar interior and a positive correlation between the stellar mass and the magnetic field strength is proposed. Further investigation is needed to constrain the evolution of the free parameters used in our model.
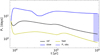 |
Fig. 7. Evolution of the stellar rotation period P⋆ for the slow (blue line), reference (black line), and fast rotating models (yellow line). For comparison, the range of the mean values of the 5th and 95th percentiles is highlighted as a blue area P⋆ obs (see Sect. 4.4). |
Another empirical relation connects the stellar rotation period and the stellar mass. In Herbst et al. (2007), a higher stellar mass is associated with longer rotation periods in ∼1 Myr old clusters. We note that in the context of this work a high-mass star corresponds to a solar-mass star. On the other hand, a weak and even negative correlation between the stellar rotation period and the stellar mass is reported in Henderson & Stassun (2012) for cluster ages of ∼1 Myr. Our results presented in Fig. 3 agree with the negative correlation between stellar period and mass. However, the disks surrounding high-mass stars, which are more massive compared to low-mass stars (e.g., Vorobyov 2011; Andrews et al. 2013), could launch stronger disk winds as these winds scale with the density in the disk (e.g., Bai et al. 2016). In addition, the stellar mass scales with the accretion rate (e.g., Testi et al. 2022; Somigliana et al. 2022) and a high-mass star could be injected with a larger amount of additional heat Ėadd. Thus, a combination of high stellar masses, strong accretion rates, and an effective disk wind can also result in a slow-rotating star. To test the relation between the stellar mass and the rotation period in more detail and constrain the mentioned parameters, a combined stellar and disk evolution model, including disk winds, and further observations are required.
5. Conclusion
In this work we presented the evolution of stellar rotation periods for young (≤1 Myr) low-mass (≤1 M⊙) stars. We started our simulation from a stellar seed (0.05 M⊙) and took into account protostellar accretion, stellar winds, the magnetic star-disk interaction, and the internal stellar evolution. Our model allows us to test the influence of a variety of parameters on the stellar rotation period. Based on our results, we can draw the following conclusions:
-
The stellar rotation period is significantly influenced by the amount of additional heat Ėadd (controlled by βup) that is injected into the stellar interior, the accretion history, and the presence of strong winds (APSW and disk winds). The magnetic field strength, which is dominant during later evolutionary stages, plays a noticeable but smaller role during the first million years.
-
Differences in the initial rotational periods of the stellar seed Ωinit are quickly forgotten (≲104 years) and do not impact the rotational distribution at later stellar ages. Similarly, the initial stellar radius Rinit (assuming βup ∼ 0.2) and the extent of the region in which the additional heat is distributed Madd do not affect the rotation period noticeably.
-
We explore the possibility of fast- and slow-rotating models. The magnetic field strength in the star-disk system can affect the amount of additional heat Ėadd, and the effectiveness of both stellar and disk winds. A strong magnetic field can lead to an enhanced accretion rate and effective winds (APSW and disk winds), resulting in slow-rotating stars. Weak magnetic fields or a small amount of additional heat (β = 0.005) lead to the fastest rotating stars. The stellar rotation periods in our models cover a range of 0.6 − 12.9 days.
-
Our models match the rotational distribution of six young (≲3 Myr) clusters. The rotation periods of up to 90% of all observed stars are located within our results.
Motivated by these intriguing results, our model (extended over the whole disk lifetime) can be used as an alternative to the widely used disk-locking model during the presence of an accretion disk. In combination with a hydrodynamic disk model, including effects such as external photoevaporation and episodic accretion outbursts, valuable insights into the origin of the rotational distribution of young clusters can be obtained.
They will be uploaded to Zenodo after acceptance.
Kunitomo et al. (2017) and Steindl et al. (2021) start with Minit = 0.01 M⊙. The combination of high accretion rates and fast stellar rotation leads to convergence issues with MESA for stellar masses < 0.05 M⊙.
The formulation of Γacc in Ireland et al. (2021) does not include the −Ω⋆ term. They take into account stellar rotation rates much lower than the rotation rates at the inner disk boundaries. At young ages, however, high rotation rates close to break-up should be considered and the additional term should be included.
We expect that the stellar evolution is largely independent of βlow as long the value is chosen to be low enough: βlow ≪ 0.1.
For a higher deuterium abundance lower values of β suffice to explain the evolution of a majority of stars (Kunitomo et al. 2017). Since a variation in the deuterium abundance has similar effects on the stellar evolution compared to a variation in βup, we forego the simulation of specific models.
Acknowledgments
We thank the anonymous referee for the constructive feedback that helped to improve the manuscript. The authors gratefully acknowledge the work of Bill Paxton and his collaborators on the stellar evolution code MESA. Furthermore, the authors thank Thomas Steindl and Konstanze Zwintz for providing valuable insights into “handling” MESA and its parameter files. E.I.V. acknowledges support by the Ministry of Science and Higher Education of the Russian Federation (State assignment in the field of scientific activity 2023, GZ0110/23-10-IF). The simulations were performed on the VSC Vienna Scientific Cluster.
References
- Affer, L., Micela, G., Favata, F., Flaccomio, E., & Bouvier, J. 2013, MNRAS, 430, 1433 [Google Scholar]
- Alexander, R. 2012, ApJ, 757, L29 [Google Scholar]
- Allard, F., Hauschildt, P. H., Alexander, D. R., Tamanai, A., & Schweitzer, A. 2001, ApJ, 556, 357 [Google Scholar]
- Amard, L., & Matt, S. P. 2020, ApJ, 889, 108 [Google Scholar]
- Amard, L., Palacios, A., Charbonnel, C., et al. 2019, A&A, 631, A77 [NASA ADS] [CrossRef] [EDP Sciences] [Google Scholar]
- Amard, L., Roquette, J., & Matt, S. P. 2020, MNRAS, 499, 3481 [NASA ADS] [CrossRef] [Google Scholar]
- Andrews, S. M., Rosenfeld, K. A., Kraus, A. L., & Wilner, D. J. 2013, ApJ, 771, 129 [Google Scholar]
- Angulo, C., Arnould, M., Rayet, M., et al. 1999, Nucl. Phys. A, 656, 3 [Google Scholar]
- Armitage, P. J., & Clarke, C. J. 1996, MNRAS, 280, 458 [NASA ADS] [Google Scholar]
- Bai, X.-N., Ye, J., Goodman, J., & Yuan, F. 2016, ApJ, 818, 152 [Google Scholar]
- Baraffe, I., Chabrier, G., & Gallardo, J. 2009, ApJ, 702, L27 [NASA ADS] [CrossRef] [Google Scholar]
- Baraffe, I., Vorobyov, E., & Chabrier, G. 2012, ApJ, 756, 118 [NASA ADS] [CrossRef] [Google Scholar]
- Barnes, S. A. 2007, ApJ, 669, 1167 [Google Scholar]
- Bessolaz, N., Zanni, C., Ferreira, J., Keppens, R., & Bouvier, J. 2008, A&A, 478, 155 [NASA ADS] [CrossRef] [EDP Sciences] [Google Scholar]
- Bouvier, J., Matt, S. P., Mohanty, S., et al. 2014, in Protostars and Planets VI, eds. H. Beuther, R. S. Klessen, C. P. Dullemond, & T. Henning, 433 [Google Scholar]
- Browning, M. K., Weber, M. A., Chabrier, G., & Massey, A. P. 2016, ApJ, 818, 189 [NASA ADS] [CrossRef] [Google Scholar]
- Bu, D.-F., & Mosallanezhad, A. 2018, A&A, 615, A35 [NASA ADS] [CrossRef] [EDP Sciences] [Google Scholar]
- Buchler, J. R., & Yueh, W. R. 1976, ApJ, 210, 440 [NASA ADS] [CrossRef] [Google Scholar]
- Burdonov, K., Bonito, R., Giannini, T., et al. 2021, A&A, 648, A81 [NASA ADS] [CrossRef] [EDP Sciences] [Google Scholar]
- Cassisi, S., Potekhin, A. Y., Pietrinferni, A., Catelan, M., & Salaris, M. 2007, ApJ, 661, 1094 [NASA ADS] [CrossRef] [Google Scholar]
- Castelli, F., & Kurucz, R. L. 2003, in Modelling of Stellar Atmospheres, eds. N. Piskunov, W. W. Weiss, & D. F. Gray, 210, A20 [Google Scholar]
- Chugunov, A. I., Dewitt, H. E., & Yakovlev, D. G. 2007, Phys. Rev. D, 76, 025028 [NASA ADS] [CrossRef] [Google Scholar]
- Cody, A. M., & Hillenbrand, L. A. 2010, ApJS, 191, 389 [NASA ADS] [CrossRef] [Google Scholar]
- Cranmer, S. R. 2008, ApJ, 689, 316 [NASA ADS] [CrossRef] [Google Scholar]
- Cyburt, R. H., Amthor, A. M., Ferguson, R., et al. 2010, ApJS, 189, 240 [NASA ADS] [CrossRef] [Google Scholar]
- Decampli, W. M. 1981, ApJ, 244, 124 [NASA ADS] [CrossRef] [Google Scholar]
- Elbakyan, V. G., Vorobyov, E. I., Rab, C., et al. 2019, MNRAS, 484, 146 [NASA ADS] [CrossRef] [Google Scholar]
- Ferguson, J. W., Alexander, D. R., Allard, F., et al. 2005, ApJ, 623, 585 [Google Scholar]
- Finley, A. J., & Matt, S. P. 2018, ApJ, 854, 78 [Google Scholar]
- Flores, C., Connelley, M. S., Reipurth, B., & Boogert, A. 2019, ApJ, 882, 75 [NASA ADS] [CrossRef] [Google Scholar]
- Folsom, C. P., Petit, P., Bouvier, J., et al. 2016, MNRAS, 457, 580 [Google Scholar]
- France, K., Arulanantham, N., Fossati, L., et al. 2018, ApJS, 239, 16 [Google Scholar]
- Fuller, G. M., Fowler, W. A., & Newman, M. J. 1985, ApJ, 293, 1 [NASA ADS] [CrossRef] [Google Scholar]
- Gallet, F., & Bouvier, J. 2013, A&A, 556, A36 [NASA ADS] [CrossRef] [EDP Sciences] [Google Scholar]
- Gallet, Zanni C., & Amard, L., 2019, A&A, 632, A6 [NASA ADS] [CrossRef] [EDP Sciences] [Google Scholar]
- Gehrig, L., Steiner, D., Vorobyov, E. I., & Güdel, M. 2022, A&A, 667, A46 [NASA ADS] [CrossRef] [EDP Sciences] [Google Scholar]
- Gehrig, L., Steindl, T., Vorobyov, E. I., Guadarrama, R., & Zwintz, K. 2023, A&A, 669, A84 [NASA ADS] [CrossRef] [EDP Sciences] [Google Scholar]
- Ghosh, P., & Lamb, F. K. 1979, ApJ, 234, 296 [Google Scholar]
- Guarcello, M. G., Biazzo, K., Drake, J. J., et al. 2021, A&A, 650, A157 [NASA ADS] [CrossRef] [EDP Sciences] [Google Scholar]
- Guilet, J., & Ogilvie, G. I. 2014, MNRAS, 441, 852 [NASA ADS] [CrossRef] [Google Scholar]
- Hartmann, L. 2009, Accretion Processes in Star Formation, 2nd edn. (New York: Dover Publication) [Google Scholar]
- Hartmann, L., Cassen, P., & Kenyon, S. J. 1997, ApJ, 475, 770 [NASA ADS] [CrossRef] [Google Scholar]
- Hartmann, L., Herczeg, G., & Calvet, N. 2016, ARA&A, 54, 135 [Google Scholar]
- Hauschildt, P. H., Allard, F., & Baron, E. 1999a, ApJ, 512, 377 [Google Scholar]
- Hauschildt, P. H., Allard, F., Ferguson, J., Baron, E., & Alexander, D. R. 1999b, ApJ, 525, 871 [Google Scholar]
- Henderson, C. B., & Stassun, K. G. 2012, ApJ, 747, 51 [Google Scholar]
- Herbst, W., Bailer-Jones, C. A. L., Mundt, R., Meisenheimer, K., & Wackermann, R. 2002, A&A, 396, 513 [EDP Sciences] [Google Scholar]
- Herbst, W., Eislöffel, J., Mundt, R., & Scholz, A. 2007, in Protostars and Planets V, eds. B. Reipurth, D. Jewitt, & K. Keil, 297 [Google Scholar]
- Hillenbrand, L. A. 2009, in The Ages of Stars, eds. E. E. Mamajek, D. R. Soderblom, & R. F. G. Wyse, 258, 81 [NASA ADS] [Google Scholar]
- Hosokawa, T., Offner, S. S. R., & Krumholz, M. R. 2011, ApJ, 738, 140 [NASA ADS] [CrossRef] [Google Scholar]
- Hsieh, T.-H., Murillo, N. M., Belloche, A., et al. 2019, ApJ, 884, 149 [Google Scholar]
- Iglesias, C. A., & Rogers, F. J. 1993, ApJ, 412, 752 [Google Scholar]
- Iglesias, C. A., & Rogers, F. J. 1996, ApJ, 464, 943 [NASA ADS] [CrossRef] [Google Scholar]
- Ireland, L. G., Zanni, C., Matt, S. P., & Pantolmos, G. 2021, ApJ, 906, 4 [Google Scholar]
- Irwin, J., & Bouvier, J. 2009, in The Ages of Stars, eds. E. E. Mamajek, D. R. Soderblom, & R. F. G. Wyse, 258, 363 [Google Scholar]
- Irwin, J., Hodgkin, S., Aigrain, S., et al. 2008, MNRAS, 384, 675 [CrossRef] [Google Scholar]
- Itoh, N., Hayashi, H., Nishikawa, A., & Kohyama, Y. 1996, ApJS, 102, 411 [NASA ADS] [CrossRef] [Google Scholar]
- Jensen, S. S., & Haugbølle, T. 2018, MNRAS, 474, 1176 [Google Scholar]
- Johns-Krull, C. M., Greene, T. P., Doppmann, G. W., & Covey, K. R. 2009, ApJ, 700, 1440 [Google Scholar]
- Johnstone, C. P., Jardine, M., Gregory, S. G., Donati, J. F., & Hussain, G. 2014, MNRAS, 437, 3202 [Google Scholar]
- Kadam, K., Vorobyov, E., & Ágnes, K. 2021, ApJ, 909, 31 [NASA ADS] [CrossRef] [Google Scholar]
- Kochukhov, O., Hackman, T., Lehtinen, J. J., & Wehrhahn, A. 2020, A&A, 635, A142 [NASA ADS] [CrossRef] [EDP Sciences] [Google Scholar]
- Koenigl, A. 1991, ApJ, 370, L39 [Google Scholar]
- Kraus, A. L., Ireland, M. J., Hillenbrand, L. A., & Martinache, F. 2011, ApJ, 745, 19 [Google Scholar]
- Kunitomo, M., Guillot, T., Takeuchi, T., & Ida, S. 2017, A&A, 599, A49 [NASA ADS] [CrossRef] [EDP Sciences] [Google Scholar]
- Langanke, K., & Martínez-Pinedo, G. 2000, Nucl. Phys. A, 673, 481 [NASA ADS] [CrossRef] [Google Scholar]
- Laos, S., Greene, T. P., Najita, J. R., & Stassun, K. G. 2021, ApJ, 921, 110 [NASA ADS] [CrossRef] [Google Scholar]
- Maeder, A. 2009, Physics, Formation and Evolution of Rotating Stars (Berlin Heidelberg: Springer) [Google Scholar]
- Matt, S., & Pudritz, R. E. 2005a, MNRAS, 356, 167 [NASA ADS] [CrossRef] [Google Scholar]
- Matt, S., & Pudritz, R. E. 2005b, ApJ, 632, L135 [Google Scholar]
- Matt, S. P., Pinzón, G., de la Reza, R., & Greene, T. P. 2010, ApJ, 714, 989 [NASA ADS] [CrossRef] [Google Scholar]
- Matt, S. P., Pinzón, G., Greene, T. P., & Pudritz, R. E. 2012, ApJ, 745, 101 [NASA ADS] [CrossRef] [Google Scholar]
- Micela, G., Sciortino, S., Serio, S., et al. 1985, ApJ, 292, 172 [CrossRef] [Google Scholar]
- Oda, T., Hino, M., Muto, K., Takahara, M., & Sato, K. 1994, At. Data Nucl. Data Tables, 56, 231 [NASA ADS] [CrossRef] [Google Scholar]
- Pallavicini, R., Golub, L., Rosner, R., et al. 1981, ApJ, 248, 279 [NASA ADS] [CrossRef] [Google Scholar]
- Pantolmos, G., Zanni, C., & Bouvier, J. 2020, A&A, 643, A129 [NASA ADS] [CrossRef] [EDP Sciences] [Google Scholar]
- Paxton, B., Bildsten, L., Dotter, A., et al. 2011, ApJS, 192, 3 [Google Scholar]
- Paxton, B., Cantiello, M., Arras, P., et al. 2013, ApJS, 208, 4 [Google Scholar]
- Paxton, B., Marchant, P., Schwab, J., et al. 2015, ApJS, 220, 15 [Google Scholar]
- Paxton, B., Schwab, J., Bauer, E. B., et al. 2018, ApJS, 234, 34 [NASA ADS] [CrossRef] [Google Scholar]
- Paxton, B., Smolec, R., Schwab, J., et al. 2019, ApJS, 243, 10 [Google Scholar]
- Pillitteri, I., Sciortino, S., Reale, F., et al. 2019, A&A, 623, A67 [NASA ADS] [CrossRef] [EDP Sciences] [Google Scholar]
- Pols, O. R., Tout, C. A., Eggleton, P. P., & Han, Z. 1995, MNRAS, 274, 964 [Google Scholar]
- Potekhin, A. Y., & Chabrier, G. 2010, Contrib. Plasma Phys., 50, 82 [NASA ADS] [CrossRef] [Google Scholar]
- Rebull, L. M., Cody, A. M., Covey, K. R., et al. 2014, AJ, 148, 92 [NASA ADS] [CrossRef] [Google Scholar]
- Rebull, L. M., Stauffer, J. R., Cody, A. M., et al. 2020, AJ, 159, 273 [Google Scholar]
- Rebull, L. M., Stauffer, J. R., Megeath, S. T., Hora, J. L., & Hartmann, L. 2006, ApJ, 646, 297 [NASA ADS] [CrossRef] [Google Scholar]
- Réville, V., Brun, A. S., Matt, S. P., Strugarek, A., & Pinto, R. F. 2015, ApJ, 798, 116 [Google Scholar]
- Rogers, F. J., & Nayfonov, A. 2002, ApJ, 576, 1064 [Google Scholar]
- Ronco, M. P., Guilera, O. M., Cuadra, J., et al. 2021, ApJ, 916, 113 [NASA ADS] [CrossRef] [Google Scholar]
- Roquette, J., Matt, S. P., Winter, A. J., Amard, L., & Stasevic, S. 2021, MNRAS, 508, 3710 [NASA ADS] [CrossRef] [Google Scholar]
- Saumon, D., Chabrier, G., & van Horn, H. M. 1995, ApJS, 99, 713 [NASA ADS] [CrossRef] [Google Scholar]
- Serna, J., Hernandez, J., Kounkel, M., et al. 2021, ApJ, 923, 177 [NASA ADS] [CrossRef] [Google Scholar]
- Soderblom, D. R., Hillenbrand, L. A., Jeffries, R. D., Mamajek, E. E., & Naylor, T. 2014, in Protostars and Planets VI, eds. H. Beuther, R. S. Klessen, C. P. Dullemond, & T. Henning, 219 [Google Scholar]
- Somigliana, A., Toci, C., Rosotti, G., et al. 2022, MNRAS, 514, 5927 [NASA ADS] [CrossRef] [Google Scholar]
- Steindl, T., Zwintz, K., Barnes, T. G., Müllner, M., & Vorobyov, E. I. 2021, A&A, 654, A36 [NASA ADS] [CrossRef] [EDP Sciences] [Google Scholar]
- Testi, L., Natta, A., Manara, C. F., et al. 2022, A&A, 663, A98 [NASA ADS] [CrossRef] [EDP Sciences] [Google Scholar]
- Timmes, F. X., & Swesty, F. D. 2000, ApJS, 126, 501 [NASA ADS] [CrossRef] [Google Scholar]
- Tsukamoto, Y., Maury, A., Commerçon, B., et al. 2022, Protostars and Planets VII, accepted [arXiv:2209.13765] [Google Scholar]
- Venuti, L., Bouvier, J., Cody, A. M., et al. 2017, A&A, 599, A23 [NASA ADS] [CrossRef] [EDP Sciences] [Google Scholar]
- Vidotto, A. A., Gregory, S. G., Jardine, M., et al. 2014, MNRAS, 441, 2361 [Google Scholar]
- Vorobyov, E. I. 2011, ApJ, 729, 146 [NASA ADS] [CrossRef] [Google Scholar]
- Vorobyov, E. I., & Basu, S. 2015, ApJ, 805, 115 [NASA ADS] [CrossRef] [Google Scholar]
- Vorobyov, E. I., & Pavlyuchenkov, Y. N. 2017, AAP, 606, A5 [NASA ADS] [CrossRef] [EDP Sciences] [Google Scholar]
- Vorobyov, E. I., Elbakyan, V., Hosokawa, T., et al. 2017a, A&A, 605, A77 [NASA ADS] [CrossRef] [EDP Sciences] [Google Scholar]
- Vorobyov, E. I., Elbakyan, V., Dunham, M. M., & Guedel, M. 2017b, A&A, 600, A36 [NASA ADS] [CrossRef] [EDP Sciences] [Google Scholar]
- Vorobyov, E. I., Skliarevskii, A. M., Elbakyan, V. G., et al. 2020, A&A, 635, A196 [NASA ADS] [CrossRef] [EDP Sciences] [Google Scholar]
- Vorobyov, E. I., Elbakyan, V. G., Liu, H. B., & Takami, M. 2021, A&A, 647, A44 [EDP Sciences] [Google Scholar]
- Weber, E. J., Davis, Leverett J., 1967, ApJ, 148, 217 [NASA ADS] [CrossRef] [Google Scholar]
- White, R. J., Greene, T. P., Doppmann, G. W., Covey, K. R., & Hillenbrand, L. A. 2007, in Protostars and Planets V, eds. B. Reipurth, D. Jewitt, & K. Keil, 117 [Google Scholar]
- Winter, A. J., Clarke, C. J., Rosotti, G., et al. 2018, MNRAS, 478, 2700 [Google Scholar]
- Winter, A. J., Kruijssen, J. M. D., Chevance, M., Keller, B. W., & Longmore, S. N. 2020, MNRAS, 491, 903 [NASA ADS] [CrossRef] [Google Scholar]
- Wright, N. J., Drake, J. J., Mamajek, E. E., & Henry, G. W. 2011, ApJ, 743, 48 [Google Scholar]
- Yasui, C., Kobayashi, N., Saito, M., & Izumi, N. 2016, AJ, 151, 115 [NASA ADS] [CrossRef] [Google Scholar]
- Yasui, C., Kobayashi, N., Saito, M., Izumi, N., & Skidmore, W. 2021, AJ, 161, 139 [NASA ADS] [CrossRef] [Google Scholar]
- Zanni, C., & Ferreira, J. 2013, A&A, 550, A99 [NASA ADS] [CrossRef] [EDP Sciences] [Google Scholar]
- Zhang, Q., Claus, B., Watson, L., & Moran, J. 2017, ApJ, 837, 53 [NASA ADS] [CrossRef] [Google Scholar]
Appendix A: MESA microphysics
The MESA equation of state (EOS) is a blend of the OPAL Rogers & Nayfonov (2002), SCVH Saumon et al. (1995), PTEH Pols et al. (1995), HELM Timmes & Swesty (2000), and PC Potekhin & Chabrier (2010) EOSs.
Radiative opacities are primarily from OPAL (Iglesias & Rogers 1993, 1996), with low-temperature data from Ferguson et al. (2005) and the high-temperature Compton-scattering-dominated regime from Buchler & Yueh (1976). Electron conduction opacities are from Cassisi et al. (2007).
Nuclear reaction rates are a combination of rates from NACRE (Angulo et al. 1999), JINA REACLIB (Cyburt et al. 2010), with additional tabulated weak reaction rates (Fuller et al. 1985; Oda et al. 1994; Langanke & Martínez-Pinedo 2000). Screening is included via the prescription of Chugunov et al. (2007). Thermal neutrino loss rates are from Itoh et al. (1996).
Appendix B: Treatment of rotation in MESA
In MESA rotation is treated as a modification of the stellar equations due to centrifugal acceleration and non-spherical symmetry, when the star is rotating (see Sec. 6 in Paxton et al. 2013). Angular momentum transport due to rotation (rotational mixing) is implemented as a diffusion term, including five rotational-induced mixing processes: dynamical shear instability, Solberg–Høiland instability, secular shear instability, Eddington–Sweet circulation, and Goldreich–Schubert–Fricke instability (Paxton et al. 2013).
Appendix C: Detailed evolution of individual torque components
Here we show each component affecting the stellar spin evolution: the external torques due to the accretion process Γacc, APSW ΓW and the magnetic star-disk interaction ΓME, the internal contribution Γint, and the resulting total torque Γtot.
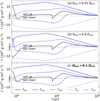 |
Fig. C.1. Evolution of the different external torque components (Γacc, Γme, and Γw: solid blue, dashed blue, and dotted blue lines, respectively), the internal contribution to the stellar spin evolution Γint (blue dash-dotted line), and the combination of these mechanisms Γtot (black solid line) for different initial rotation rates Ωinit. The value of the reference model is marked in boldface. The horizontal dashed black line divides the regions in which the star spins up and down. |
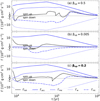 |
Fig. C.6. Same as Fig. C.1, but for different maximum energy fractions βup that can be added to the stellar interior. |
Appendix D: Influence of the initial stellar radius for βup = 0.005
In this section we show the evolution of the stellar rotation period and radius for βup = 0.005 and different initial stellar radii.
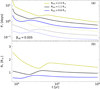 |
Fig. D.1. Evolution of the stellar rotation periods P⋆ (Panel a) and the stellar radius (Panel b) for different initial stellar radii Rinit. For these simulations βup = 0.005 is used. |
Appendix E: HRD for individual simulations
Here, we show the influence of each parameter on the HRD.
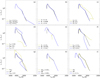 |
Fig. E.1. Intrinsic stellar luminosity L⋆ over effective temperature Teff for each model presented in Sec. 3 and Sec. 4. The reference model is marked in boldface. |
All Tables
Summary of the influence of different stellar and disk parameters on the stellar spin evolution.
All Figures
|
Fig. 1. Parameterized illustration of the stellar accretion rate and stellar mass during the first million years of stellar evolution. Panel a shows the accretion rate and Panel b shows the stellar mass over time. The yellow, black, and blue lines represent a final stellar mass of 0.3, 0.7, and 1.0 M⊙, respectively. The black dashed line (Ṁhigh) represents a different accretion history, which also results in a final stellar mass of 0.7 M⊙ at 1 Myr. |
| In the text | |
|
Fig. 2. Evolution of the reference model. The stellar rotation period and radius are shown in panels a and b, respectively. The different torque contributions are shown in panel c. The accretion torque Γacc, the influence of the magnetic star-disk interaction ΓME, the APSW torque ΓW, and the internal contributions due to variation of the stellar moment of inertia Γint are shown as a solid blue line, dashed blue line, dotted blue line, and dash-dotted blue line, respectively. The total torque Γtot, defined as the sum of the other torque contributions, is shown as a solid black line. A gray dashed line marks the change between the spin-up and spin-down regimes. |
| In the text | |
|
Fig. 3. Evolution of the stellar rotation period P⋆ for each parameter variation: initial rotation rate Ωinit (panel a), stellar magnetic field strength B⋆ (panel b), APSW efficiency W (panel c), amount of energy of the infalling material added into the star βup (panel d), the final stellar mass at 1 Myr M⋆ (panel e), and the initial stellar radius Rinit (panel f). The reference values are in boldface. For comparison, the critical rotation period is shown for each evolution as dotted lines. |
| In the text | |
|
Fig. 4. Evolution of the stellar radius R⋆ for each parameter variation (as in Fig. 3). The reference values are marked in boldface. |
| In the text | |
|
Fig. 5. Evolution of the stellar rotation period P⋆ and the stellar radius R⋆ for different variations from the reference model. Column a: region in which Ėadd is distributed, Madd = 0.01 (blue line), and using a different accretion history Ṁhigh (see Fig. 1, yellow line). Column b: low metallicity, Z⋆ = 0.1 Z⊙ (blue line), and including the influence of disk winds (model DW, yellow line). The reference model is marked in boldface. |
| In the text | |
|
Fig. 6. Comparison between rotational distribution in young clusters and rotation period range at 1 Myr of our fast and slow-rotating models (blue area). The diamonds, left-pointing triangles, and right-pointing triangles are the 50th, 5th, and 95th percentile of the rotational distribution for the respective cluster. The mean values of the 95th (5th) percentiles are indicated by the vertical dashed (dotted) line. See text for references. |
| In the text | |
|
Fig. 7. Evolution of the stellar rotation period P⋆ for the slow (blue line), reference (black line), and fast rotating models (yellow line). For comparison, the range of the mean values of the 5th and 95th percentiles is highlighted as a blue area P⋆ obs (see Sect. 4.4). |
| In the text | |
|
Fig. C.1. Evolution of the different external torque components (Γacc, Γme, and Γw: solid blue, dashed blue, and dotted blue lines, respectively), the internal contribution to the stellar spin evolution Γint (blue dash-dotted line), and the combination of these mechanisms Γtot (black solid line) for different initial rotation rates Ωinit. The value of the reference model is marked in boldface. The horizontal dashed black line divides the regions in which the star spins up and down. |
| In the text | |
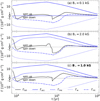 |
Fig. C.2. Same as Fig. C.1, but for different magnetic field strengths B⋆. |
| In the text | |
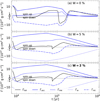 |
Fig. C.3. Same as Fig. C.1, but for different APSW efficienciesW. |
| In the text | |
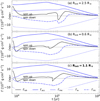 |
Fig. C.4. Same as Fig. C.1, but for different initial stellar radii Rinit. |
| In the text | |
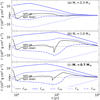 |
Fig. C.5. Same as Fig. C.1, but for different stellar masses M⋆ at an age of 1 Myr. |
| In the text | |
|
Fig. C.6. Same as Fig. C.1, but for different maximum energy fractions βup that can be added to the stellar interior. |
| In the text | |
|
Fig. D.1. Evolution of the stellar rotation periods P⋆ (Panel a) and the stellar radius (Panel b) for different initial stellar radii Rinit. For these simulations βup = 0.005 is used. |
| In the text | |
|
Fig. E.1. Intrinsic stellar luminosity L⋆ over effective temperature Teff for each model presented in Sec. 3 and Sec. 4. The reference model is marked in boldface. |
| In the text | |
Current usage metrics show cumulative count of Article Views (full-text article views including HTML views, PDF and ePub downloads, according to the available data) and Abstracts Views on Vision4Press platform.
Data correspond to usage on the plateform after 2015. The current usage metrics is available 48-96 hours after online publication and is updated daily on week days.
Initial download of the metrics may take a while.